Adobe: The Record Says Steady Compounder — the Price Says Something Broke
Adobe has grown revenue at a 13.06% compound rate since FY2020 and expanded operating margin by 370 basis points, with ROIC near 37%. The stock closed today 31.53% below its longest-tracked published fair value, down 27.54% over the past year. This note reads the record and the tape side by side.

Revenue CAGR 13.06% (FY2020–FY2025) · operating margin +370 bp to 36.63% · ROIC 36.79% (TTM) · close 235.55, down 31.53% against the Morningstar fair value of 344.00
The story in 30 seconds
- The five-year record is a steady, unspectacular compounder: revenue grew from $12.87B in FY2020 to $23.77B in FY2025, a 13.06% compound rate, while operating margin expanded 370 basis points to 36.63% and free cash flow compounded at 13.17%, essentially matching the revenue rate.
- The price tells a different story. The stock closed today at 235.55, down 4.25% on the day, 13.55% over three months and 27.54% over the past year. It now trades 4.07% below its own 50-day average and 4.69% below its 200-day average, 34.12% off its 52-week high.
- The open question is whether the technical score of 31.0 — the weakest cell on an otherwise top-tier scorecard — is pricing a real growth slowdown, or has simply outrun three independent fair-value models that all sit well above the current price, from 344.00 to 771.12.
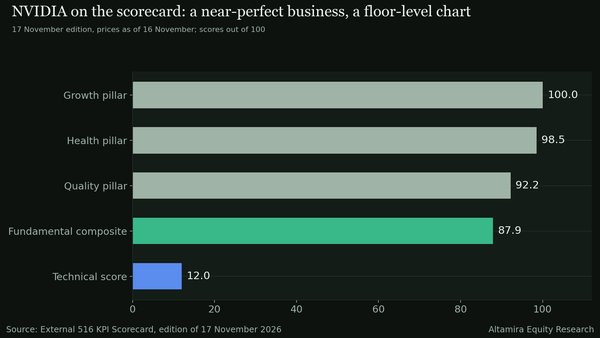
Adobe's fundamental composite on the Altamira KPI Scorecard is 83.6, built from a quality pillar of 93.7, a value pillar of 95.1 and a shareholder pillar of 100.0 — among the strongest profiles the scorecard tracks. The same edition scores the stock's technical state at 31.0 and labels it DRIFTING, tier 3, a blended total of 67.8 against a company whose last print beat on both lines and whose five-year operating-margin trend has been one of gradual, not dramatic, improvement. A reader looking only at the fundamentals would call this one of the more attractively priced top-tier names on the sheet; a reader looking only at the tape would call it a name the market has lost interest in. Both readings use real numbers, and this note sets out what each one is actually measuring.
Adobe sells software across three segments — Digital Media (Creative Cloud, Document Cloud), Digital Experience and Publishing and Advertising — a subscription business that has moved, over five fiscal years, from $12.87B to $23.77B in revenue with margin and cash conversion both improving steadily rather than in a single step change. The valuation and scorecard sections below are what the market is doing with that steady record a little over three weeks before the next print.
In this post: (1) how Adobe makes money today, from the latest filed quarter; (2) the five-year record across four lenses; (3) what the cash and share-count lines say about the quality of the earnings; (4) what the price already assumes against three published fair-value models; (5) the scorecard's own read, pillar by pillar; (6) the honest counterweight and the Key Issue ahead of the December 9 print.
How Adobe makes money
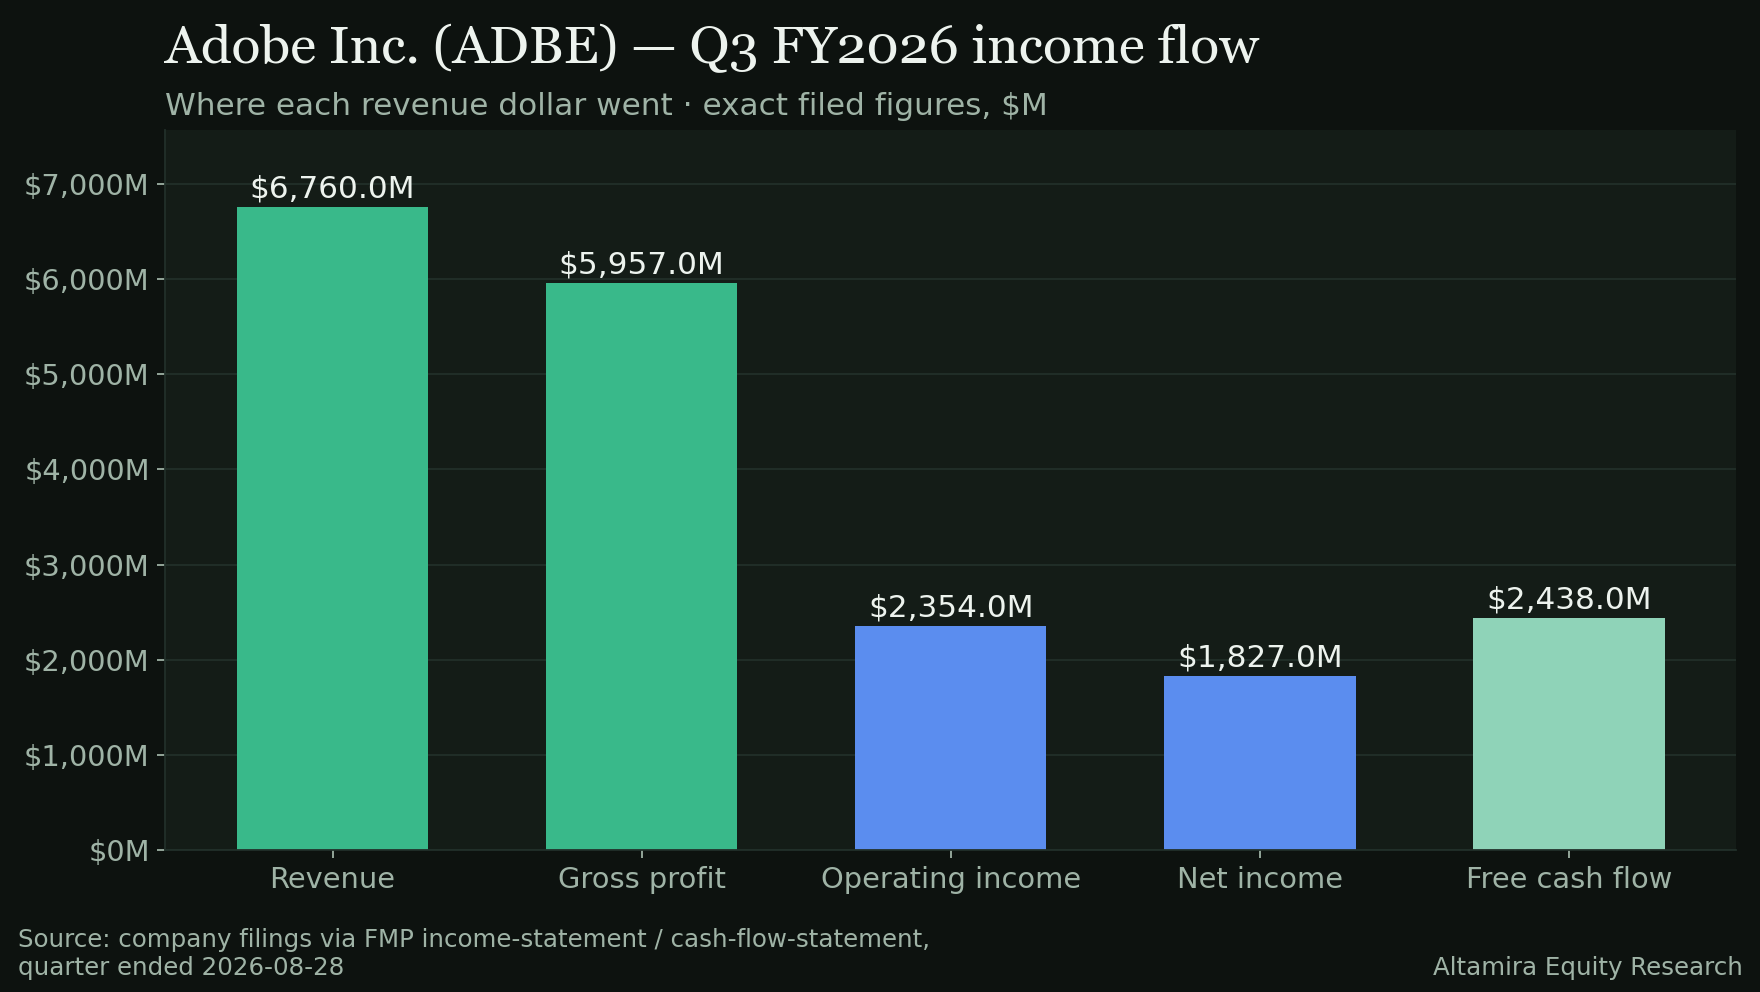
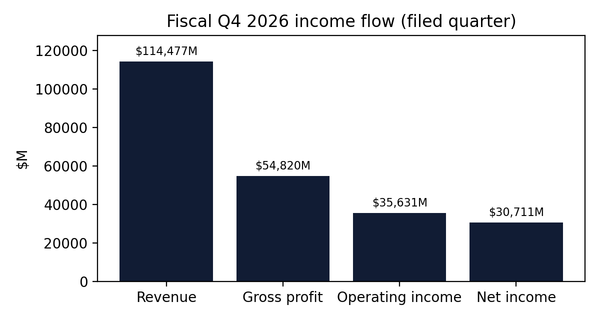
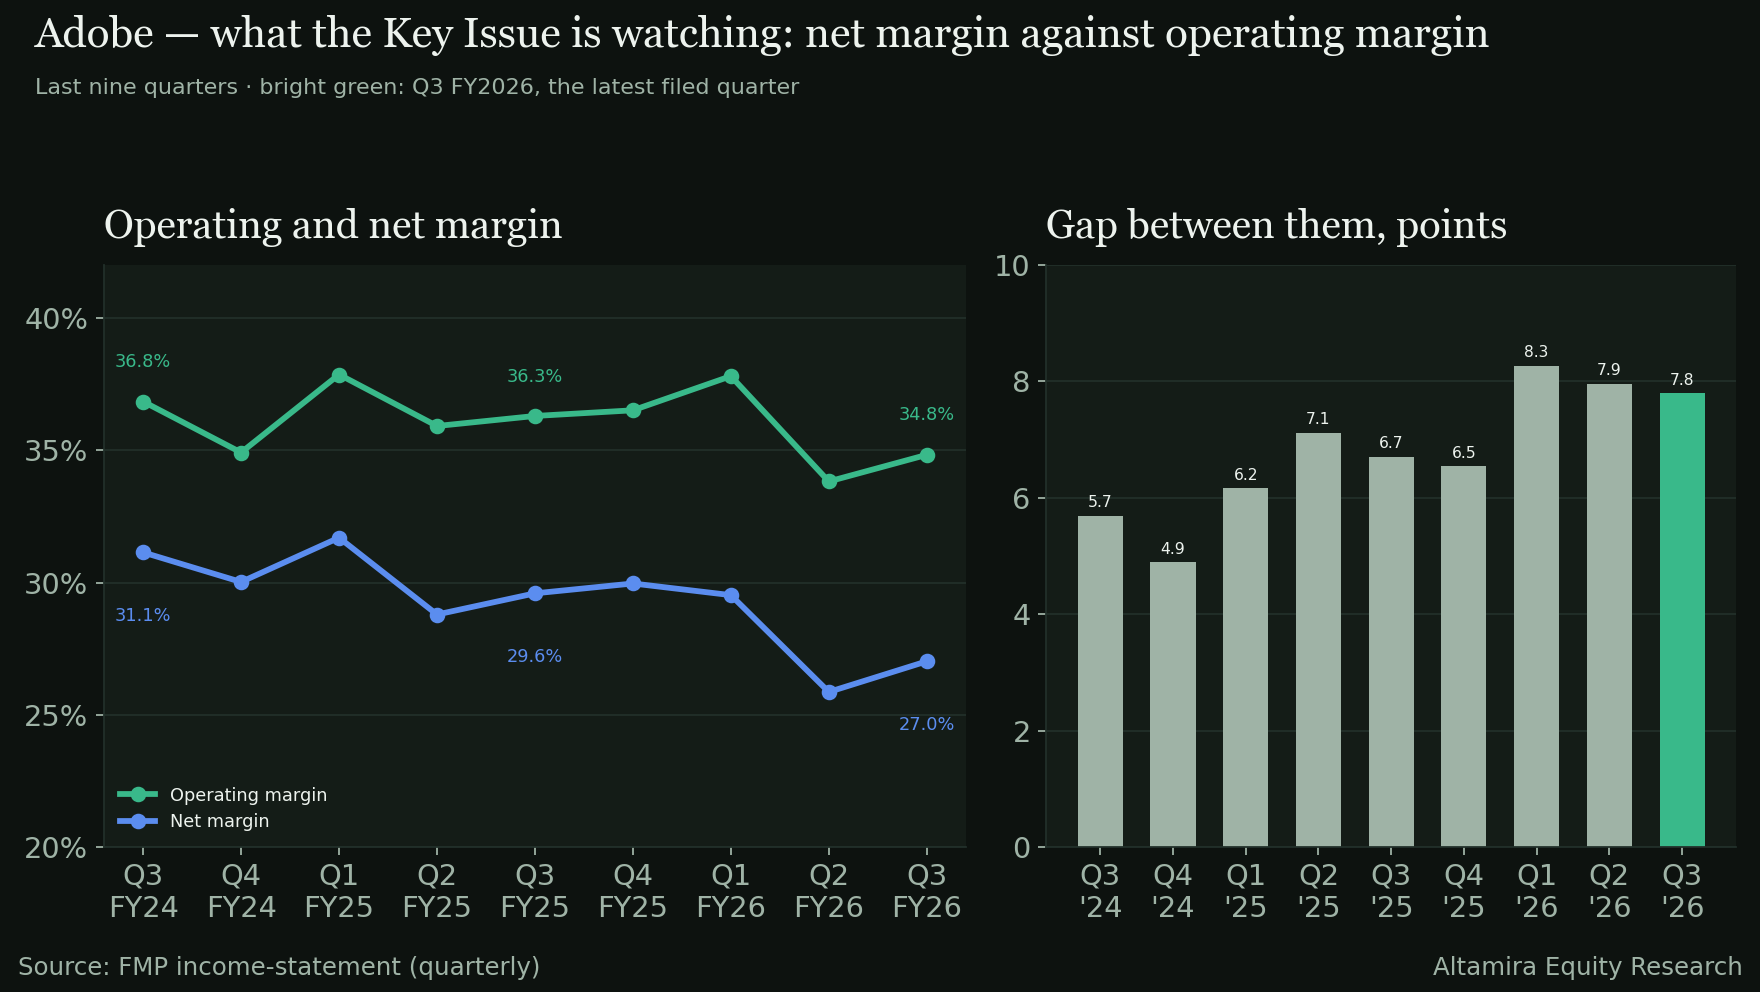
In the latest filed quarter, Q3 FY2026 (period ended August 28, 2026): revenue of $6,760.0M, up 12.89% year over year and 2.15% sequentially. Cost of revenue was $803.0M (11.88% of revenue), leaving a gross profit of $5,957.0M (88.12%). Operating expenses were $3,603.0M (53.30%) — R&D of $1,288.0M (19.05%) and SG&A of $2,315.0M (34.25%) — producing operating income of $2,354.0M, a 34.82% operating margin, up 8.33% year over year. Pre-tax income was $2,357.0M (34.87%); income tax of $530.0M (7.84%) left net income of $1,827.0M, a 27.03% net margin, up 3.10% year over year. Free cash flow was $2,438.0M, 36.07% of revenue.
The swing line quarter over quarter is operating margin, which rose 101 basis points sequentially to 34.82% even as net margin rose faster, 116 basis points, to 27.03% — a quarter where cost discipline below the operating line added as much to the bottom line as the business itself did.
The long view — FY2020 to FY2025
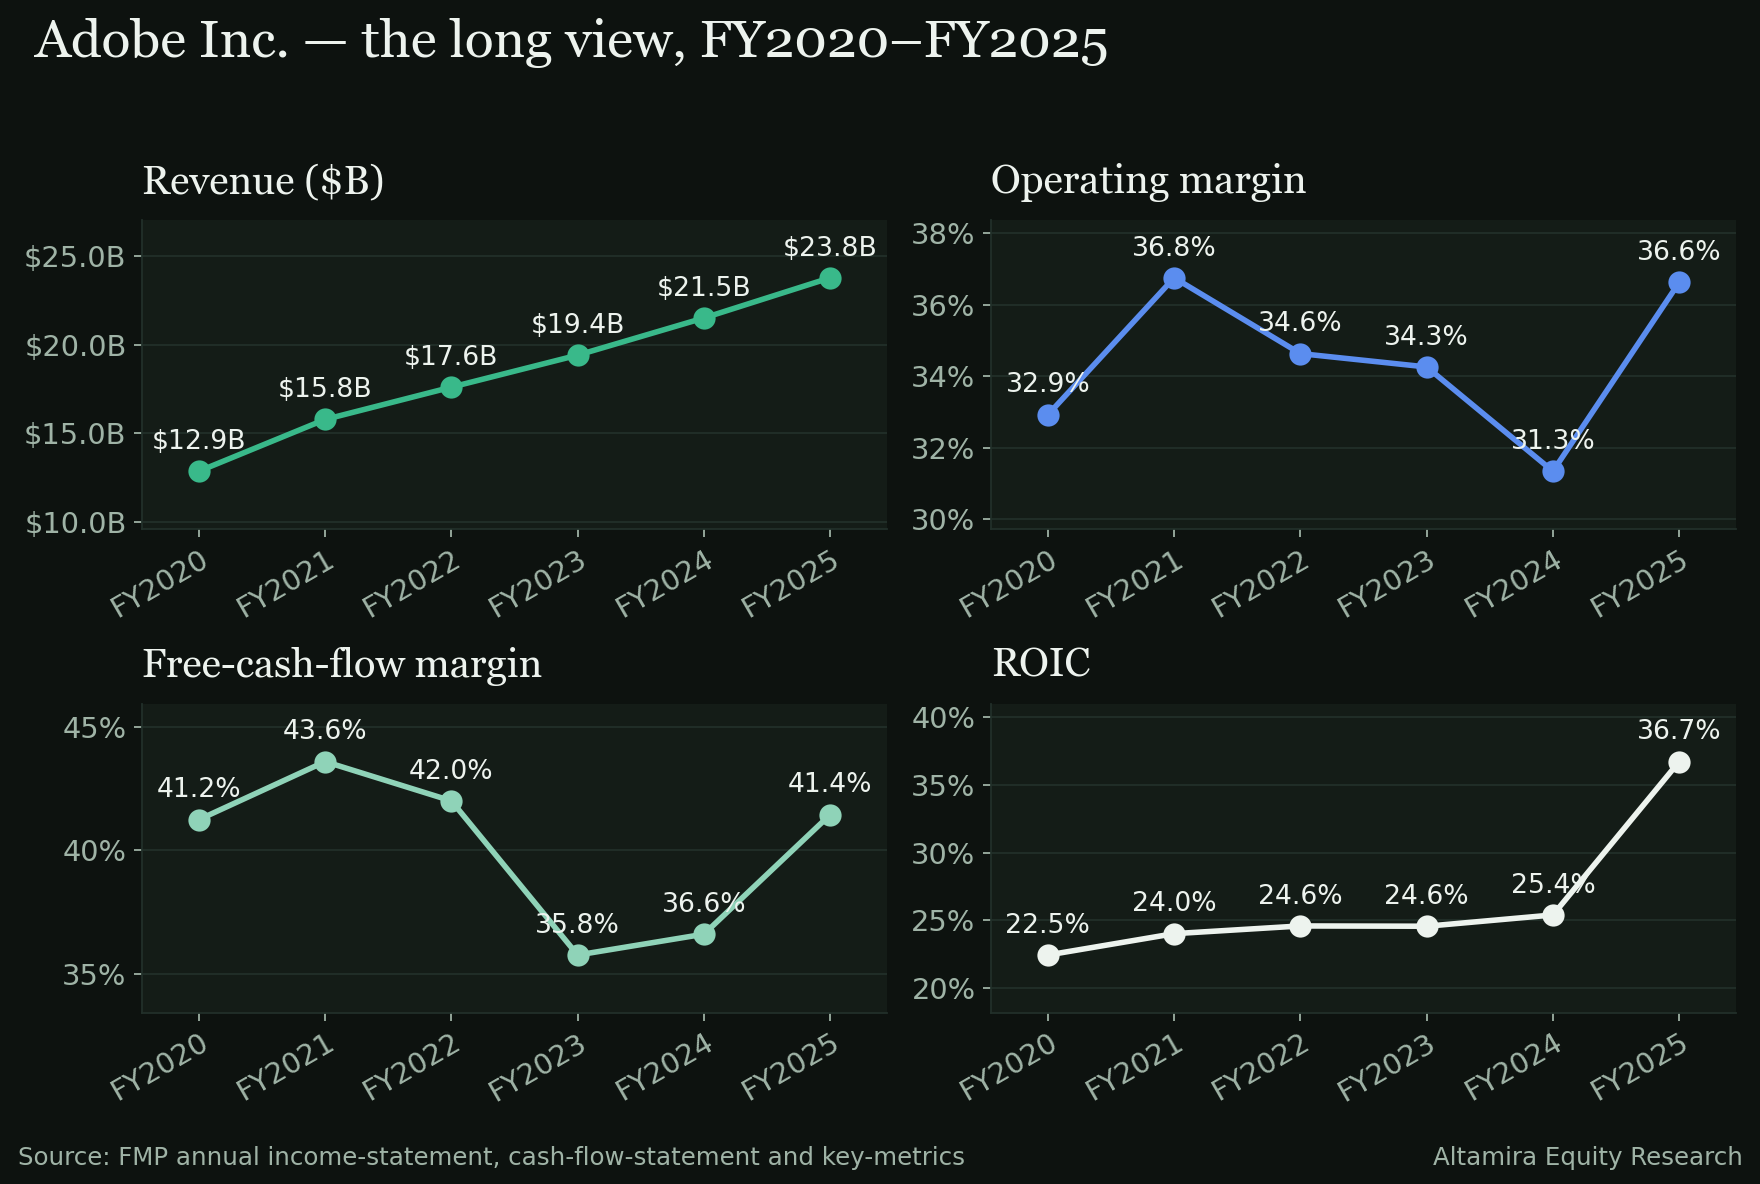
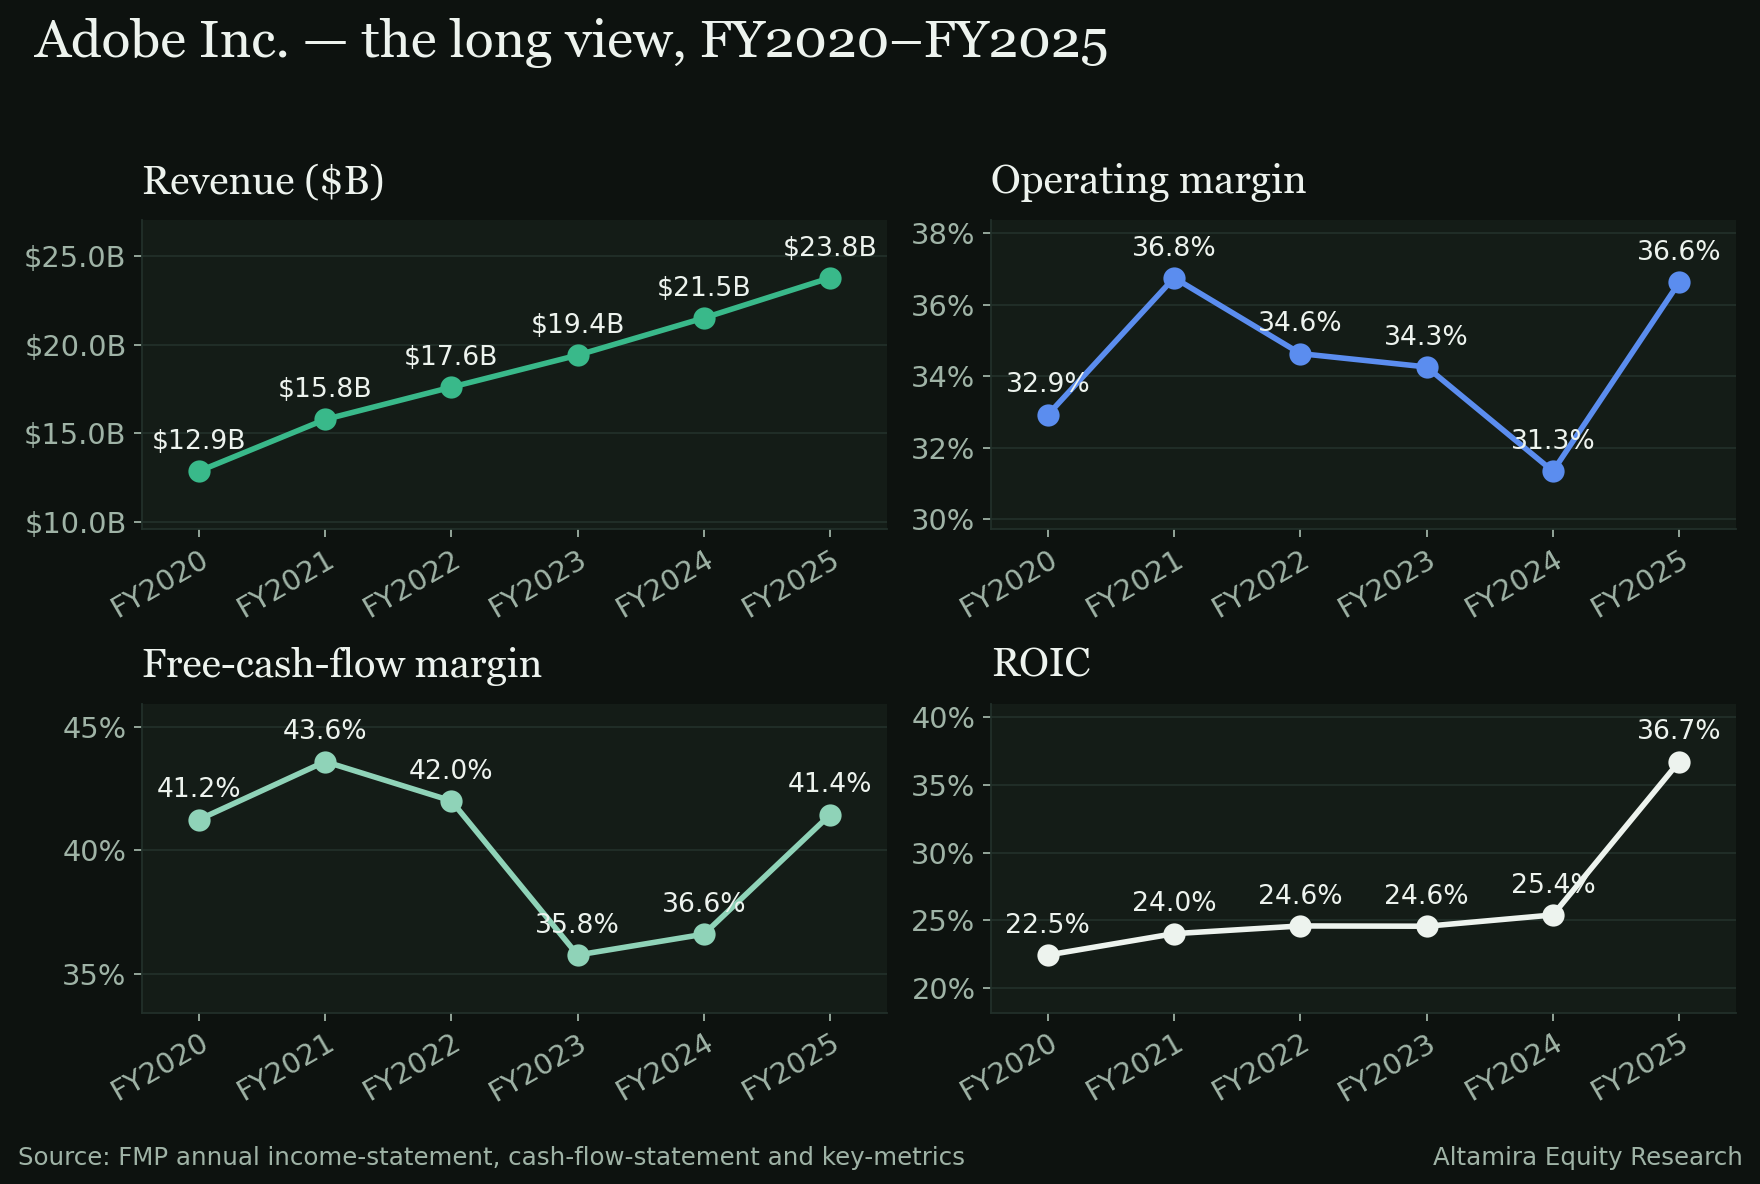
- Revenue growth. $12.87B in FY2020 to $23.77B in FY2025, a 13.06% compound rate — steady rather than explosive, with every year in the series showing positive growth.
- Operating margin. 32.93% in FY2020 to 36.63% in FY2025, a net gain of 370 basis points, though not in a straight line: the margin dipped to 31.35% in FY2024 before recovering to its five-year high the following year.
- Cash. Free-cash-flow margin moved from 41.25% in FY2020 to 41.45% in FY2025 — essentially unchanged on a five-year basis, after a trough of 35.77% in FY2023; free cash flow compounded at 13.17%, in line with the 13.06% revenue rate.
- ROIC. 22.46% in FY2020 to 36.69% in FY2025, rising in every year of the series — the most consistently improving of the four lenses, and the one with no down year to explain.
Quality of earnings
Net income in the latest quarter grew 3.10% year over year to $1,827.0M, well behind the 12.89% revenue growth and the 8.33% operating-income growth — a gap that shows up in the 257-basis-point year-over-year decline in net margin, steeper than the 147-basis-point year-over-year decline in operating margin. Free cash flow of $2,438.0M was 133.44% of net income, comfortably ahead, with operating cash flow of $2,523.0M against capital expenditure of just $85.0M.
Diluted share count was 395,000,000, down 6.86% year over year and 1.74% sequentially — a business returning capital almost entirely through buybacks of $2,232.0M in the quarter, with no dividend paid. The balance sheet at August 28, 2026 carried $5,639.0M of cash and short-term investments against $6,762.0M of total debt, for net debt of $2,403.0M — modest leverage against $11.76B of shareholders' equity.
Valuation — what the price already says
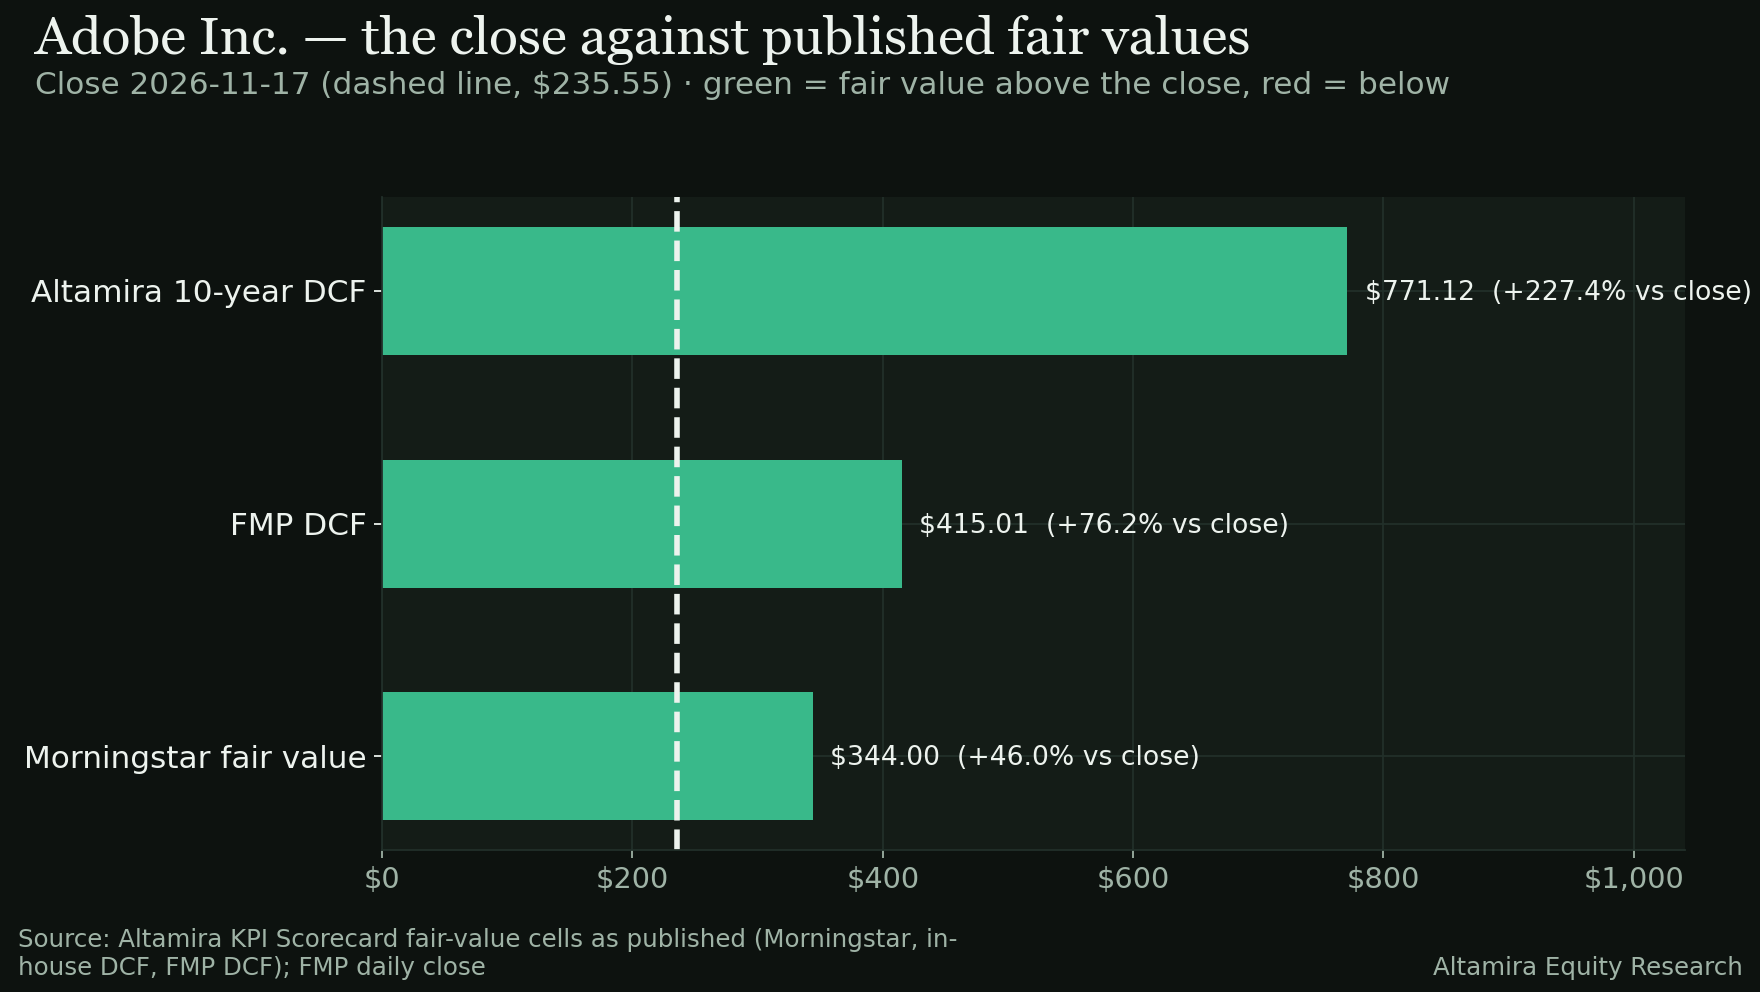
At the November 17, 2026 close of 235.55, the stock sits below all three fair-value figures the KPI Scorecard carries for Adobe:
| Source | Fair value | As of | Price vs fair value | Fair value vs price |
|---|---|---|---|---|
| Morningstar fair value | 344.00 | 2026-09-11 | −31.53% | +46.04% |
| FMP DCF | 415.01 | 2026-11-14 | −43.24% | +76.19% |
| Altamira 10-year DCF | 771.12 | n/a | −69.45% | +227.37% |
The published range runs from 344.00 to 771.12 — every model above the current price, with the gap narrowest against the Morningstar figure (margin of safety 28.49%) and widest against Altamira's own in-house DCF. Fair value is stated as published in the dataset; analyst price targets are excluded from this comparison (R7). On a trailing basis the stock trades at a P/E of 13.12 with a free-cash-flow yield of 11.55% and ROIC of 36.79%.
The scorecard read
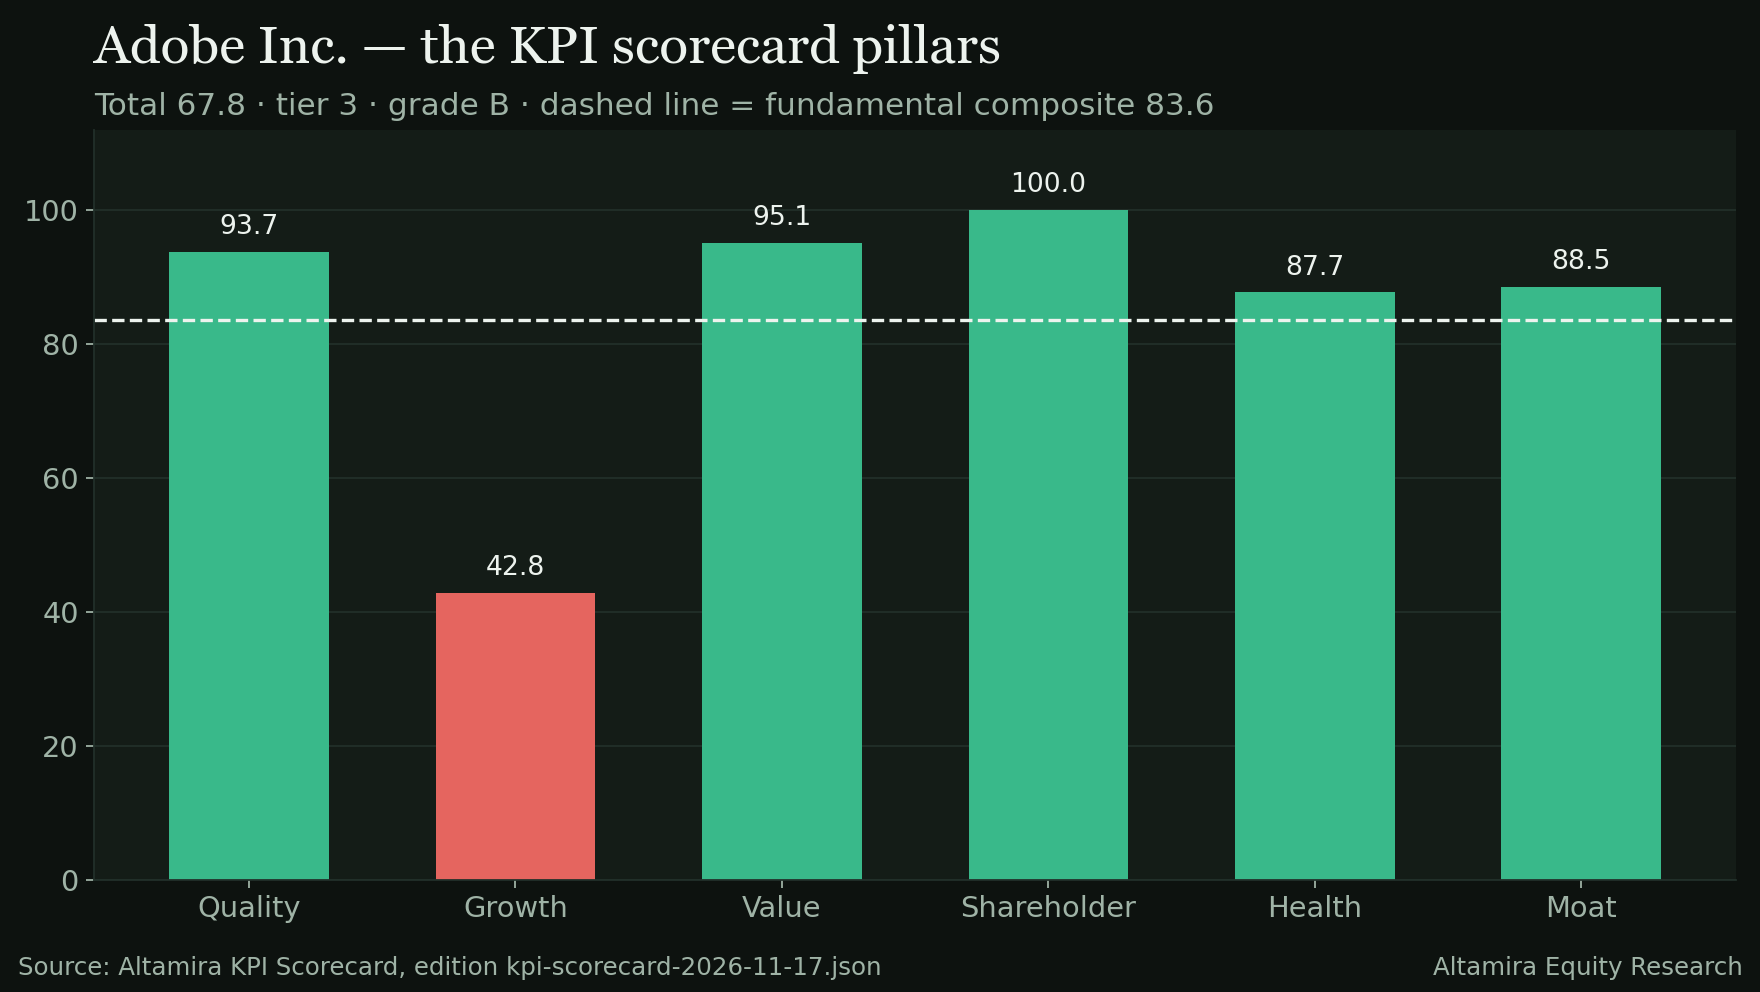
The November 17, 2026 edition of the Altamira KPI Scorecard has Adobe at a fundamental composite of 83.6 — shareholder 100.0, value 95.1 and quality 93.7 all near the top of the pillar scale, health 87.7 and moat 88.5 a step behind, growth 42.8 the clear laggard. The technical score is 31.0, well below every fundamental pillar, producing a blended total of 67.8, tier 3, grade B, state DRIFTING, rank 40 with a one-day delta of 1.9. Five of the six fundamental pillars sit well above the technical pillar's 31.0; that one pillar, together with the growth pillar, is most of the reason the blended total sits below the fundamental composite.
The honest counterweight
Three cells argue against reading the fair-value gap as simply mispriced.
- The growth pillar is the weakest fundamental cell, at 42.8. A 13.06% five-year revenue CAGR is steady, not fast, for a software name trading at a software multiple; the market may be pricing a maturing growth rate rather than a temporary discount.
- The technical state is DRIFTING, not merely weak. A score of 31.0 against a stock down 27.54% over twelve months is not a single bad quarter; shares sit below both the 50-day and 200-day averages, and the scorecard's own state label reflects a trend, not a snapshot.
- Net income is growing slower than revenue. A 257-basis-point year-over-year decline in net margin, steeper than the 147-basis-point decline in operating margin, is the kind of gap that needs to close rather than simply be explained by below-the-line items.
The Key Issue
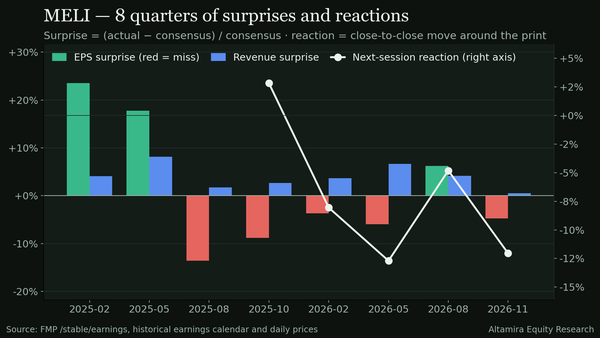
Whether the December 9, 2026 print — consensus revenue of $6.83B (+10.25% YoY) and EPS of 6.33 (+15.09% YoY implied against the prior quarter's actual) — shows net margin recovering toward its historical relationship with operating margin, or confirms this quarter's gap as a new pattern. That single cell, more than the share price, is what would resolve the gap between the fundamental composite and the technical score.
Sources
- FMP /stable/earnings (actuals vs consensus, eight quarters), /historical/earning_calendar/ADBE (report timing), /historical-price-full/ADBE (daily closes; moving averages, ranges and the day's move computed from them) — pulled November 18, 2026.
- FMP /income-statement, /cash-flow-statement, /balance-sheet-statement (quarterly, nine quarters; the Q3 FY2026 statements filed September 22, 2026) and the annual statements plus /key-metrics for FY2020–FY2025 — pulled November 18, 2026.
- FMP /analyst-estimates and /key-metrics-ttm — pulled November 18, 2026.
- Altamira KPI Scorecard, edition 2026-11-17 (kpi-scorecard-2026-11-17.json): composite, pillar and technical scores, tier, state and fair-value cells as published. Fair value is stated as published in the dataset.
- Morningstar fair value and estimate cells: Morningstar, dated September 11, 2026, read September 14, 2026 — cited as Morningstar's view, not Altamira's.
- Guidance, segment detail and management commentary: NOT STATED — the earnings-call transcript is not in the dataset for this edition.
Research for information only — not investment advice; see Disclosures.
On the data pages
- ADBE company page — the filed figures, margins, cash flow and the print history, from SEC EDGAR.
- ADBE vs NVDA, head to head — the two on the same scorecard cells (top composite in Technology (kpi-scorecard-2026-11-17.json)).
- Verdict ledger — every public call, on the record.
- Earnings schedule — who reports next, and how every print this season graded.