MercadoLibre: The Revenue Beat Keeps Coming — the Margin Keeps Shrinking
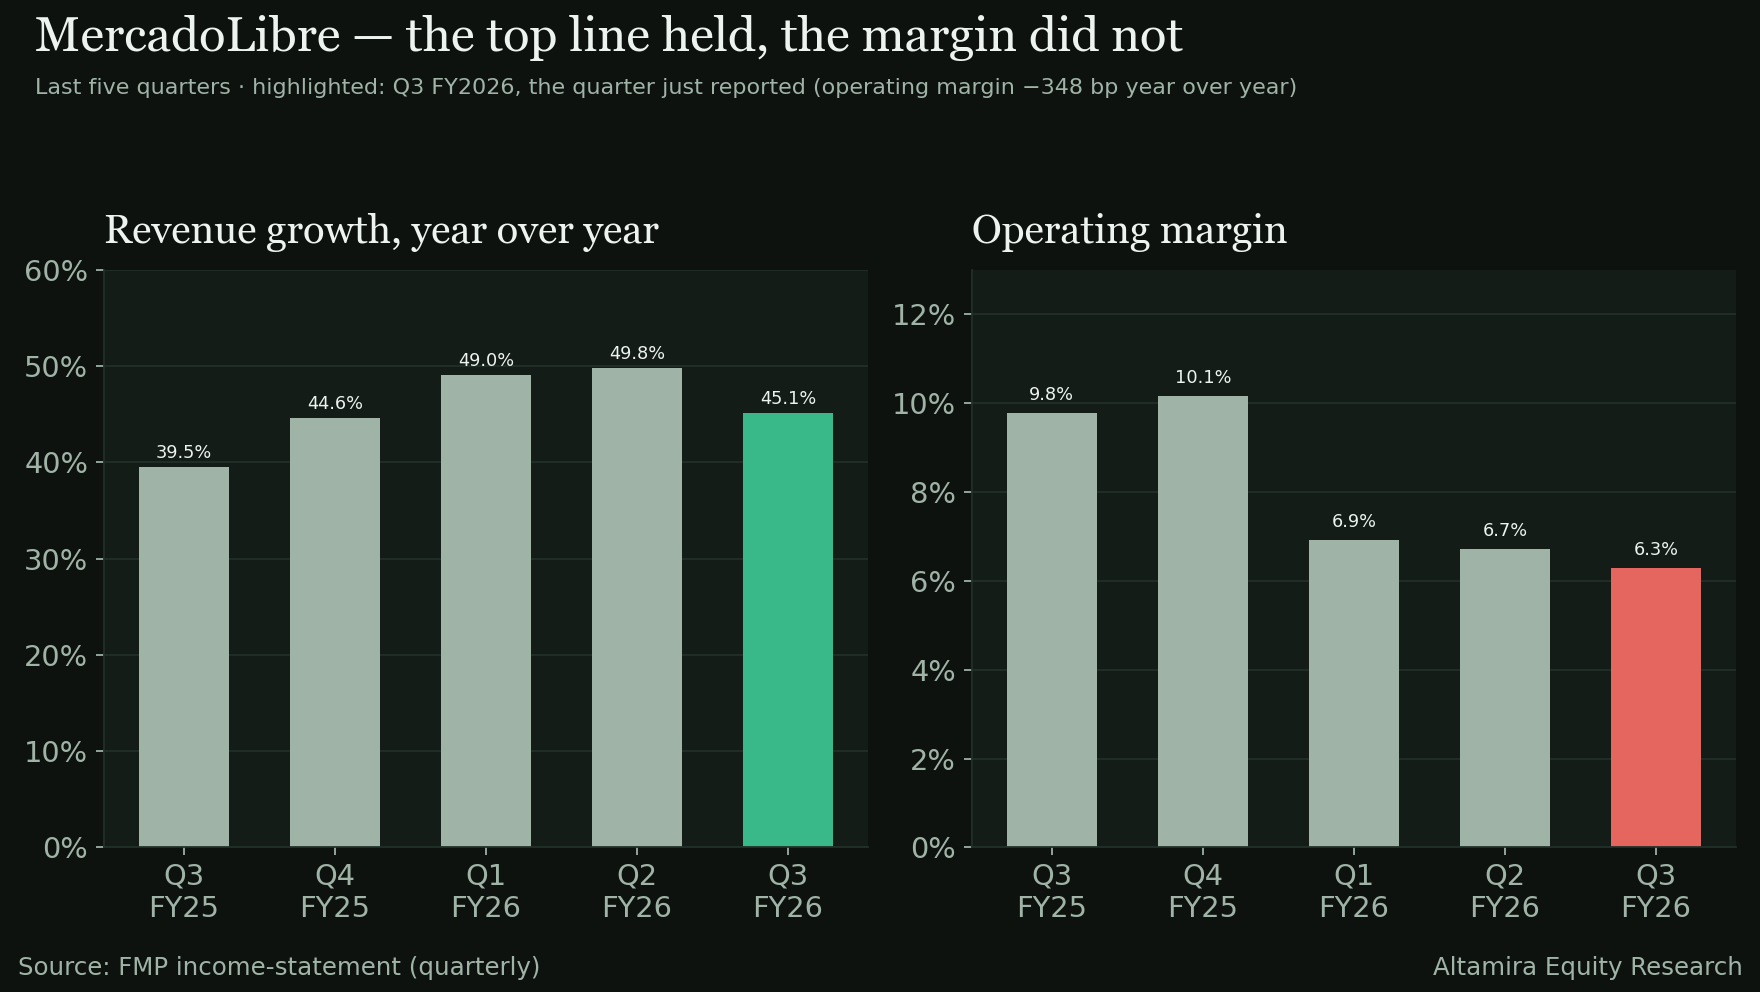
MercadoLibre beat on revenue for an eighth straight quarter but missed EPS by 4.75% as operating margin fell 348 basis points year over year. The stock fell 12.05% on the print and has kept falling since, closing today at a new 52-week low.

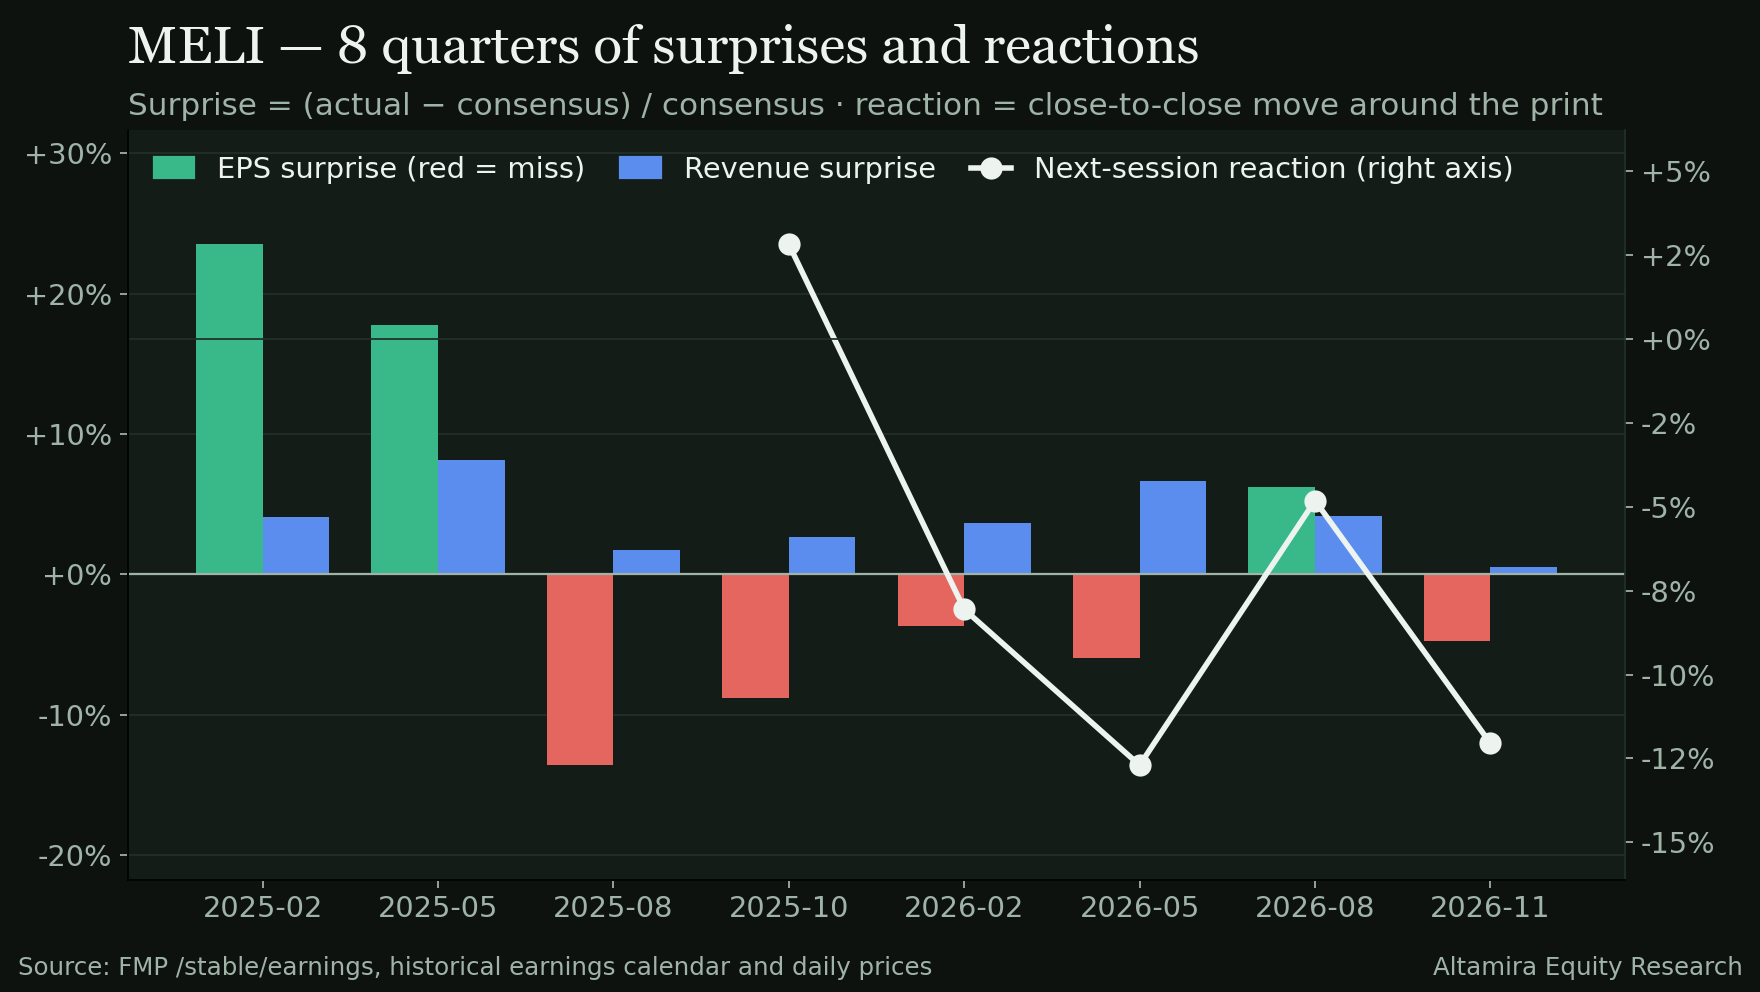
Revenue $10.75B, +0.56% vs estimate and +45.09% YoY · EPS 8.83 missed by 4.75% · operating margin 6.29%, −348 bp YoY · stock −12.05% on the print and down further since, to a new 52-week low
The story in 30 seconds
- MercadoLibre reported its third fiscal quarter on November 4, 2026: revenue of $10.75B beat the $10.69B estimate by 0.56% and grew 45.09% year over year, the eighth straight quarter the company has beaten the revenue line. EPS of 8.83 missed the 9.27 estimate by 4.75%, grade F on our rubric.
- The headline growth hides a margin story: operating margin fell to 6.29%, down 348 basis points year over year and 43 basis points sequentially, and free-cash-flow margin fell 1,236 basis points to 22.76% — the fourth straight quarter of year-over-year margin compression.
- The open question is whether the market's 12.05% drop on the print, 1.5x the usual reaction, was a one-session overreaction or a repricing of a business whose costs are growing faster than its revenue — a question the stock's continued decline since the print, to a new 52-week low, has not yet answered either way.
Read quickly, this looks like another quarter of the growth story that has defined MercadoLibre for five years: revenue up 45.09% year over year, the eighth consecutive beat on that line. The correct reading sits one line down the income statement. EPS missed consensus by 4.75% — the fifth EPS miss in the last eight quarters, even though revenue beat the estimate in every one of those eight quarters. Growth and profitability have stopped moving together, and this print extended that pattern rather than breaking it.
MercadoLibre operates e-commerce marketplaces and the Mercado Pago fintech platform across Latin America, a business that has compounded revenue at 48.70% a year since FY2020. The same five years show operating margin peaking in FY2023 at 14.61% and falling in each of the two years since, to 11.08% in FY2025 — the backdrop against which this quarter's 348-basis-point year-over-year margin decline is not a surprise but a continuation.
In this post: (1) the quarter against the pattern of revenue beats and EPS misses; (2) where the revenue dollar went, in one chart; (3) what to make of the margin, cash and share-count lines; (4) the five-year record against this one quarter; (5) the honest counterweight and the Key Issue for February.
At a glance — Q3 FY2026
- Revenue: $10.75B vs $10.69B expected · +0.56% surprise · +45.09% YoY
- EPS: 8.83 vs 9.27 expected · −4.75% surprise
- Guidance: NOT STATED — the earnings-call transcript is not in the dataset; no guidance class is assigned and none is invented here
- Reaction: −12.05% close to close, from 1,739.88 (2026-11-04) to 1,530.28 (2026-11-05) · 1.5x the 8-quarter average absolute move of 8.09%
- Margins: gross 40.78% (−253 bp YoY, −12 bp QoQ) · operating 6.29% (−348 bp YoY, −43 bp QoQ) · net 4.17% (−151 bp YoY, −42 bp QoQ) · free cash flow 22.76% (−1,236 bp YoY, −891 bp QoQ)
- Cash generation: operating cash flow $2,950.0M · capital expenditure −$503.0M · free cash flow $2,447.0M · free cash flow to net income 546.21%
- Dividend and share count: no dividend, no buybacks this quarter · diluted shares 50,697,106, essentially flat YoY and QoQ
- Balance sheet: cash & short-term investments $7,411.0M · total debt $13.04B · net debt $8,873.0M · shareholders' equity $8,200.0M · inventory $1,028.0M
Since the print: the stock closed at 1,530.28 the session after the print (2026-11-05) and has kept falling, closing at 1,436.83 as of November 17 — a further decline of roughly 6.11%, and a decline of roughly 17.42% from the 1,739.88 close just before the print. Today's close is also a new 52-week low, 37.39% below the 52-week high of 2,295.00.
The quarter in one line: an eighth straight revenue beat arrived with a fifth EPS miss in eight quarters and the steepest margin compression of the last four, and the market's reaction — a 12.05% drop that has since widened to 17.42% — is the quarter's real verdict.
Q3 FY2026 flow — where the revenue dollar went
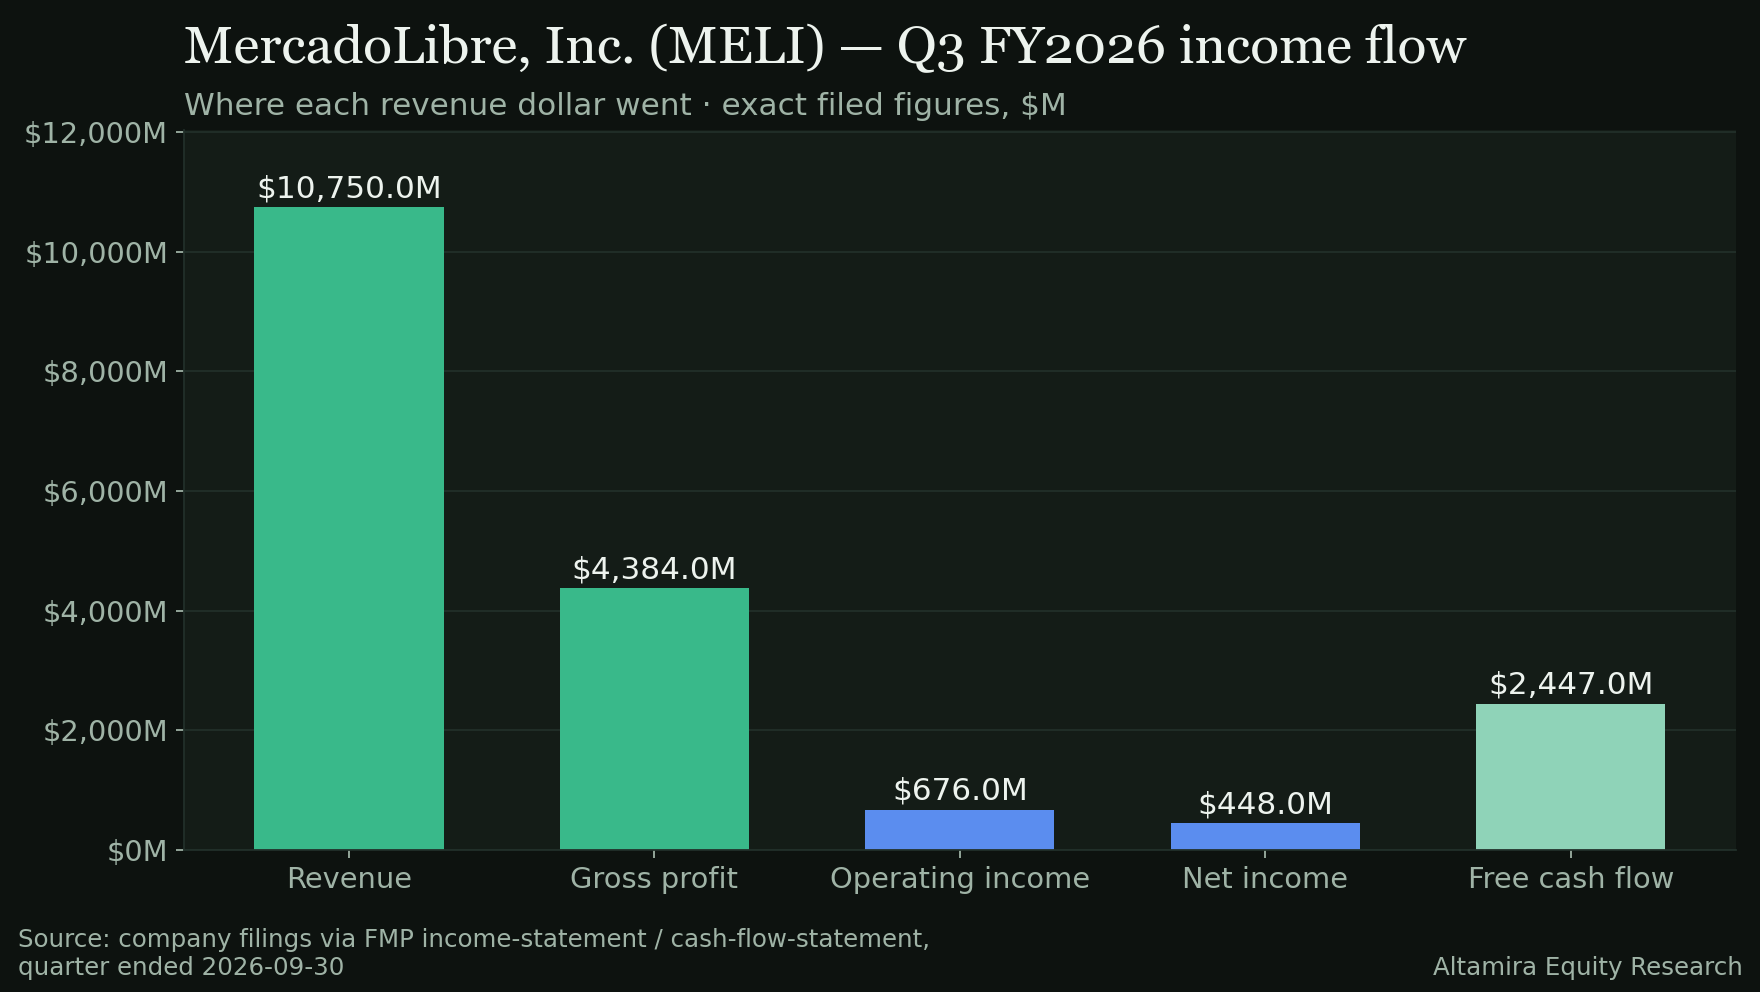
- Revenue: $10.75B (100.00%)
- Cost of revenue: $6,366.0M (59.22%)
- Gross profit: $4,384.0M (40.78%)
- R&D: $745.0M (6.93%) · SG&A: $1,621.0M (15.08%) · Other expenses: $1,342.0M (12.48%)
- Operating expenses: $3,708.0M (34.49%)
- Operating income: $676.0M (6.29%), −6.63% YoY
- Pre-tax income: $601.0M (5.59%) · Income tax: $153.0M (1.42%)
- Net income: $448.0M (4.17%), +6.41% YoY
The swing item is "Other expenses" at $1,342.0M, 12.48% of revenue — a line large enough on its own to explain most of the gap between the 40.78% gross margin and the 6.29% operating margin, ahead of either R&D or SG&A individually.
What to make of this print
- Revenue growth is still exceptional in isolation. 45.09% year over year is the fastest of any name in this coverage set this week, and the eighth straight quarter the top line has beaten consensus.
- But EPS has missed more often than it has beaten. Five of the last eight quarters have missed the EPS estimate, even as revenue beat the estimate in all eight — a split that says the market is modeling costs MercadoLibre is not controlling to plan.
- Operating margin compression is now a multi-quarter trend, not a one-off. 348 basis points year over year and 43 basis points sequentially, the fourth consecutive year-over-year decline.
- Free cash flow is still large in absolute terms but shrinking as a share of revenue. $2,447.0M of free cash flow is 22.76% of revenue, down 1,236 basis points year over year and 891 basis points sequentially — the steepest FCF-margin decline in the quarterly series shown here.
- Quality of earnings is mixed. Free cash flow of $2,447.0M covered 546.21% of the $448.0M net income figure, a sign the gap between net income and cash generation is working in the company's favor this quarter even as both lines decelerate; diluted share count was essentially flat year over year and quarter over quarter, so the EPS miss is not a buyback or dilution story.
- The balance sheet carries more debt than cash. Net debt of $8,873.0M against $8,200.0M of shareholders' equity is a leverage position worth watching if margin compression continues.
- The market's reaction was unusually large and has not reversed. A 12.05% one-day drop, 1.5x the average of the last eight prints, followed by a further 6.11% decline over the next eight trading sessions to a new 52-week low — the opposite of the "overreaction that fades" pattern.
Takeaway: the top line is doing everything a growth investor could ask; the margin and EPS lines are doing the opposite, and this quarter extended both patterns rather than resolving either one.
The long view — FY2020 to FY2025
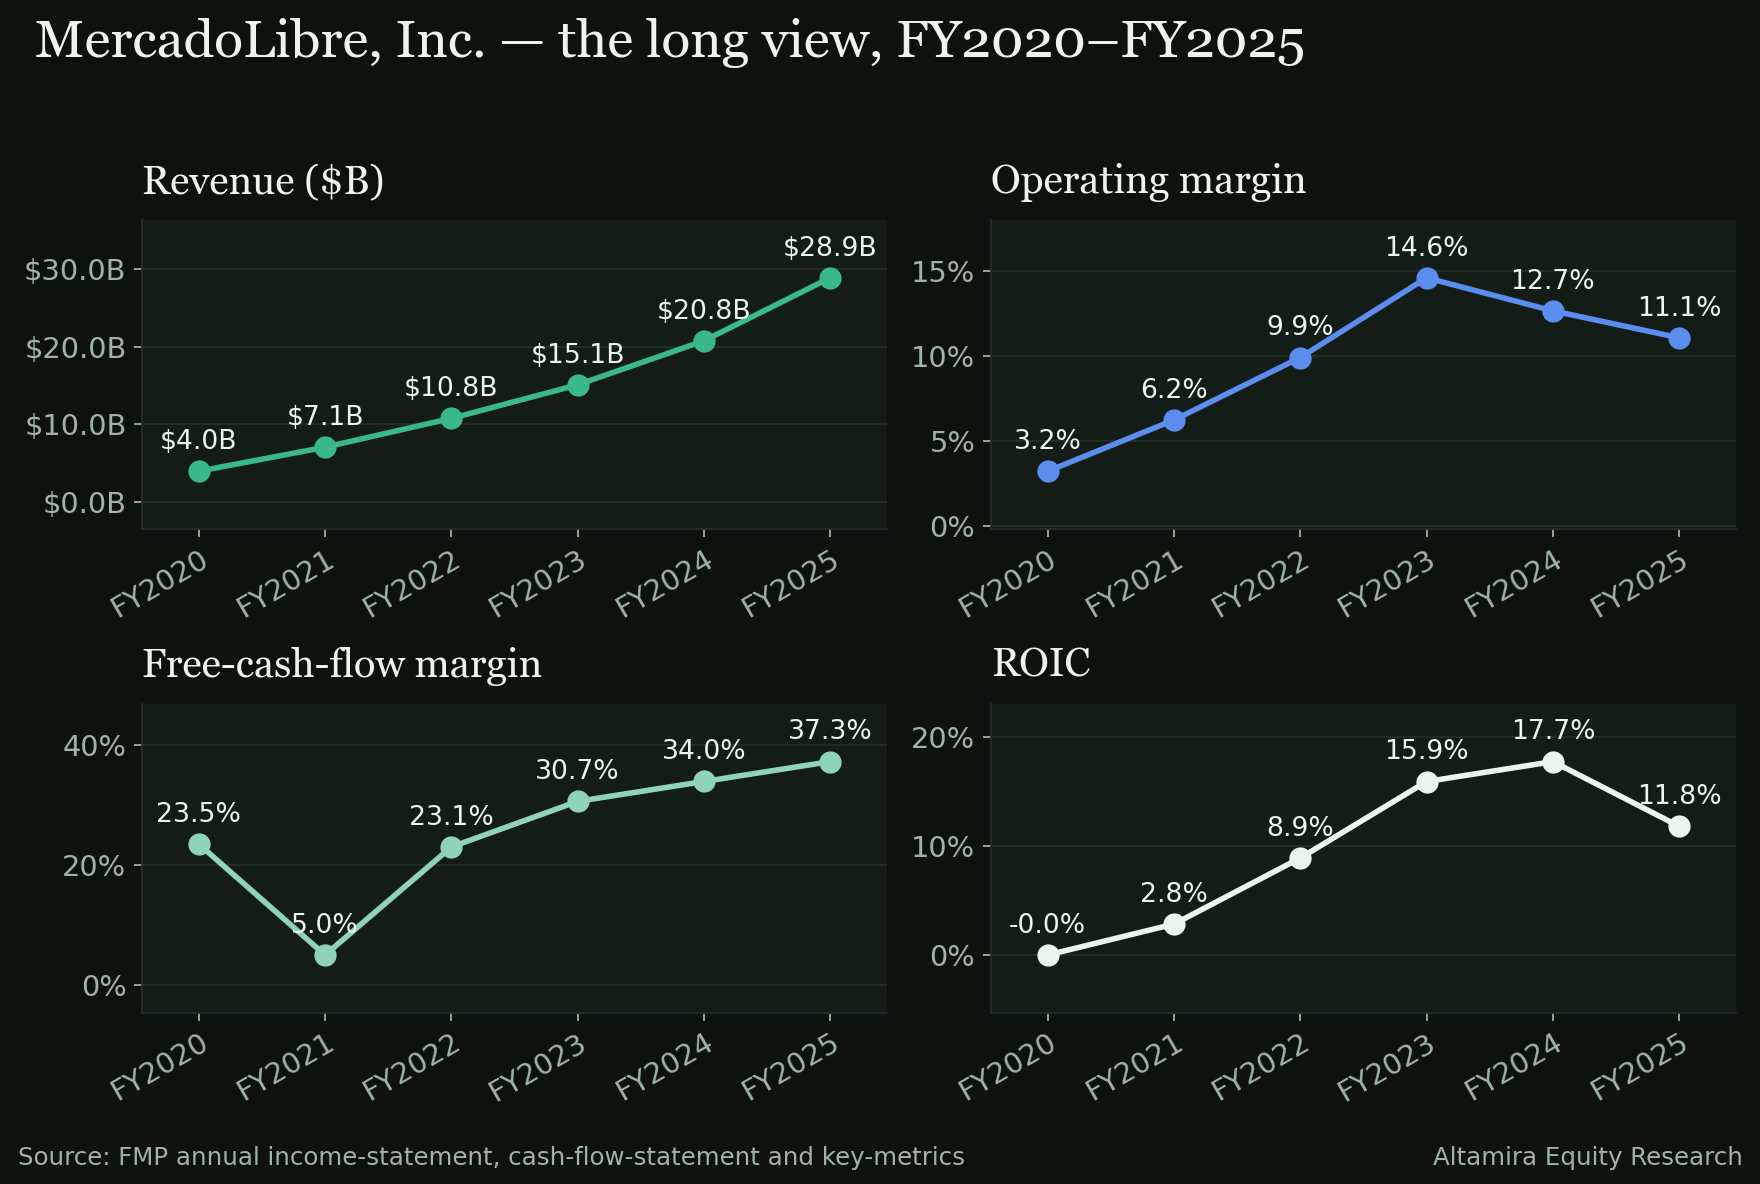
- Revenue growth. $3.97B in FY2020 to $28.89B in FY2025, a 48.70% compound rate — one of the fastest in this coverage set, with no single year below 2026's YTD pace.
- Operating margin. 3.22% in FY2020 to a peak of 14.61% in FY2023, then down two straight years to 12.66% in FY2024 and 11.08% in FY2025 — a net gain of 786 basis points over five years that masks two consecutive years of give-back.
- Cash. Free-cash-flow margin moved from 23.54% in FY2020 to a trough of 5.03% in FY2021, then recovered to 37.29% in FY2025; free cash flow compounded at 63.03%, faster than the 48.70% revenue rate.
- ROIC. −0.05% in FY2020 to a peak of 17.73% in FY2024, then down to 11.78% in FY2025 — the same two-year pattern as operating margin, and the lens most directly echoed by this quarter's 348-basis-point operating-margin decline.
The honest counterweight
Three cells argue against reading this quarter as the start of a deeper problem rather than noise in a long growth story.
- Revenue has beaten the estimate in all eight of the last eight quarters. Whatever is pressuring margin, it has not slowed the top line, which remains the business's core engine.
- Free cash flow still covers net income by more than 5x. A 546.21% FCF-to-net-income ratio this quarter is not the profile of a business burning cash to grow; the margin compression is showing up in GAAP earnings before it shows up in cash generation.
- The FY2021 record shows margin can recover from a trough. Operating margin fell to 6.24% in FY2021 before climbing to a 14.61% peak two years later — the company has compressed and then re-expanded margin before.
The Key Issue
Whether the February 23, 2027 print — consensus revenue of $11.99B (+36.91% YoY) and EPS of 10.14 (−8.07% YoY implied against the prior quarter's actual) — shows operating margin stabilizing or compressing a third straight year. That single cell, more than the quarter just reported, is what will decide whether the stock's new 52-week low reflects a temporary repricing or the market getting ahead of a real trend.
Thesis verdict
Strained — grade F. Revenue growth remains among the fastest in this coverage set, but EPS has missed in five of the last eight quarters even as revenue beat in all eight, and both operating margin and ROIC have now declined for two consecutive fiscal years; the market's unusually large and so-far-unreversed reaction reflects a real change in the margin trend, not just one disappointing print.
Sources
- FMP /stable/earnings (actuals vs consensus, eight quarters), /historical/earning_calendar/MELI (report timing), /historical-price-full/MELI (daily closes; moving averages, ranges and the day's move computed from them) — pulled November 18, 2026.
- FMP /income-statement, /cash-flow-statement, /balance-sheet-statement (quarterly) and the annual statements plus /key-metrics for FY2020–FY2025 — pulled November 18, 2026.
- FMP /analyst-estimates and /key-metrics-ttm — pulled November 18, 2026.
- Guidance, segment detail and management commentary: NOT STATED — the earnings-call transcript is not in the dataset for this edition.
Research for information only — not investment advice; see Disclosures.
On the data pages
- MELI company page — the filed figures, margins, cash flow and the print history, from SEC EDGAR.
- MELI vs DECK, head to head — the two on the same scorecard cells (top composite in Consumer Cyclical (kpi-scorecard-2026-11-17.json)).
- Verdict ledger — every public call, on the record.
- Earnings schedule — who reports next, and how every print this season graded.