ASML vs AMAT: Head-to-Head Snapshot — 2026-11-01
ASML beats Applied Materials on growth, quality and momentum in our KPI-scored head-to-head — Total 61.3 vs 43.5 — but with no fair value on file for either name, valuation, income and risk go unjudged and confidence is low.

Two companies supply the machines the AI build-out runs on. ASML Holding (NASDAQ: ASML) holds a monopoly on the EUV lithography systems every leading-edge chip requires. Applied Materials (NASDAQ: AMAT) is the broadest supplier of the deposition, etch and process-control equipment that fills the rest of the fab. Same demand wave, two very different scorecards — so we forced both through the same Altamira KPI gauntlet: all 31 KPIs, the six-lens check, and a verdict that can only be awarded from named KPIs.
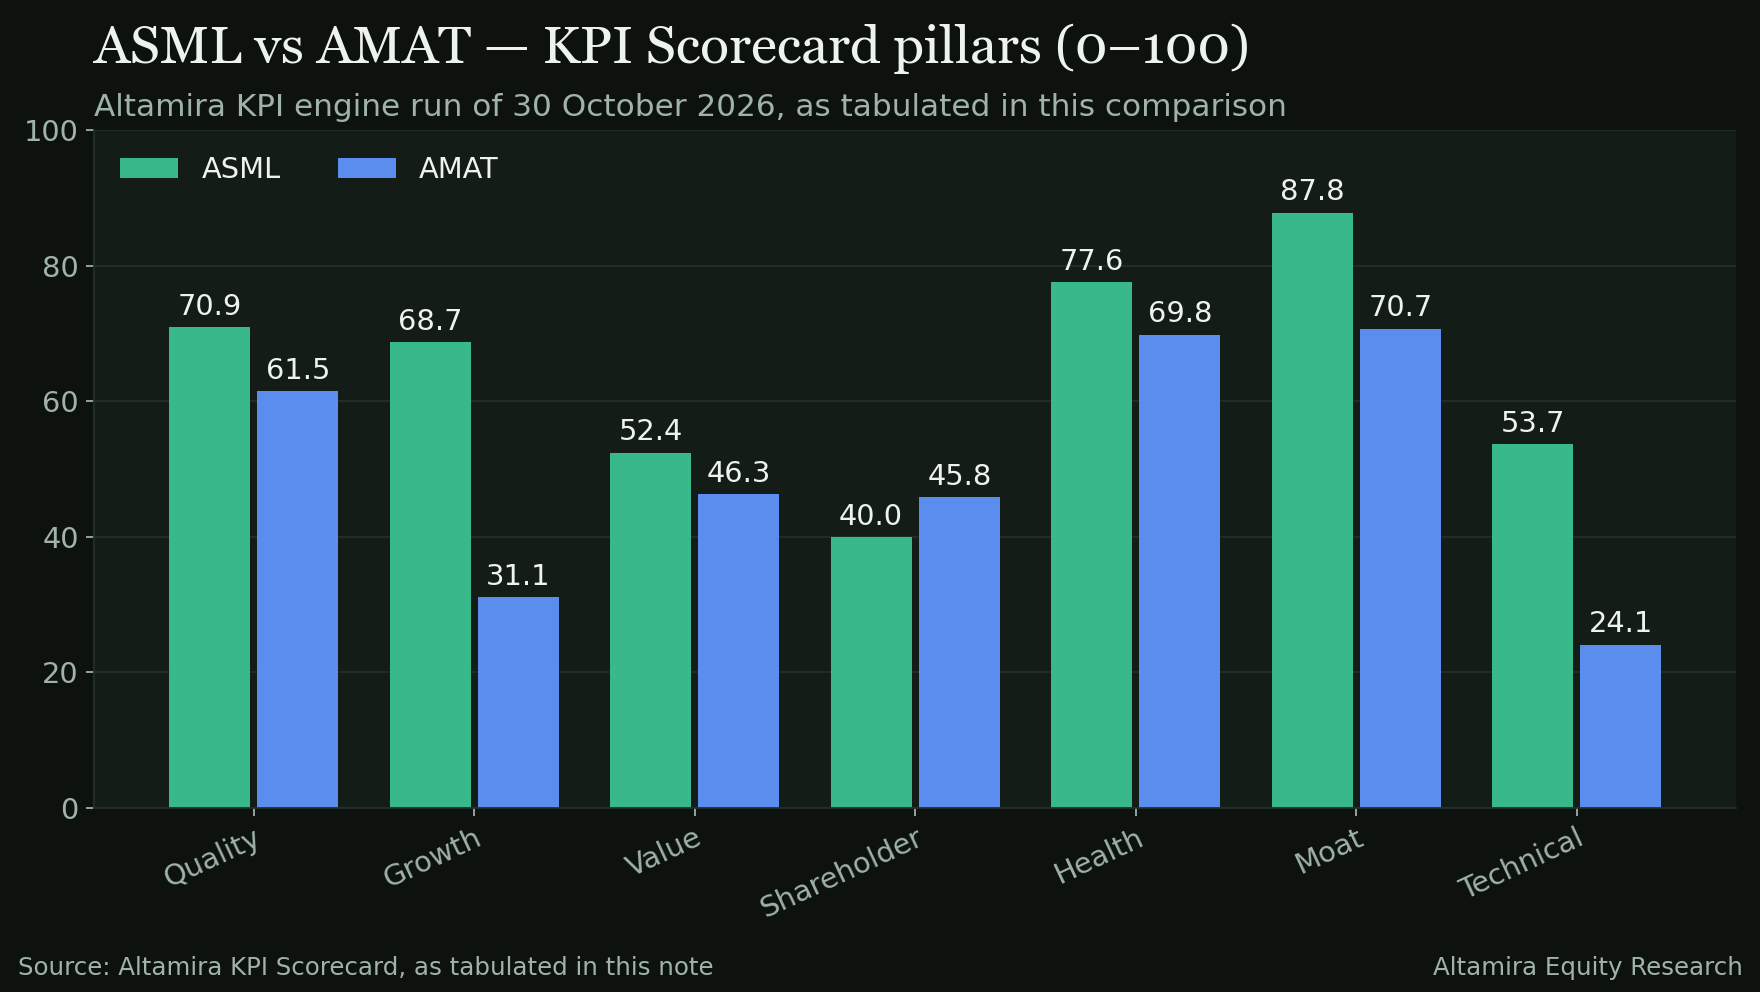
The verdict: ASML wins every category that could be judged — growth, quality and momentum — by wide margins (KPI Scorecard Total 61.3 vs 43.5). But three of the six verdict categories — valuation, income and capital return, and risk — are unjudged, because deciding KPIs are missing for both names, most importantly any fair-value estimate. With three categories unjudged, confidence in the verdict is capped at low. ASML is the better business on this evidence; whether it is the better buy at $1,565.90 is a question this data set cannot answer yet.
Data as of 1 November 2026. ASML reports in euros with a 31 December fiscal year end; AMAT reports in US dollars with a fiscal year ending in late October. Prices are the NASDAQ listings in USD. Absolute figures are shown in each company's reporting currency; growth, margin and return comparisons are currency-safe. KPI engine run: 30 October 2026.
Decision at a glance
| ASML Holding | Applied Materials | |
|---|---|---|
| Overall | Wins the head-to-head | Wins no judged category |
| Category score | 3 | 0 |
| Unjudged categories | 3 of 6 (valuation, income, risk) | 3 of 6 (valuation, income, risk) |
| Confidence | Low — three categories unjudged | Low — three categories unjudged |
| Price | $1,565.90 | $390.09 |
| Forward P/E | 38.1× | 20.8× |
| KPI Scorecard Total | 61.3 (Tier T3, grade B−) | 43.5 (Tier T4, grade D) |
Category verdicts
Each category is awarded from named KPIs only. Where a deciding KPI is missing, the category is marked unjudged rather than guessed.
| Category | Winner | Deciding evidence |
|---|---|---|
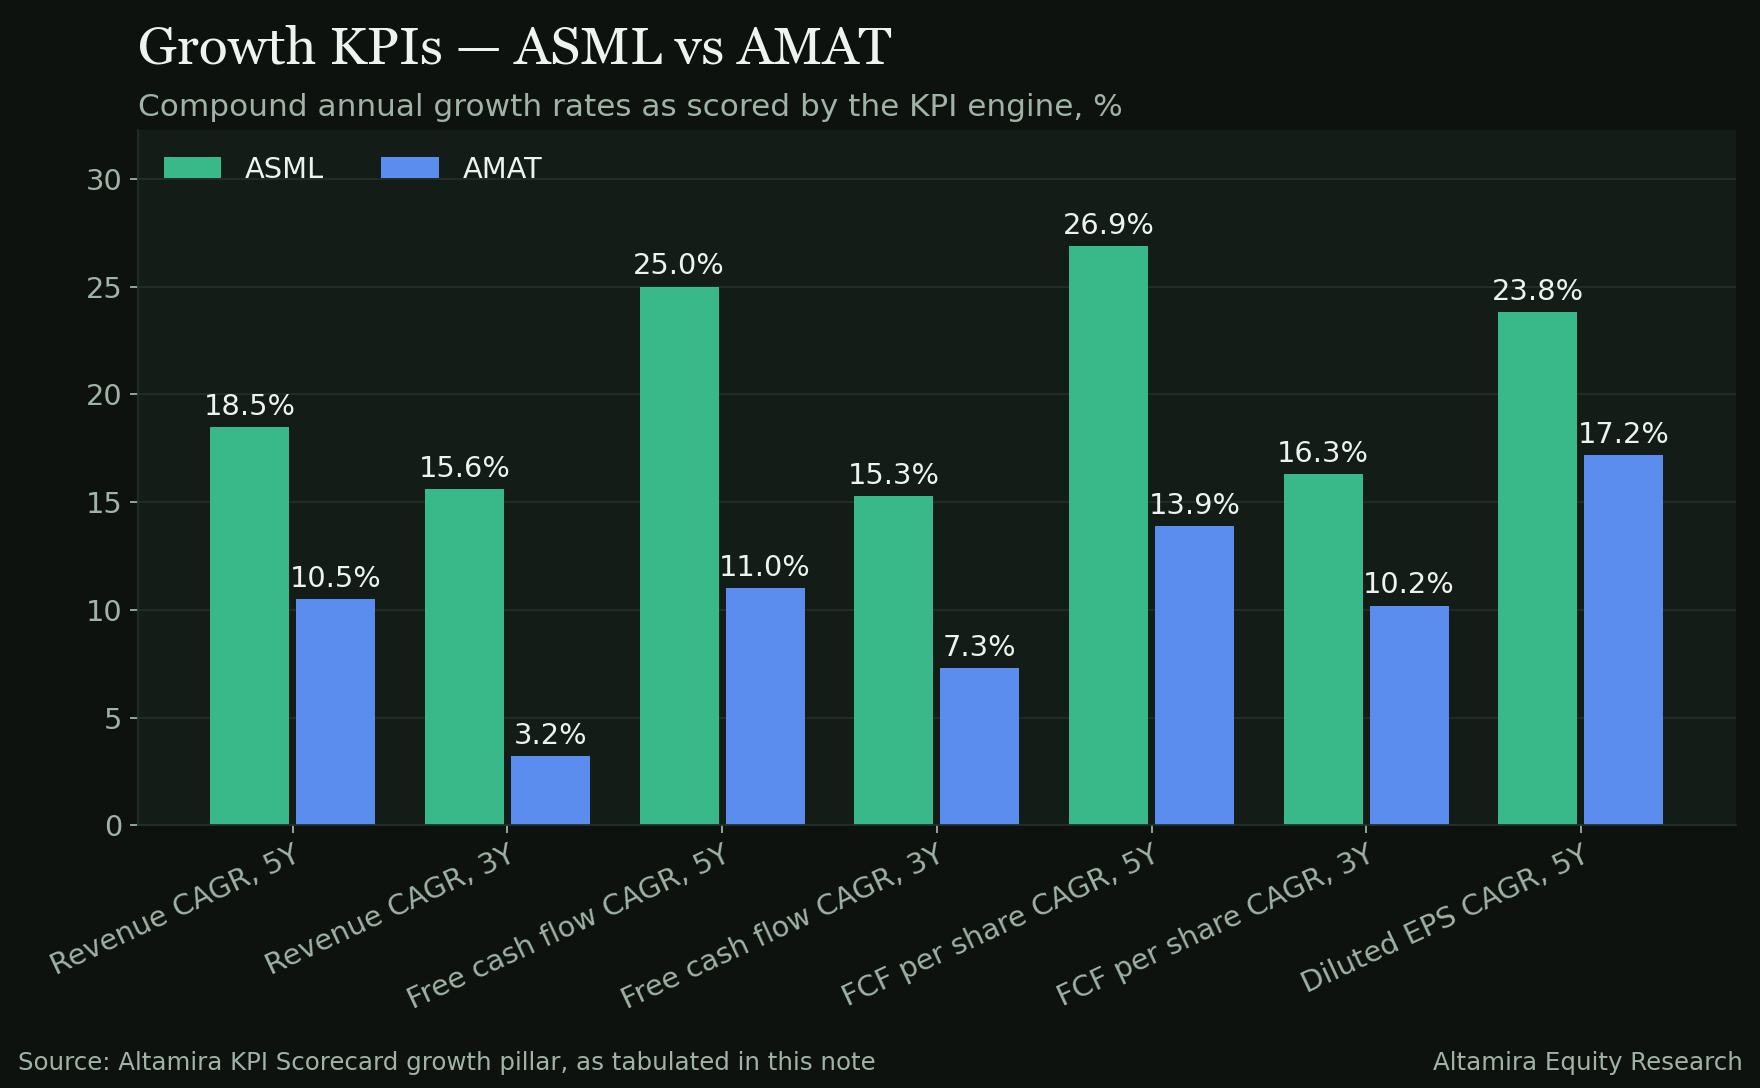
| Growth | ASML | Growth pillar 68.7 vs 31.1 · Revenue CAGR 5Y 18.5% vs 10.5% · EPS CAGR 5Y 23.9% vs 17.2% (both after the quality-of-earnings test below) |
| Quality | ASML | Quality pillar 70.9 vs 61.5 · Moat pillar 87.8 vs 70.7 · ROIC 5Y 30.4% vs 28.3% · Cash conversion (OCF / net income) 130.3% vs 108.2% |
| Valuation | Unjudged | Margin of safety is a deciding KPI and is missing for both — no fair value is on file for either name. Value pillar (52.4 vs 46.3) and P/E NTM are shown in the tables but cannot carry the category alone |
| Income & capital return | Unjudged | Buyback yield and dividend-per-share growth (5Y and 3Y) are missing for both companies, so the category cannot be awarded |
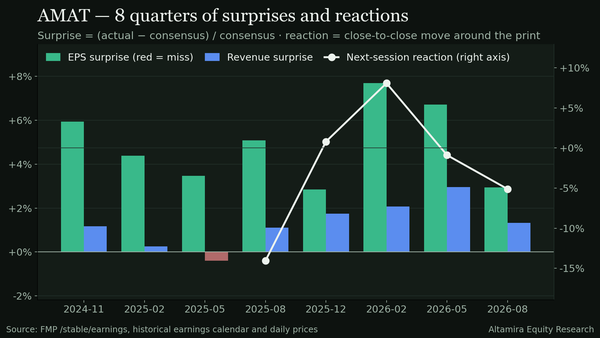
| Momentum | ASML | Technical pillar 53.7 vs 24.1 · Timing gate: ASML passes, AMAT fails · AMAT sits 43.1% below its 52-week high with a 3-month return of −19.0% |
| Risk | Unjudged | Interest cover — a balance-sheet deciding KPI — is missing for ASML. The Health pillar favours ASML (77.6 vs 69.8), but the category is not awarded on partial evidence |
Category score: ASML 3 — 0 AMAT, with three categories unjudged. Under the framework, two or more unjudged categories cap verdict confidence at low.
Snapshot
| Metric | ASML | AMAT |
|---|---|---|
| Price (NASDAQ) | $1,565.90 | $390.09 |
| Market cap | $603.5B | $309.6B |
| Reporting currency / fiscal year end | EUR / 31 Dec 2025 | USD / 26 Oct 2025 |
| Latest FY revenue | €32.7B | $28.4B |
| Latest FY net income | €9.6B | $7.0B |
| Gross margin (latest FY) | 52.8% | 48.7% |
| Operating margin (latest FY) | 34.6% | 29.2% |
| P/E (TTM) | 40.3× | 33.4× |
| EV / EBITDA (TTM) | 32.8× | 26.9× |
| Price / sales (TTM) | 13.8× | 10.0× |
| FCF yield (TTM) | 3.9% | 1.8% |
| Forward P/E (consensus EPS) | 38.1× | 20.8× |
| Dividend per share, trailing 12M paid | $9.31 | $2.51 |
| Trailing yield | 0.59% | 0.64% |
| Net debt / EBITDA (TTM) | -0.37× (net cash) | 0.03× |
| Current ratio | 1.49 | 2.42 |
| Beta | 1.30 | 1.59 |
| 52-week range | $946.11 – $1999.96 | $203.4 – $739.67 |
| Return, year to date | +46.4% | +51.8% |
| Return, 1 year | +46.8% | +64.1% |
The six-lens gauntlet
Both companies are run through the same six lenses, in the same order, before any verdict is awarded.
| Lens | ASML | AMAT | Judgment |
|---|---|---|---|
| Revenue growth | 5Y CAGR 18.5% · 2Y CAGR 8.9% | 5Y CAGR 10.5% · 2Y CAGR 3.4% | ASML — grows faster on both windows; both are decelerating, AMAT harder |
| Operating margin | 34.6% latest FY, up from 29.0% five years ago | 29.2% latest FY, up from 25.4% five years ago | ASML — higher level, similar expansion |
| EPS | 5Y CAGR 23.9% · share count -7.2% over 5Y | 5Y CAGR 17.2% · share count -12.5% over 5Y | ASML — faster per-share growth with less of it bought back (see quality-of-earnings test) |
| Cash | FCF €11.0B latest FY · FCF CAGR 5Y 24.9% · OCF / net income 130.3% | FCF $5.7B latest FY · FCF CAGR 5Y 11.0% · OCF / net income 108.2% | ASML — more cash, compounding faster, better conversion |
| ROIC | ROIC 5Y 30.4% · ROCE 5Y 36.9% | ROIC 5Y 28.3% · ROCE 5Y 33.6% | ASML — narrow edge; both earn far above any plausible cost of capital |
| Balance sheet | Debt / equity 0.22× · net cash · current ratio 1.49 | Debt / equity 0.35× · net debt / EBITDA 0.03× · current ratio 2.42 | Tie — ASML carries less leverage; AMAT holds the deeper liquidity cushion |
Quality-of-earnings test. EPS growth only counts in full when it survives the share-count test. Both companies fail it in the same way: ASML's diluted share count fell 7.2% over five years while EPS compounded at 23.9%, and AMAT's fell 12.5% while EPS compounded at 17.2%. Both are labelled buyback-driven (provisional) — not a disqualification, but the EPS growth of both is weighted down in the verdict, AMAT's more than ASML's because more of its per-share growth was purchased rather than earned.
KPI Scorecard
The scorecard scores each company on 31 KPIs grouped into seven pillars. Fundamental is weighted Quality 25%, Growth 20%, Value 20%, Shareholder 15%, Health 10%, Moat 10%; the Total adds the Technical pillar at 30% against Fundamental's 70%. Scores are computed inside the Altamira KPI engine's scored universe — they rank these companies against that universe, not against a broad index.
| Score | ASML | AMAT |
|---|---|---|
| Total | 61.3 | 43.5 |
| Fundamental | 64.5 | 51.8 |
| Tier / grade | TT3 / B- | TT4 / D |
| KPIs with values | 26 of 31 | 27 of 31 |
Pillar scores (0–100)
| Pillar | ASML | AMAT |
|---|---|---|
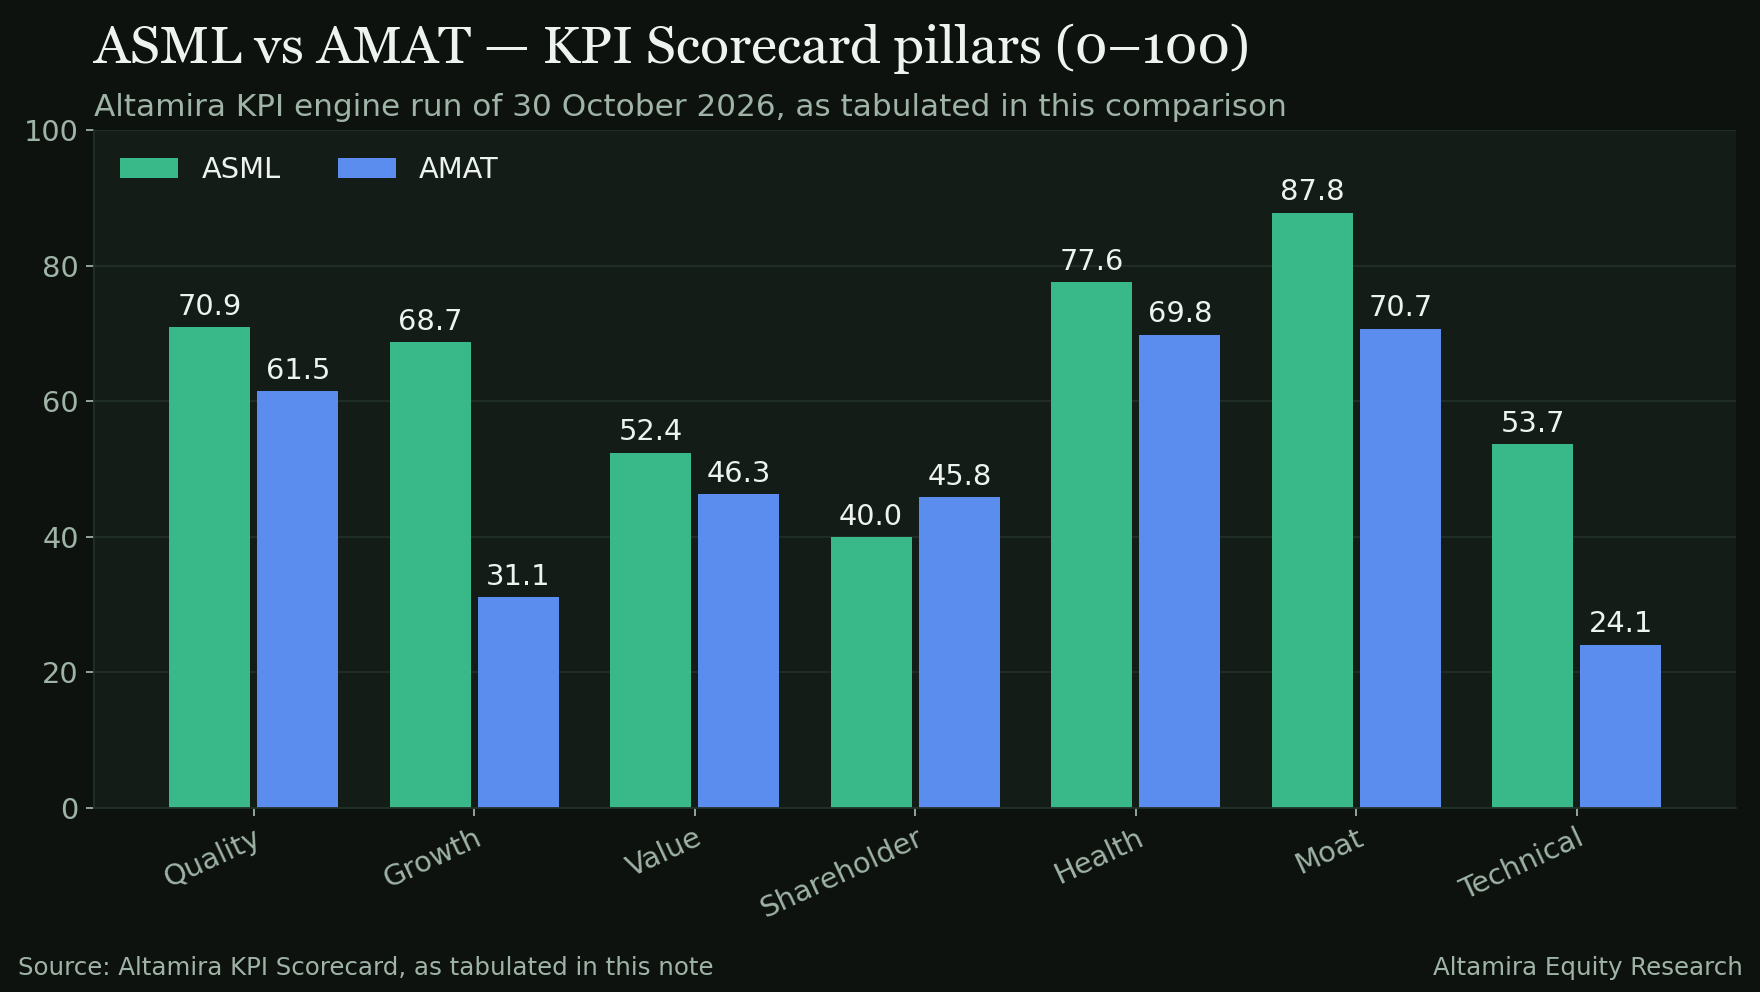
| Quality | 70.9 | 61.5 |
| Growth | 68.7 | 31.1 |
| Value | 52.4 | 46.3 |
| Shareholder | 40.0 | 45.8 |
| Health | 77.6 | 69.8 |
| Moat | 87.8 | 70.7 |
| Technical | 53.7 | 24.1 |
Gates
| Gate | ASML | AMAT |
|---|---|---|
| Quality gate (Fundamental ≥ 70 and Health ≥ 50) | Fail — Fundamental 64.5 | Fail — Fundamental 51.8 |
| Price gate (Value ≥ 50 and P/E NTM not red) | Fail — P/E NTM 30.6× is in the red zone | Fail — Value pillar 46.3 |
| Timing gate (trend state and RSI ≤ 70) | Pass | Fail |
| QC gate (engine) | Fail | Fail |
Weakest links. ASML's weakest fundamental KPI is its dividend yield — 0.5%, scoring 30.0 of 100: an income investor is paid almost nothing to wait. AMAT's weakest is its 3-year revenue CAGR — 3.2%, scoring 12.5 of 100 and flagged red: the recent growth engine, not the long one, is what has stalled.
All 31 KPIs
Raw value first, engine score (of 100) beneath it. The stronger score in each row is bolded. A dash means the KPI could not be computed from the available data — those gaps drive the unjudged categories above.
Quality
| KPI | ASML | AMAT |
|---|---|---|
| ROIC, 5Y average | 30.4% score 88 | 28.3% score 83 |
| ROCE, 5Y average | 36.9% score 88 | 33.6% score 83 |
| Gross margin | 52.8% score 46 | 48.7% score 34 |
| Net margin | 29.4% score 61 | 24.7% score 54 |
| Operating cash flow / net income, 5Y | 133.1% score 44 | 108.2% score 18 |
Growth
| KPI | ASML | AMAT |
|---|---|---|
| Revenue CAGR, 5Y | 18.5% score 62 | 10.5% score 23 |
| Revenue CAGR, 3Y | 15.6% score 65 | 3.2% score 12 |
| Free cash flow CAGR, 5Y | 25.0% score 78 | 11.0% score 27 |
| Free cash flow CAGR, 3Y | 15.3% score 61 | 7.3% score 36 |
| FCF per share CAGR, 5Y | 26.9% score 78 | 13.9% score 40 |
| FCF per share CAGR, 3Y | 16.3% score 61 | 10.2% score 47 |
| Diluted EPS CAGR, 5Y | 23.8% score 70 | 17.2% score 42 |
Value
| KPI | ASML | AMAT |
|---|---|---|
| FCF yield, LTM | 3.9% score 71 | 1.9% score 32 |
| P/E, next twelve months | 30.6× score 34 | 21.8× score 61 |
| Margin of safety to fair value | — | — |
Shareholder returns
| KPI | ASML | AMAT |
|---|---|---|
| Dividend yield | 0.5% score 30 | 0.5% score 33 |
| Payout ratio | 22.1% score 57 | 17.0% score 67 |
| Dividend per share growth, 5Y | — | — |
| Dividend per share growth, 3Y | — | — |
| Buyback yield | — | — |
Health
| KPI | ASML | AMAT |
|---|---|---|
| Debt / equity | 0.22× score 71 | 0.35× score 56 |
| Net debt / EBITDA | 0.0× score 85 | 0.0× score 85 |
| Interest cover | — | 30.8× score 70 |
Moat
| KPI | ASML | AMAT |
|---|---|---|
| Moat heuristic (0–100) | 94.3 score 88 | 89.9 score 71 |
Technical
| KPI | ASML | AMAT |
|---|---|---|
| Trend template (Minervini criteria met) | 66.7% score 66 | 33.3% score 22 |
| Relative strength rank, 6M | 65 score 65 | 45 score 45 |
| Return, 3M | +1.5% score 38 | -19.0% score 2 |
| RSI, 14-day | 46.3 score 32 | 40.5 score 15 |
| MACD histogram, % of price | -0.24% score 40 | -0.82% score 18 |
| Price vs 200-day average | +3.6% score 45 | -7.4% score 22 |
| Distance from 52-week high | -16.9% score 42 | -43.1% score 8 |
What the Street expects
| Next fiscal year consensus | ASML (FY to Dec 2026) | AMAT (FY to Oct 2027) |
|---|---|---|
| Consensus EPS | 41.09 (range 36.46 – 43.43) | $18.77 (range $17.22 – $20.12) |
| Analysts contributing | 20 | 24 |
| Implied forward P/E | 38.1× | 20.8× |
The growth expectations are already in the prices: ASML trades at 38.1× consensus next-year earnings against AMAT's 20.8×. Consensus price targets could not be pulled for either name in this run, so no target-based upside is shown — another reason the valuation category stays unjudged rather than estimated.
Risks and invalidation
What would change the ASML verdict. The judged-category sweep rests on growth and moat durability while valuation evidence is entirely absent: the P/E on next-twelve-month earnings (30.6×) already sits in the engine's red zone and the price gate fails. If ASML's 3-year revenue CAGR (15.6%) rolls over toward AMAT's level, or the quality and moat pillars crack, the sweep does not survive contact with the next engine run. And if a fair value lands far below the price, the unjudged valuation category could be awarded against ASML retroactively.
What would change the AMAT verdict. AMAT's loss is a growth-and-momentum loss, not a quality loss — its ROIC (28.3%) and balance sheet are genuinely strong. It trades 43.1% below its 52-week high with every technical KPI flagged red; if 3-year revenue growth re-accelerates from 3.2% and the trend repairs, growth and momentum are the first categories to flip. Its 20.8× forward P/E already prices in much of the slowdown — but with no fair value on file, that earns it an unjudged valuation category, not a win.
Shared risks. Both companies' EPS growth is buyback-assisted (quality-of-earnings test, above), so per-share growth overstates operational growth for both. The comparison also crosses two reporting regimes — euros versus dollars, December versus October fiscal year ends — so absolute figures are indicative, and the verdict leans on the ratios, growth rates and scores that are currency-safe.
Gaps in this comparison
- No fair value on file for either company (the fair value of record is an external estimate; FMP DCF is never used). Margin of safety is therefore missing for both, and the valuation category is unjudged.
- Buyback yield and dividend-per-share growth (5Y and 3Y) are missing for both companies — the income & capital return category is unjudged.
- Interest cover is missing for ASML — the risk category is unjudged.
- Consensus price targets were unavailable in the data pull for both names.
- Sources: FMP company data pulled for the 1 November 2026 comparison; Altamira KPI engine run of 30 October 2026 (ASML scored on 26 of 31 KPIs, AMAT on 27 of 31).
Research for information only — not investment advice; see Disclosures.