Broadcom: The Growth Record Printed Real — the Fair-Value Models Can't Agree on the Price
Broadcom grew revenue 85.50% year over year to $29.59B in its latest quarter and expanded operating margin 1,736 basis points to 54.27%. The stock trades 43.94% below the one published fair value that has followed it longest (Morningstar, $650.00) and 48.26% above another (Altamira's in-house DCF, $

Revenue +85.50% YoY to $29.59B · operating margin +1,736 bp to 54.27% · ROIC 24.03% (TTM) · close 364.36, 43.94% below the Morningstar fair value of 650.00 and 48.26% above the Altamira in-house DCF of 245.75
The story in 30 seconds
- Broadcom's latest filed quarter is one of the fastest-growing prints in the KPI Scorecard universe: revenue of $29.59B grew 85.50% year over year, operating margin expanded 1,736 basis points to 54.27%, and free cash flow of $13.66B ran at 104.41% of net income.
- The price says something more divided. At the November 12 close of 364.36, the stock sits 43.94% below the one published fair value that has tracked it longest (Morningstar, $650.00) — but 48.26% above Altamira's own in-house DCF ($245.75) and 107.53% above FMP's DCF ($175.57). The three models the scorecard carries for Broadcom span from $175.57 to $650.00.
- The open question is whether the technical score of 20.0 — the weakest cell on an otherwise mid-to-strong fundamental profile — is pricing the two DCF models' caution, or has simply fallen behind a growth and margin record that just printed its strongest quarter yet.
Broadcom's fundamental composite on the Altamira KPI Scorecard is 68.4, built from a value pillar of 73.8, a growth pillar of 72.1 and a quality pillar of 70.6 — a solid, if not top-tier, profile. The same edition scores the stock's technical state at 20.0 and labels it DRIFTING, tier 4, grade C, a blended total of 53.9. A reader looking only at the quarter just filed — 85.50% revenue growth, 1,736 basis points of margin expansion, cash conversion above net income — would call this one of the stronger growth prints on the sheet; a reader looking only at the scorecard's blended grade would call it a C. Both readings use real numbers, and the gap between them is largely the fair-value disagreement below.
Broadcom sells semiconductor solutions — custom silicon, networking chips and connectivity components — and enterprise infrastructure software, organized into Wired Infrastructure, Wireless Communications, Enterprise Storage and Industrial & Other segments. A 8-K filed July 6, 2026 disclosed that Broadcom and Apple had agreed to expand their technology collaboration through 2031, covering custom ASIC silicon products across multiple generations of Apple products — one data point behind the growth and margin trajectory the five-year record below shows building for several years.
In this post: (1) how the business made money in the latest filed quarter; (2) the five-year record across four lenses; (3) what the cash and share-count lines say about the quality of the earnings; (4) what the price already assumes against three published fair-value models; (5) the scorecard's own read, pillar by pillar; (6) the honest counterweight and the Key Issue ahead of the December 9 print.
How Broadcom makes money
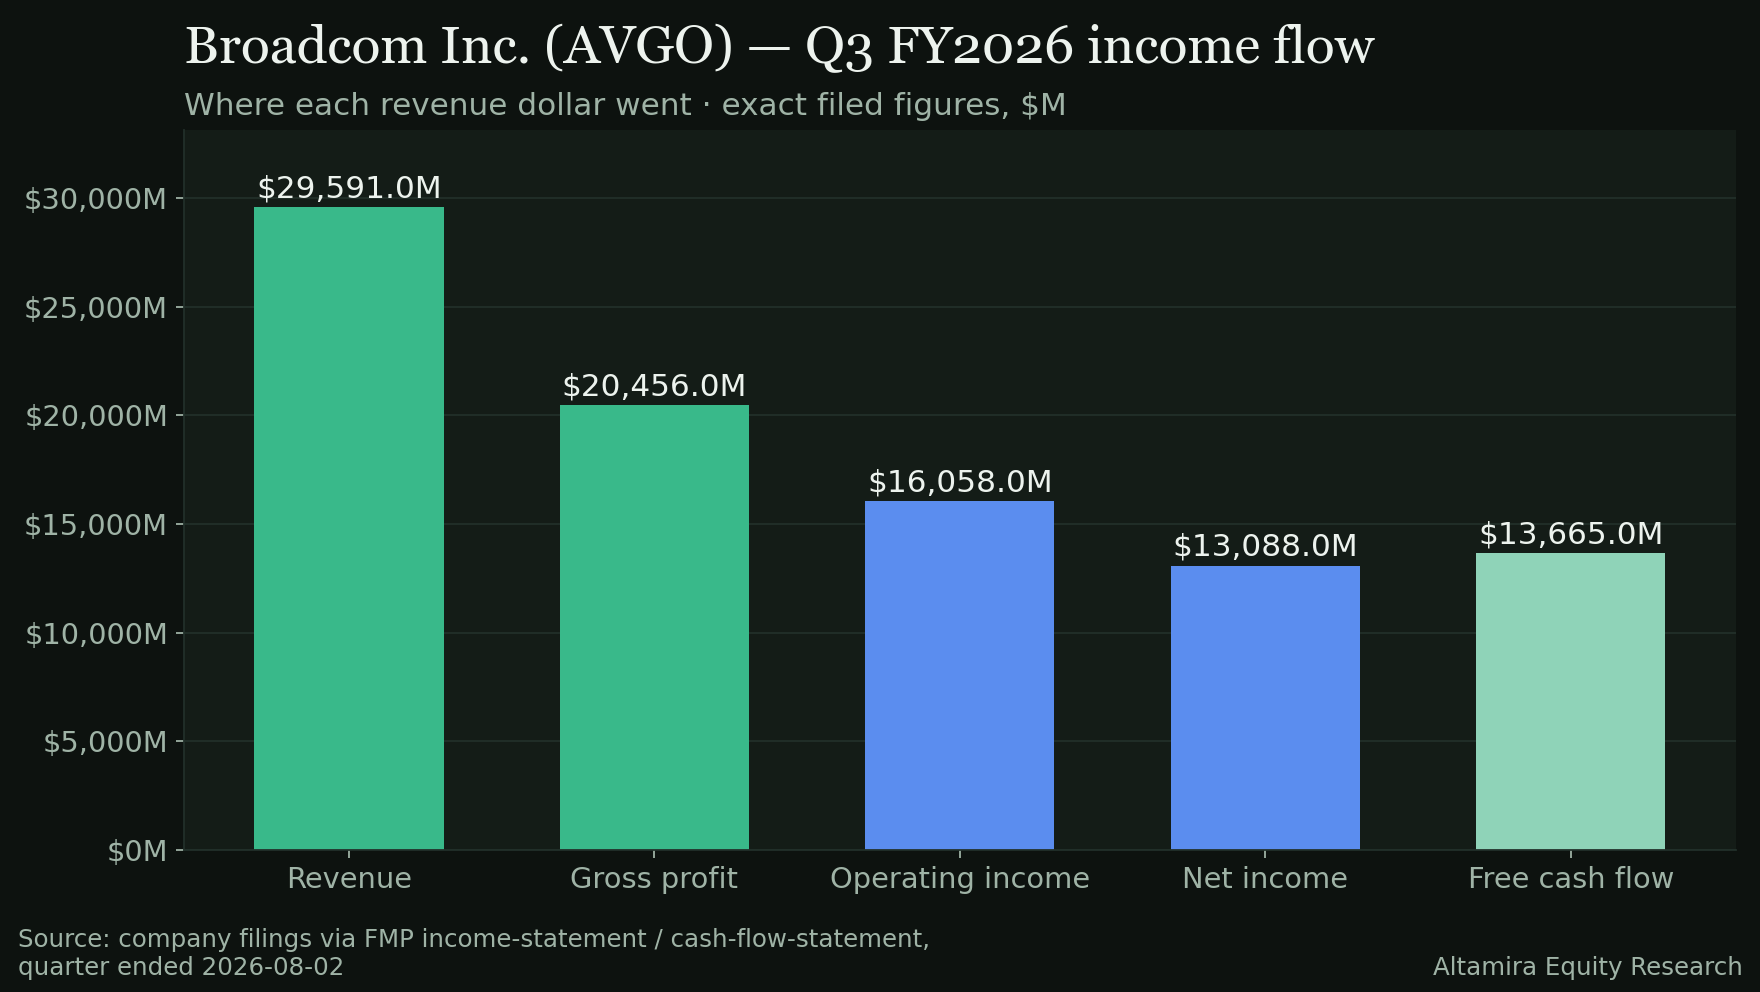
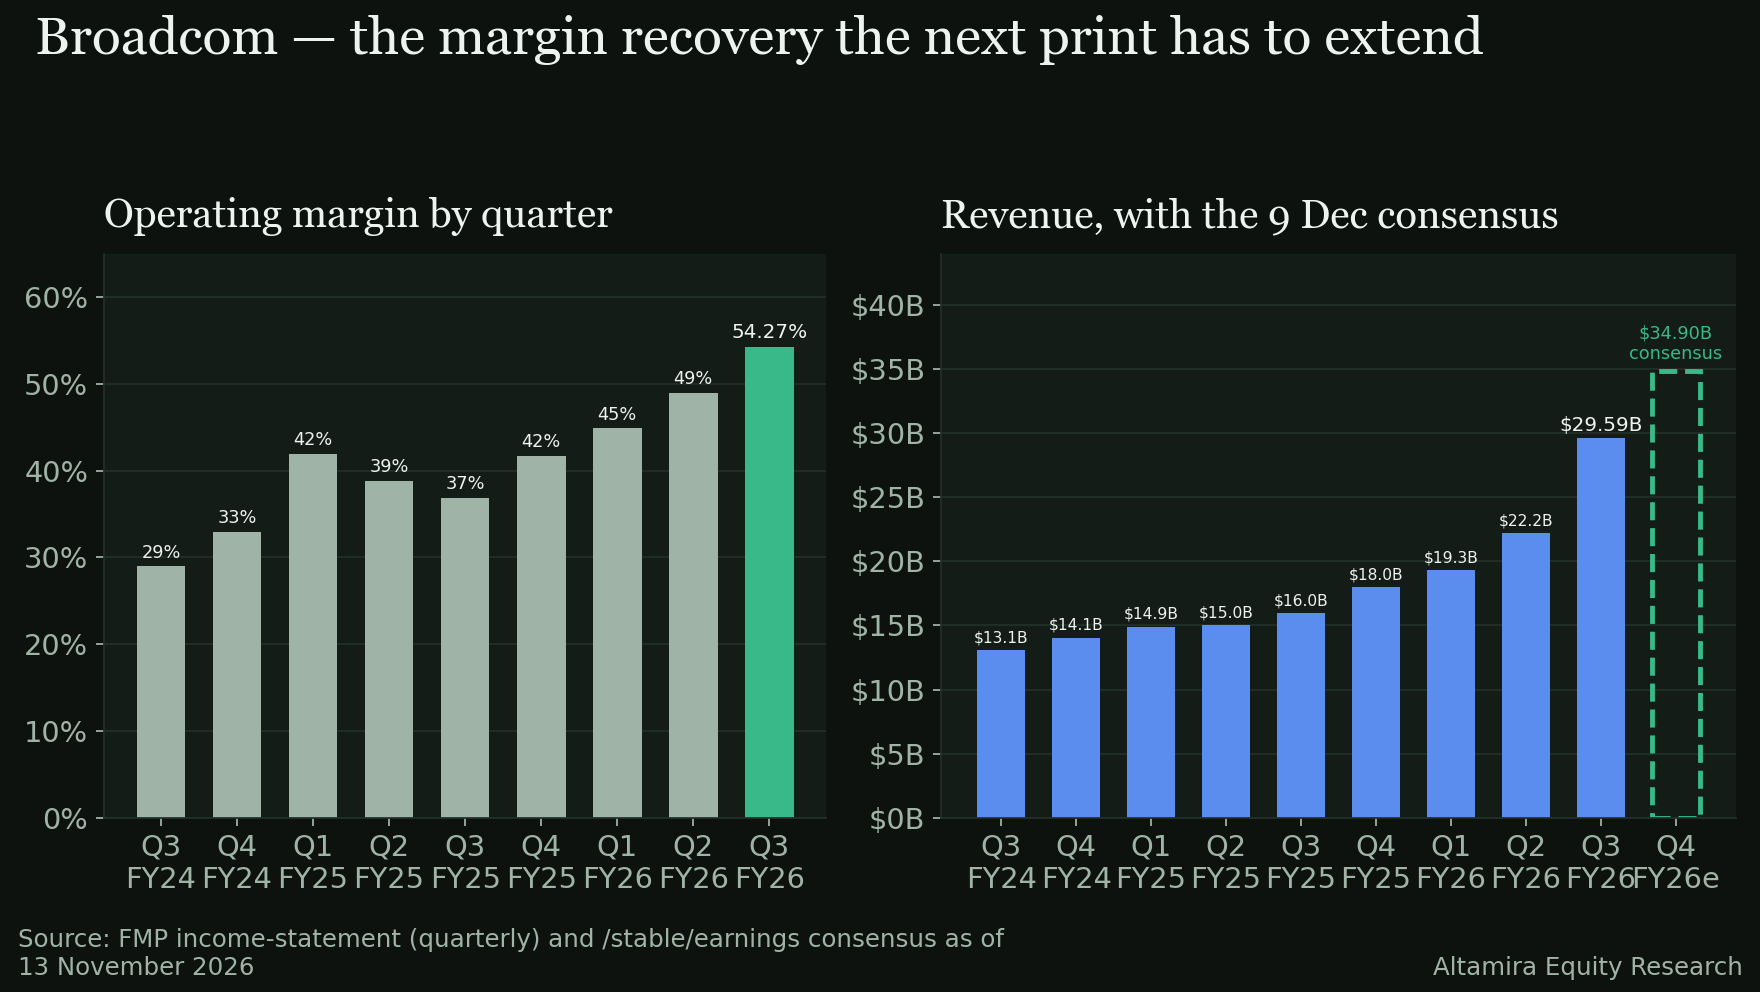
In the latest filed quarter, Q3 FY2026 (period ended August 2, 2026): revenue of $29.59B, up 85.50% year over year and 33.37% sequentially. Cost of revenue was $9,135.0M (30.87% of revenue), leaving a gross profit of $20.46B (69.13%). Operating expenses were $4,398.0M (14.86%) — R&D of $2,895.0M (9.78%), SG&A of $996.0M (3.37%) and other expenses of $507.0M (1.71%) — producing operating income of $16.06B, a 54.27% operating margin, up 172.77% year over year. Interest expense was $778.0M (2.63%); pre-tax income was $15.28B (51.62%); income tax of $2,187.0M (7.39%) left net income of $13.09B, a 44.23% net margin, up 216.14% year over year. Free cash flow was $13.66B, 46.18% of revenue.
The swing line is operating margin itself: up 532 basis points sequentially and 1,736 basis points year over year, even as free-cash-flow margin held almost flat quarter over quarter (−7 bp) — the quarter's growth did not come at the expense of cash conversion.
The long view — FY2020 to FY2025
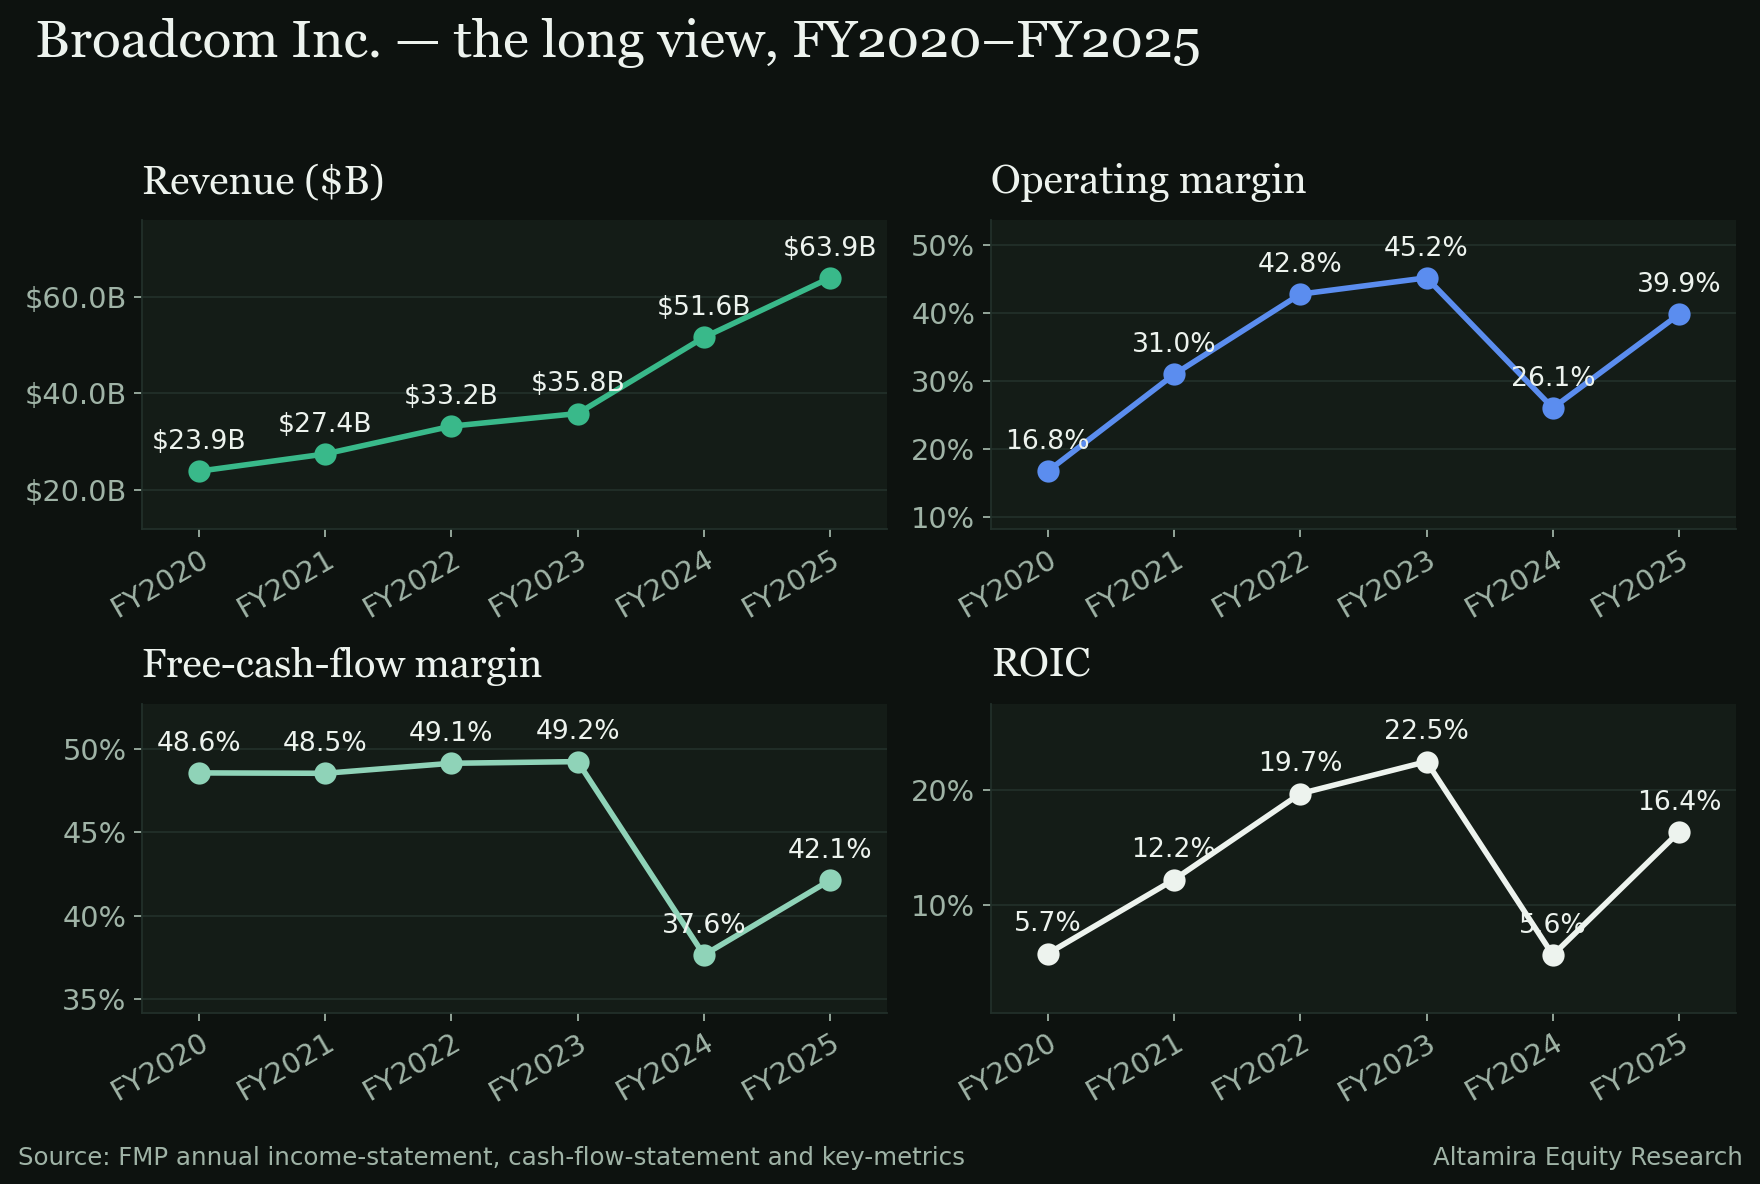
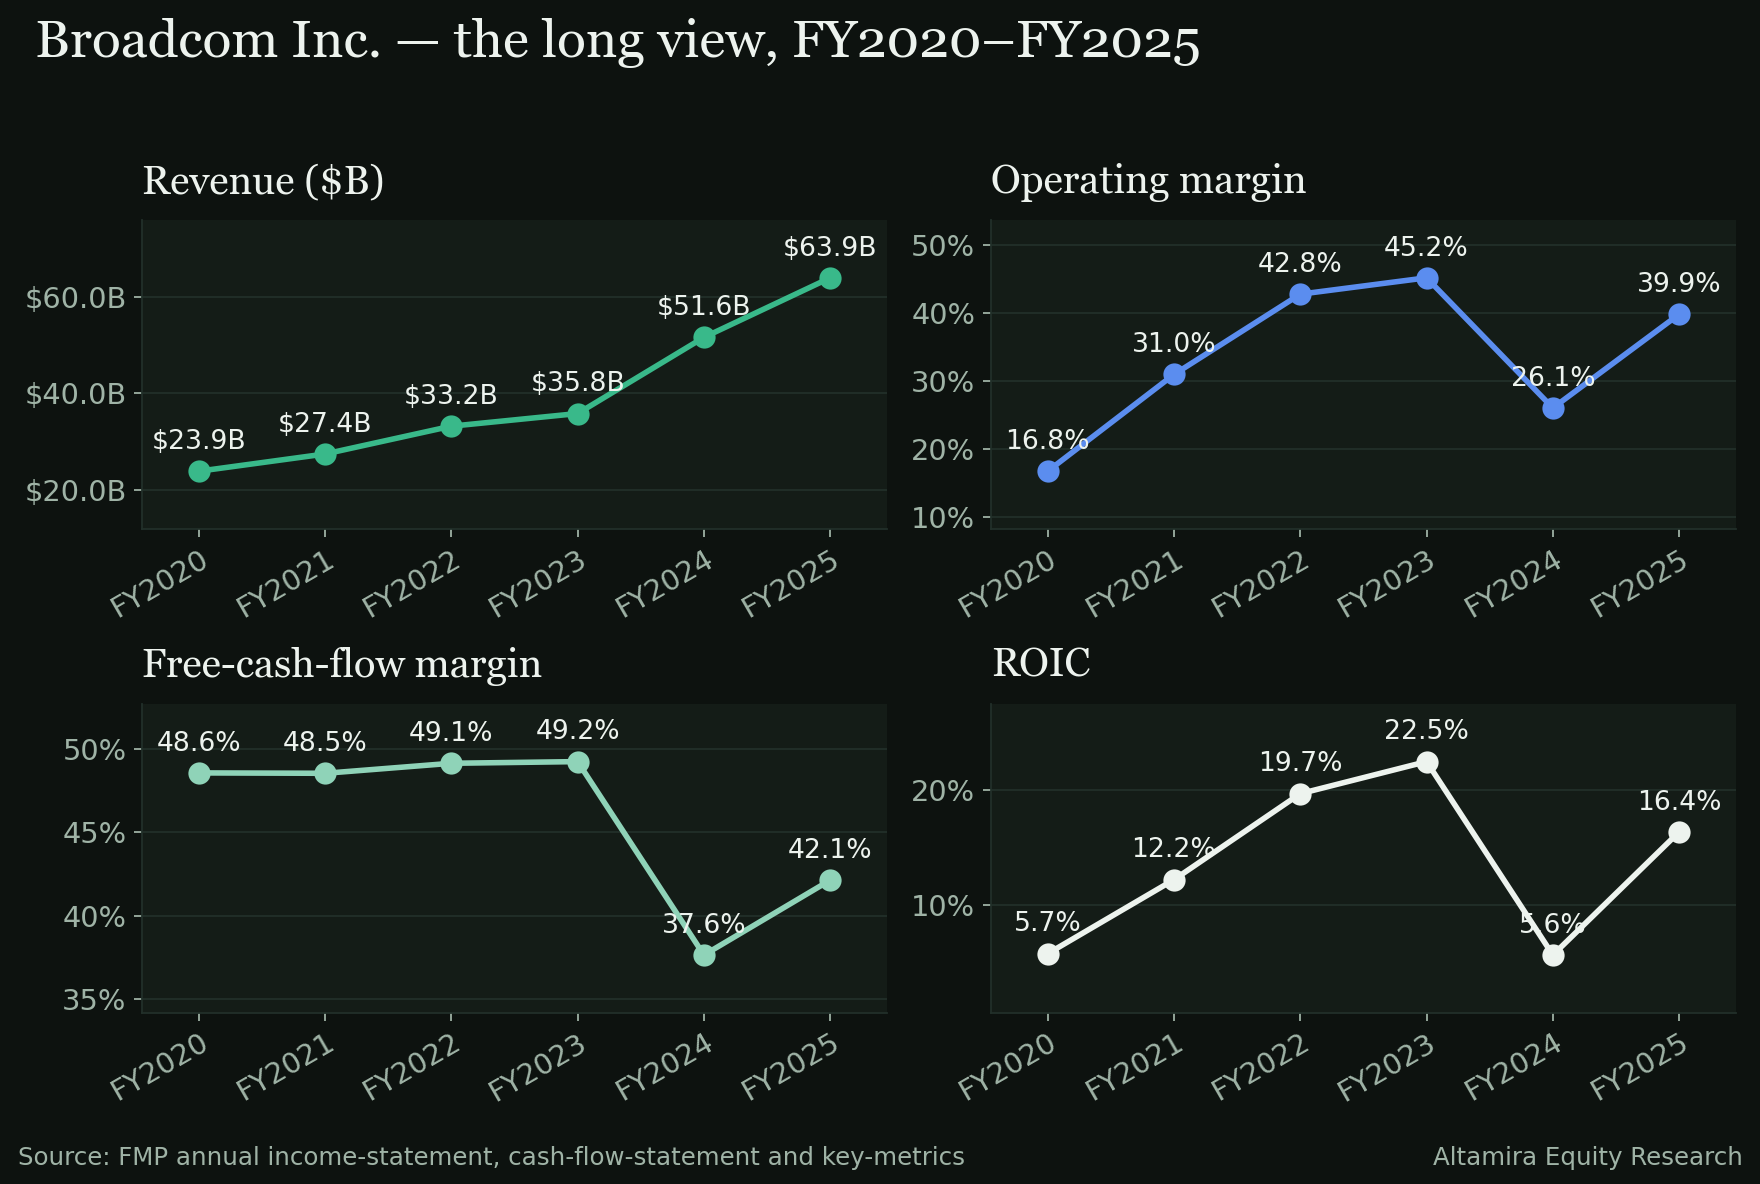
- Revenue growth. $23.89B in FY2020 to $63.89B in FY2025, a 21.74% compound rate. The path was not linear — FY2024 revenue of $51.57B was a large step up from FY2023's $35.82B — and the most recent quarter's 85.50% year-over-year growth runs well above the five-year average pace.
- Operating margin. 16.80% in FY2020 to a FY2023 peak of 45.25%, then a trough of 26.10% in FY2024, before recovering to 39.89% in FY2025 — a net expansion of 2,309 basis points across the five years, with the FY2024 dip and recovery the most volatile stretch in the record. The latest quarter's 54.27% sits above every one of those five annual figures.
- Cash. Free-cash-flow margin ran near 49% in FY2021 through FY2023, fell to 37.64% in FY2024 — the same year operating margin troughed — and recovered to 42.13% in FY2025; free cash flow compounded at 18.34% a year, below the 21.74% revenue rate.
- Returns on capital. ROIC fell from 19.71% in FY2022 to a trough of 5.57% in FY2024, then recovered to 16.36% in FY2025 — the sharpest round-trip of the four lenses, now at 24.03% on a trailing-twelve-month basis, above every one of the five annual figures shown here.
Quality of earnings
Free cash flow of $13.66B in the latest quarter was 104.41% of net income — cash generation outran the accounting earnings line, with operating cash flow of $14.20B funding just $532.0M of capital expenditure. Diluted share count was 4,887,000,000, up 0.56% year over year and 0.23% sequentially — modestly rising rather than falling, against dividends paid of $3,103.0M and no buybacks in the quarter ($0.0M).
The balance sheet carries a structural feature worth naming plainly: goodwill and intangibles of $124.13B exceed the company's entire $99.69B of shareholders' equity, a legacy of Broadcom's acquisition history (VMware prominent among them), alongside cash and short-term investments of $23.98B against total debt of $59.42B and net debt of $35.44B. None of this is a red flag on its own — the trailing net debt/EBITDA of 0.68 is modest — but a balance sheet where intangible assets outweigh equity is not a pure-asset story.
Valuation — what the price already says
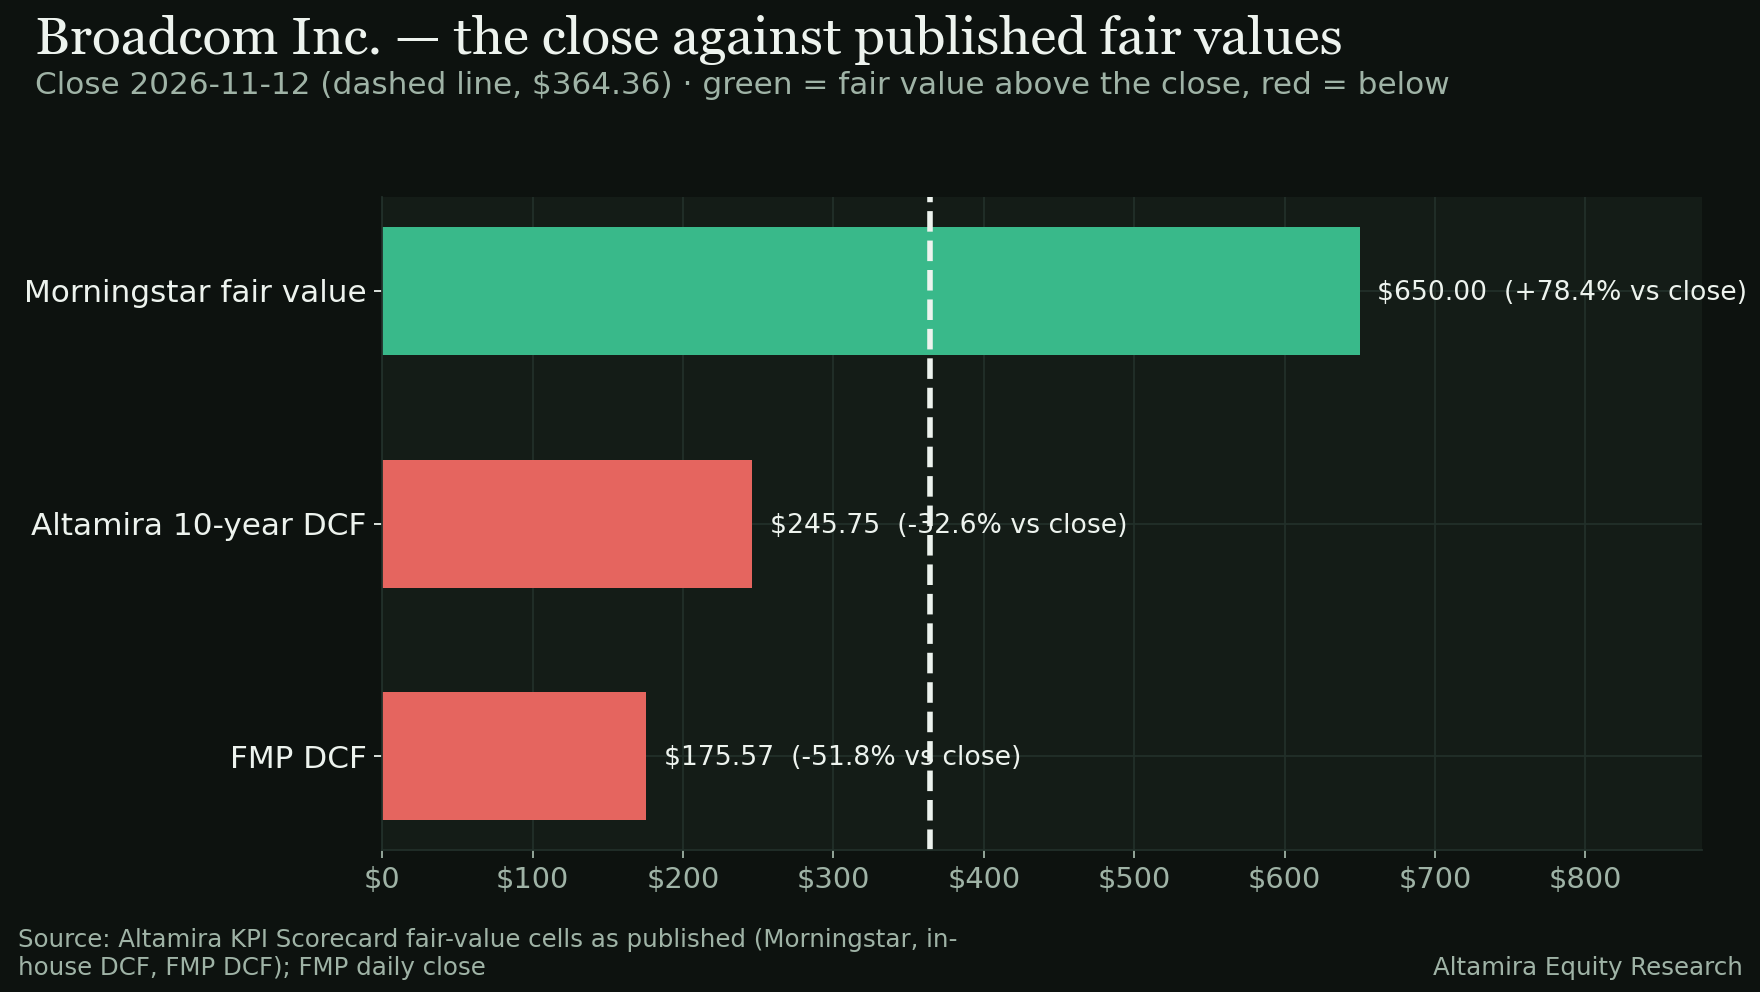
At the November 12, 2026 close of 364.36, the three fair-value figures the KPI Scorecard carries for Broadcom disagree about which side of fair the stock sits on:
| Source | Fair value | As of | Price vs fair value | Fair value vs price |
|---|---|---|---|---|
| FMP DCF | 175.57 | 2026-11-07 | +107.53% | −51.81% |
| Altamira 10-year DCF | 245.75 | n/a | +48.26% | −32.55% |
| Morningstar fair value | 650.00 | 2026-06-04 | −43.94% | +78.39% |
The published range runs from 175.57 to 650.00. Two of the three models — both DCF-based — put the current price above their own fair-value estimate; the third, Morningstar's, puts the price 43.94% below it, for a margin of safety of 46.89% on that single model. Fair value is stated as published in the dataset; analyst price targets are excluded from this comparison (R7). On a trailing basis the stock trades at a P/E of 45.21 with a free-cash-flow yield of 2.27% and ROIC of 24.03%.
The scorecard read
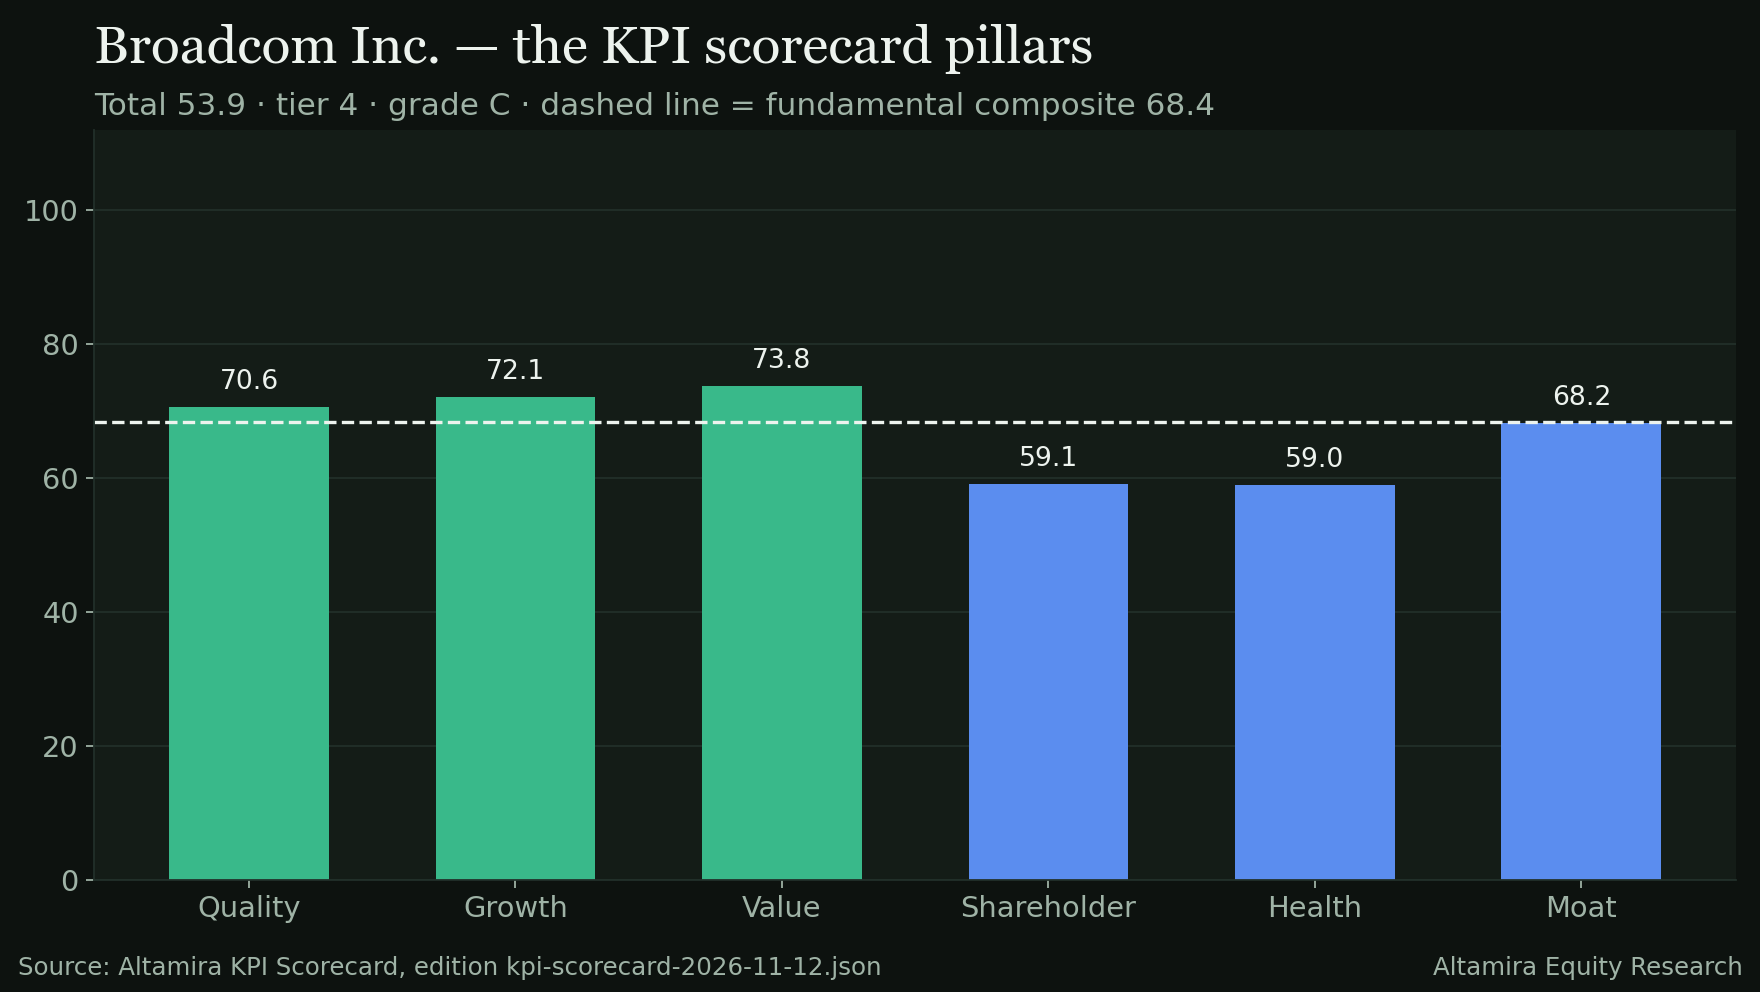
The November 12, 2026 edition of the Altamira KPI Scorecard has Broadcom at a fundamental composite of 68.4 — value 73.8 and growth 72.1 the strongest pillars, quality 70.6 and moat 68.2 a step behind, shareholder 59.1 and health 59.0 the weakest two. The technical score is 20.0, producing a blended total of 53.9, tier 4, grade C, state DRIFTING, rank 239 with a one-day delta of +1.5. The technical score sits well below all six fundamental pillars; that gap is the single largest reason the blended total sits far below the fundamental composite.
The honest counterweight
Three cells argue against reading this quarter's growth and margin print as settling the valuation question.
- Two of three published fair-value models say the stock is already expensive. FMP's own DCF (175.57) and Altamira's in-house DCF (245.75) both sit below the 364.36 close; only Morningstar's figure (650.00), last updated June 4, 2026, argues the stock is cheap. A reader who trusts the DCF models over Morningstar's would reach the opposite conclusion from the deck line above.
- Goodwill and intangibles exceed shareholders' equity. $124.13B against $99.69B of equity is not unusual for a serial acquirer, but it means more than the entire equity base is intangible, a cell worth tracking if growth ever slows enough to pressure an impairment test.
- The technical state is DRIFTING, not merely weak. A score of 20.0 is the lowest of the six scorecard inputs by a wide margin, and the scorecard's own state label reflects a trend reading, not a single data point.
The Key Issue
Whether the operating-margin and ROIC recovery since the FY2024 trough (26.10% operating margin, 5.57% ROIC) continues into the December 9, 2026 print — consensus revenue of $34.90B (+93.71% YoY implied) and EPS of 3.83 (+96.41% YoY implied) — or whether a FY2024-style compression returns. The trailing ROIC of 24.03% against the FY2025 full-year figure of 16.36% is the specific cell that print will move.
Sources
- FMP /stable/earnings (actuals vs consensus, eight quarters), /historical/earning_calendar/AVGO (report timing), /historical-price-full/AVGO (daily closes; moving averages and ranges computed from them) — pulled November 13, 2026.
- FMP /income-statement, /cash-flow-statement, /balance-sheet-statement (quarterly, nine quarters; the Q3 FY2026 statements filed September 10, 2026) and the annual statements plus /key-metrics for FY2020–FY2025 — pulled November 13, 2026.
- FMP /analyst-estimates and /key-metrics-ttm — pulled November 13, 2026.
- Altamira KPI Scorecard, edition 2026-11-12 (kpi-scorecard-2026-11-12.json): composite, pillar and technical scores, tier, state and fair-value cells as published. Fair value is stated as published in the dataset.
- SEC EDGAR, Broadcom Inc. 8-K, Item 8.01, filed July 6, 2026 (Broadcom–Apple technology collaboration through 2031).
- Guidance, segment detail and management commentary: NOT STATED — the earnings-call transcript is not in the dataset for this edition.
Research for information only — not investment advice; see Disclosures.
On the data pages
- AVGO company page — the filed figures, margins, cash flow and the print history, from SEC EDGAR.
- AVGO vs NVDA, head to head — the two on the same scorecard cells (top composite in Technology (kpi-scorecard-2026-11-12.json)).
- Verdict ledger — every public call, on the record.
- Earnings schedule — who reports next, and how every print this season graded.