Cadence: Priced for the Supercycle — Q3 2026 Earnings Preview
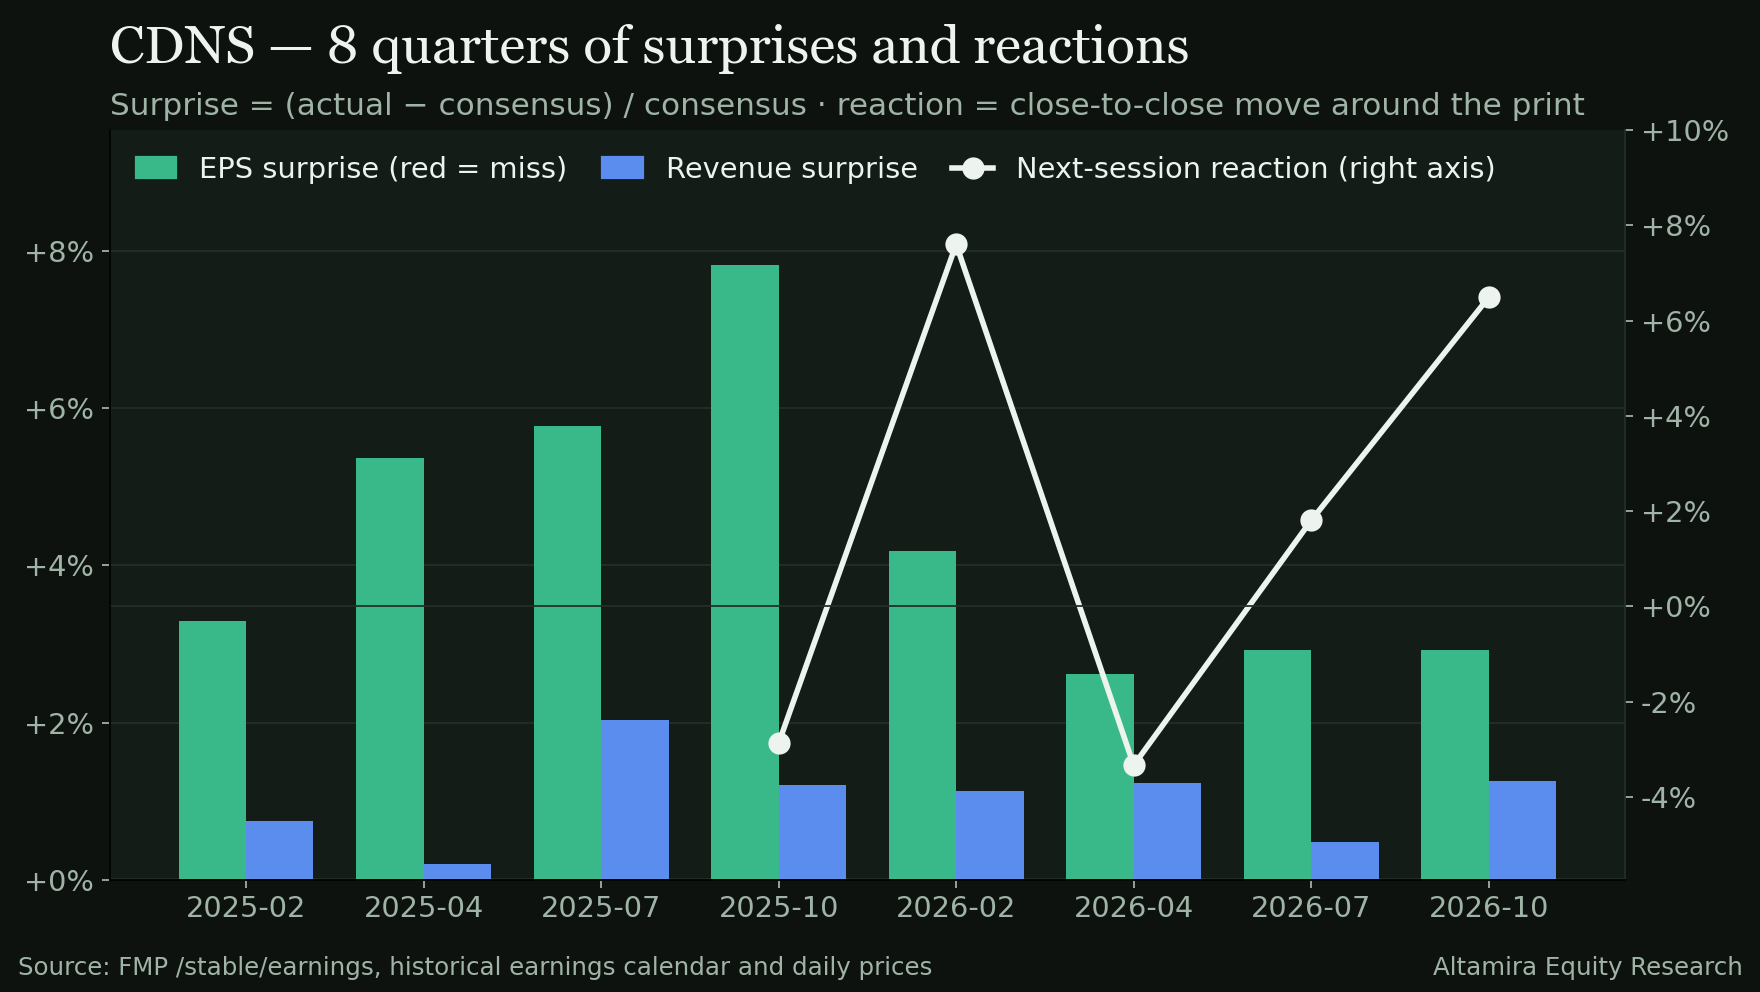
The setup in one line: Cadence raised full-year guidance to 19% revenue growth in July on a record $8.1B backlog — and tonight's consensus ($2.05 EPS on $1,613M) sits almost exactly on the midpoint of the guidance Cadence itself gave for this quarter.

Corrected Oct 26, 2026: the first issue of this edition incorrectly flagged Morningstar's fair value as unavailable. It has since been verified on the signed-in Morningstar quote page — Fair Value $350.00 (Jul 28, 2026), 3 stars, Price/Fair Value 0.90 — and the Quality Scorecard has been re-run with it (Total 44.9). This corrected issue supersedes the first.
The setup in one line: Cadence raised full-year guidance to 19% revenue growth in July on a record $8.1B backlog — and tonight's consensus ($2.05 EPS on $1,613M) sits almost exactly on the midpoint of the guidance Cadence itself gave for this quarter. There is no cushion in the number; the print has to beat, and guidance has to move, for a stock already priced at ~34× forward earnings.
At a glance — the print
Report Today, AMC Mon Oct 26, 2026 · fiscal Q3, period ending Sep 30, 2026
Consensus EPS (non-GAAP) $2.05 FMP earnings calendar · Cadence Q3 guide: $2.01–$2.07
Consensus revenue $1,613M FMP · Cadence Q3 guide: $1,595–$1,625M
Price (pre-print) $320.96 Scorecard close · −22.9% from 52-week high $416.39
Last reported quarter — Q2 2026 (reported Jul 27, 2026)
| Metric | Actual | Estimate | Surprise |
|---|---|---|---|
| Revenue | $1,584.5M | $1,576.9M | +0.5% |
| EPS (non-GAAP, FMP calendar) | $2.11 | $2.05 | +2.9% |
| Gross / operating (GAAP) / net margin | 84.9% / 28.4% / 23.2% · Non-GAAP operating margin 45.5% (call) | ||
| Backlog | Record $8.1B at Q2 exit (call) | ||
| FY26 guidance (raised Jul 27) | Revenue $6,260–$6,340M (+19% at midpoint) · Non-GAAP EPS $8.05–$8.15 · Operating cash flow ~$2B · ~50% of FCF to buybacks | ||
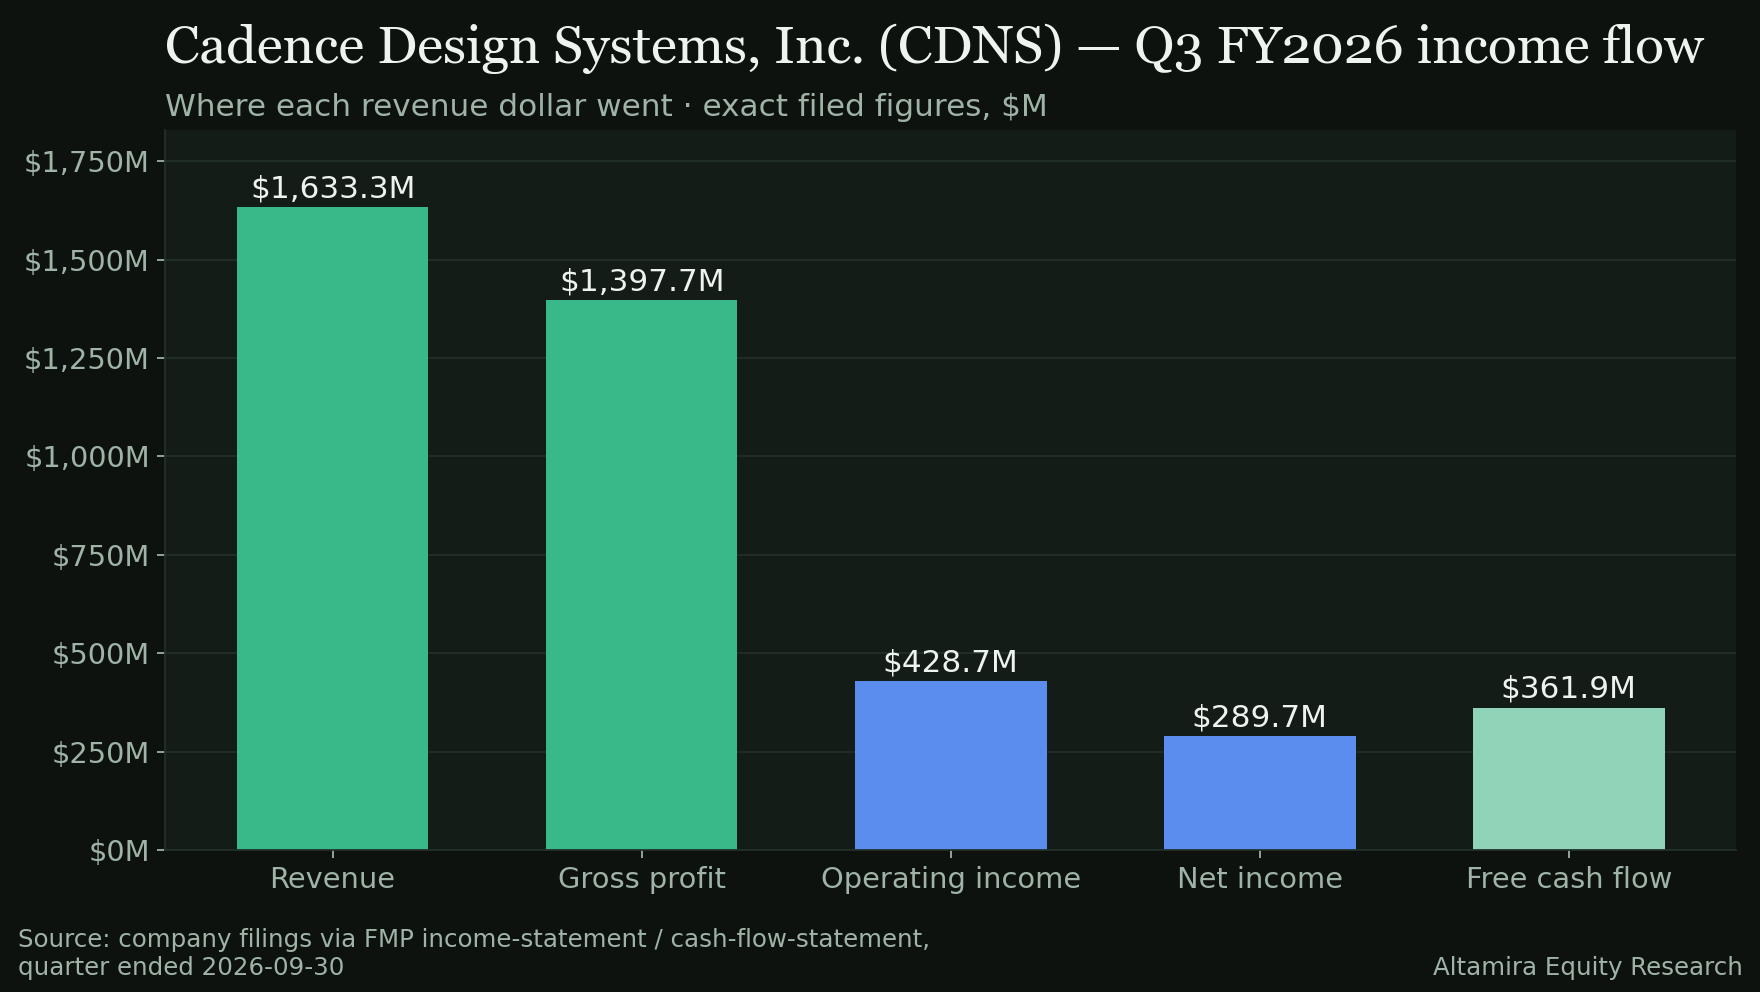
Q2 2026 Sankey — the last filed quarter
Revenue $1,584.5M · 100.0%
Cost of revenue $239.3M · 15.1%
Gross profit $1,345.1M · 84.9%
R&D $531.3M · 33.5%
SG&A $329.6M · 20.8%
Other operating expenses $34.3M · 2.2%
Operating income $450.0M · 28.4%
Income tax $143.2M · 9.0%
Net income $367.1M · 23.2%
Exact filed figures, FMP quarterly income statement, fiscal period ending Jun 30, 2026. Flow widths are proportional to revenue. Pre-tax income was $510.2M (operating income plus $60.3M net other income); tax $143.2M.
How Cadence makes money
Cadence sells the software (EDA), verification hardware/software, and semiconductor IP that chip and system companies use to design silicon — increasingly wrapped in agentic-AI "Super Agents" that call its physics-based engines more often. Revenue is predominantly recurring software: in FY2025, product & maintenance was $4,821.6M (91.0%) of the $5,296.8M total, with technology services $475.2M (9.0%). By product group (Fiscal.ai, FY2025): Core EDA $3.70B (69.9%), System Design & Analysis $821.4M (15.5%), and IP $775.0M (14.6%). By geography (mutually exclusive split): Americas $2,479.3M (US $2,311.0M), EMEA $790.6M, China $680.0M (12.8% of revenue — remember that share when the export-control language comes up), Japan $341.7M, and Other Asia $1,005.2M. In Q2 2026 every product group grew double digits year over year: Core EDA +18% and IP over +40% (call).
Product & maintenance $4,822M · 91.0%
Technology services $475M · 9.0%
By product group — FY2025
Core EDA $3,700M · 69.9%
System Design & Analysis $821M · 15.5%
IP $775M · 14.6%
In charts
The numbers behind this note, drawn from the same filed figures.
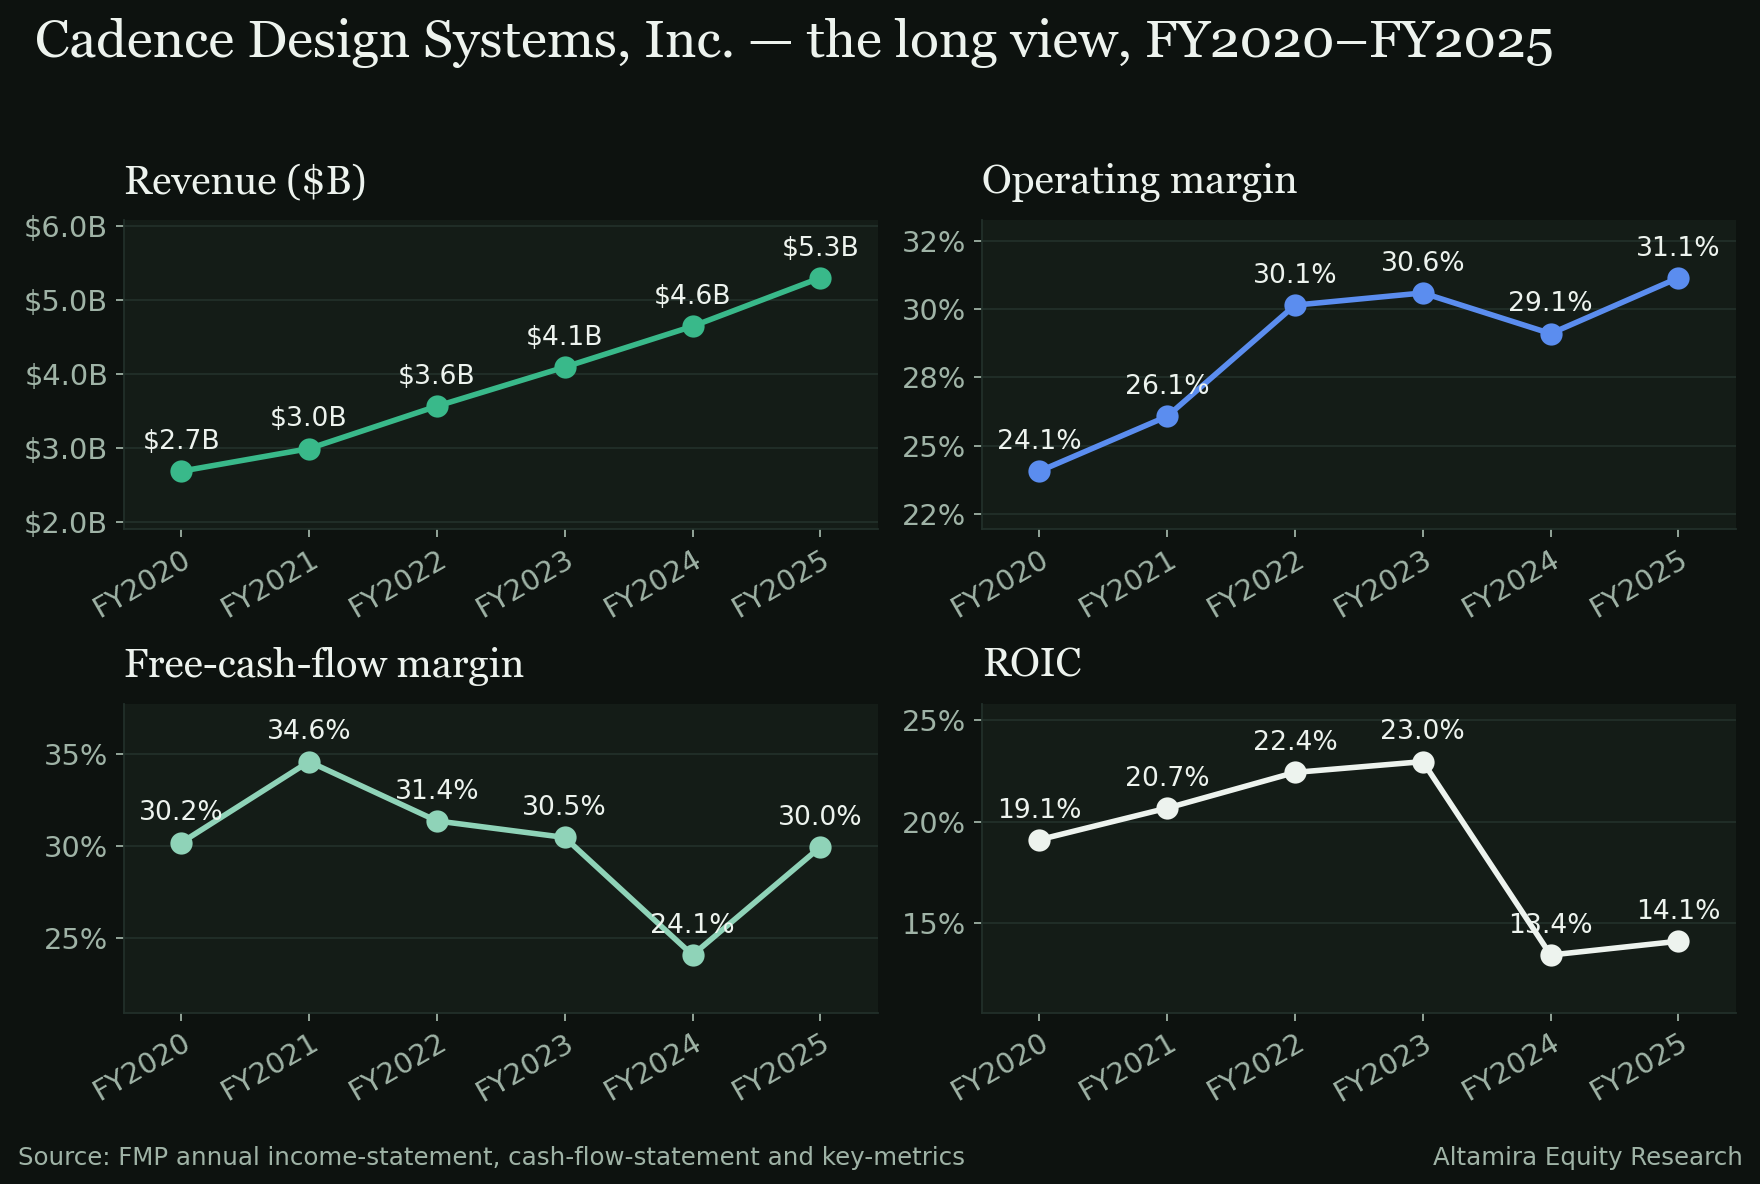
Sources: FMP revenue product segmentation (FY2025, filed), cross-checked line-by-line against Fiscal.ai Segments & KPIs pulled Oct 26, 2026 — the two agree (product & maintenance $4.82B, services $475.2M on both). Fiscal.ai company snapshot: revenue TTM $5.84B, market cap $88.35B, EV $89.39B, P/E 63× (GAAP basis).
The setup in charts
Quarterly revenue — the 19% growth claim, quarter by quarter
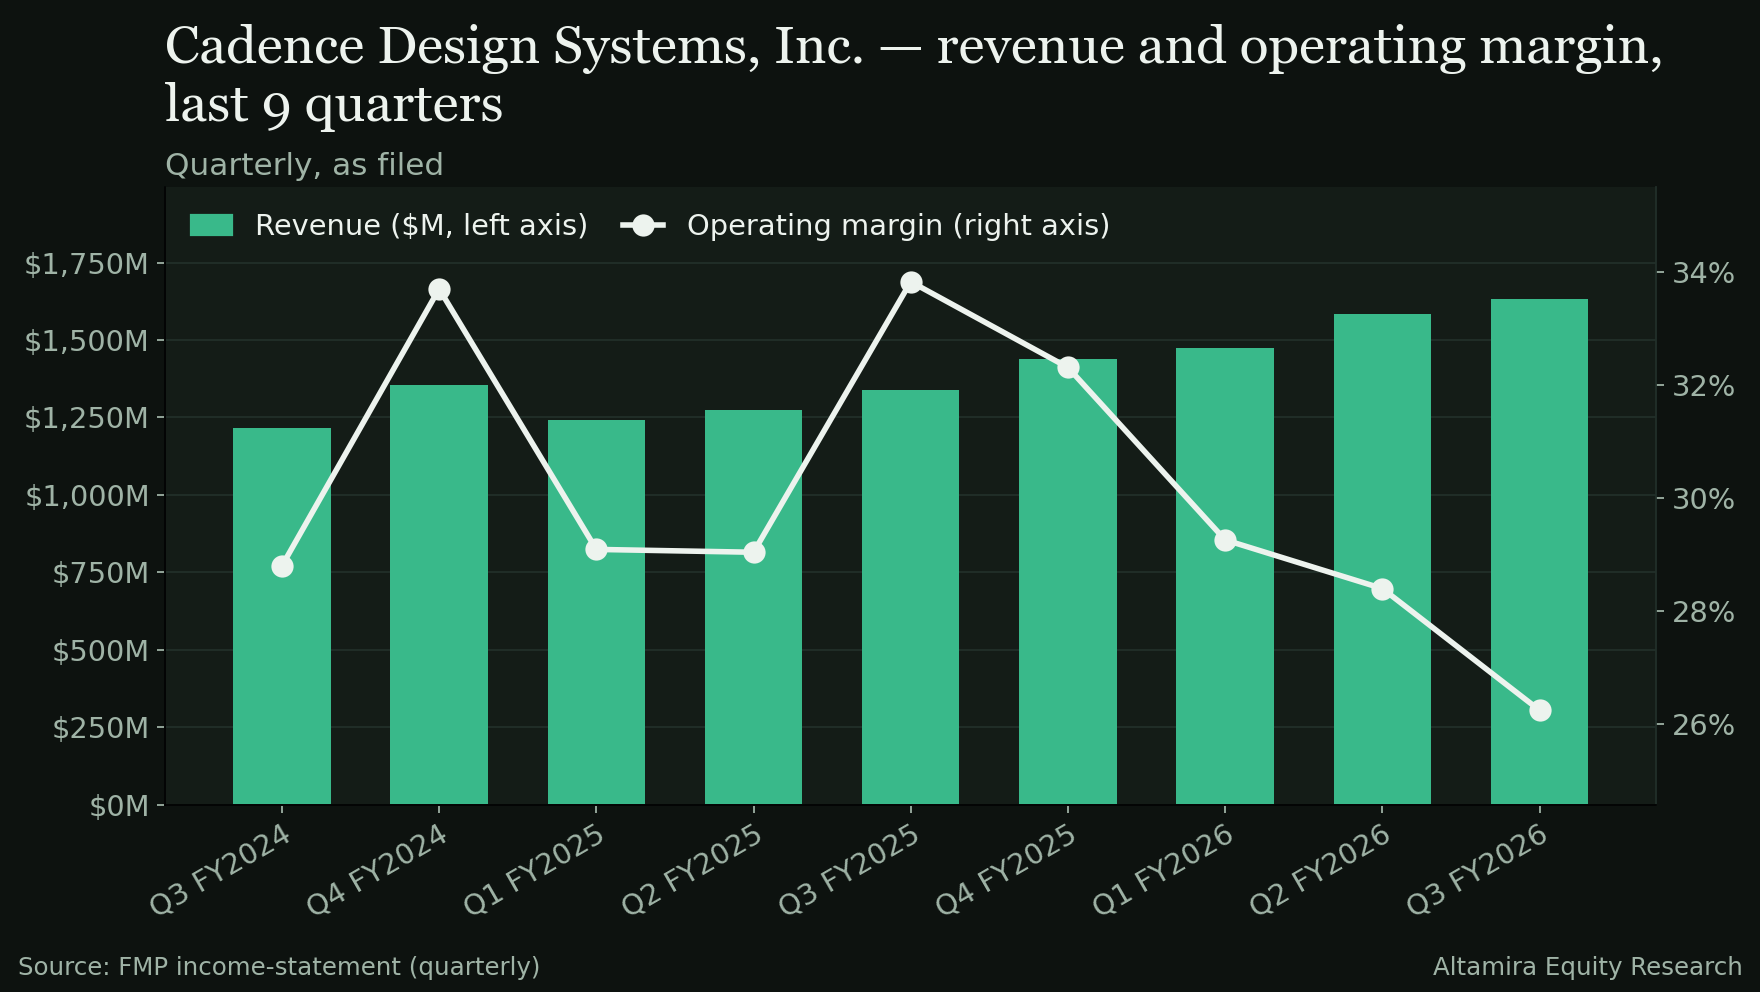
Q3 ’25 $1,339M
Q4 ’25 $1,440M
Q1 ’26 $1,474M
Q2 ’26 $1,584M
Q3 ’26 consensus $1,613M
Revenue has stepped up every quarter for a year. Q3 consensus of $1,613M is only +1.8% sequentially — the seasonality is in Q4 — so the debate tonight is less the quarter than whether FY guidance rises again.
What to watch tonight
- Beat size vs the midpoint. Consensus ($2.05 / $1,613M) is the guidance midpoint ($2.01–$2.07 / $1,595–$1,625M). A print at consensus is a print at plan — historically not enough for this multiple.
- FY26 guidance. Raised in July to $6,260–$6,340M revenue and $8.05–$8.15 non-GAAP EPS. A second raise confirms the supercycle; a hold invites "peak growth" questions.
- Backlog. $8.1B was a record at Q2. Growth in backlog and recurring revenue is the cleanest demand signal Cadence gives.
- Agentic AI monetisation. ChipStack had 20+ customer engagements and ViraStack 25+ in Q2. Do the Super Agents show up as add-on revenue, or stay as engagement counts?
- China and export controls. The July outlook explicitly assumed export-control rules stay "substantially similar" for the rest of the year. Any change in that language matters more than any single line item.
- Margins and buyback. Q3 non-GAAP operating margin was guided to 43.5–44.5%; Q2 buybacks were $200M against a plan to return ~50% of FCF.
The Key Issue
Thesis: Cadence is the toll road for AI silicon — every hyperscaler chip, every advanced node, every 3D-IC package needs its tools — and agentic AI multiplies tool usage rather than replacing it. The question is not whether the business is superb; it is whether superb is already in the price.
Evidence for
- Guidance was raised in July to 19% revenue growth with higher profitability — management is leaning into demand, not managing it down.
- Record backlog of $8.1B and broad-based double-digit growth across all product groups (Core EDA +18%, IP +40%+ YoY in Q2).
- Agentic AI is a usage accelerator: autonomous agents expand the design-exploration space and call Cadence's engines more often — a structural TAM tailwind described on the Q2 call.
- Cash quality is elite: Q2 operating cash flow $635M, free cash flow $582M, gross margin ~86% on the scorecard's latest-FY basis.
Evidence against
- Valuation: P/E NTM ~34.5× (scorecard score 22.0) and an FCF yield of 1.9% leave thin room for disappointment; even Morningstar's $350 fair value implies only ~9–11% headroom from here — supportive, not a bargain signal.
- Consensus equals the guidance midpoint — the "beat" the stock needs is not in the published number.
- The outlook carries an explicit export-control assumption, and China was $680.0M — 12.8% of FY2025 revenue (Fiscal.ai/FMP segmentation). That exposure is a policy variable, not a market one.
- The stock is already −22.9% from its 52-week high and below its 200-day average — the market has been quietly de-rating the name into the print.
What to watch
FY guidance direction, backlog growth, and whether IP can sustain anything near Q2's +40% pace. One quarter of merely meeting plan, at this multiple, would likely extend the de-rating; a raise would re-arm the supercycle story.
Research for information only — not investment advice; see Disclosures.