Cadence: Beat, Raise, Record Backlog — Q3 2026
The quarter in one line: Cadence beat on both lines (non-GAAP EPS $2.11 vs $2.05, revenue $1,633M vs $1,613M), lifted full-year guidance to 21% revenue growth, and took backlog to a record $8.2B — the exact raise-and-beat yesterday's preview said the multiple required.

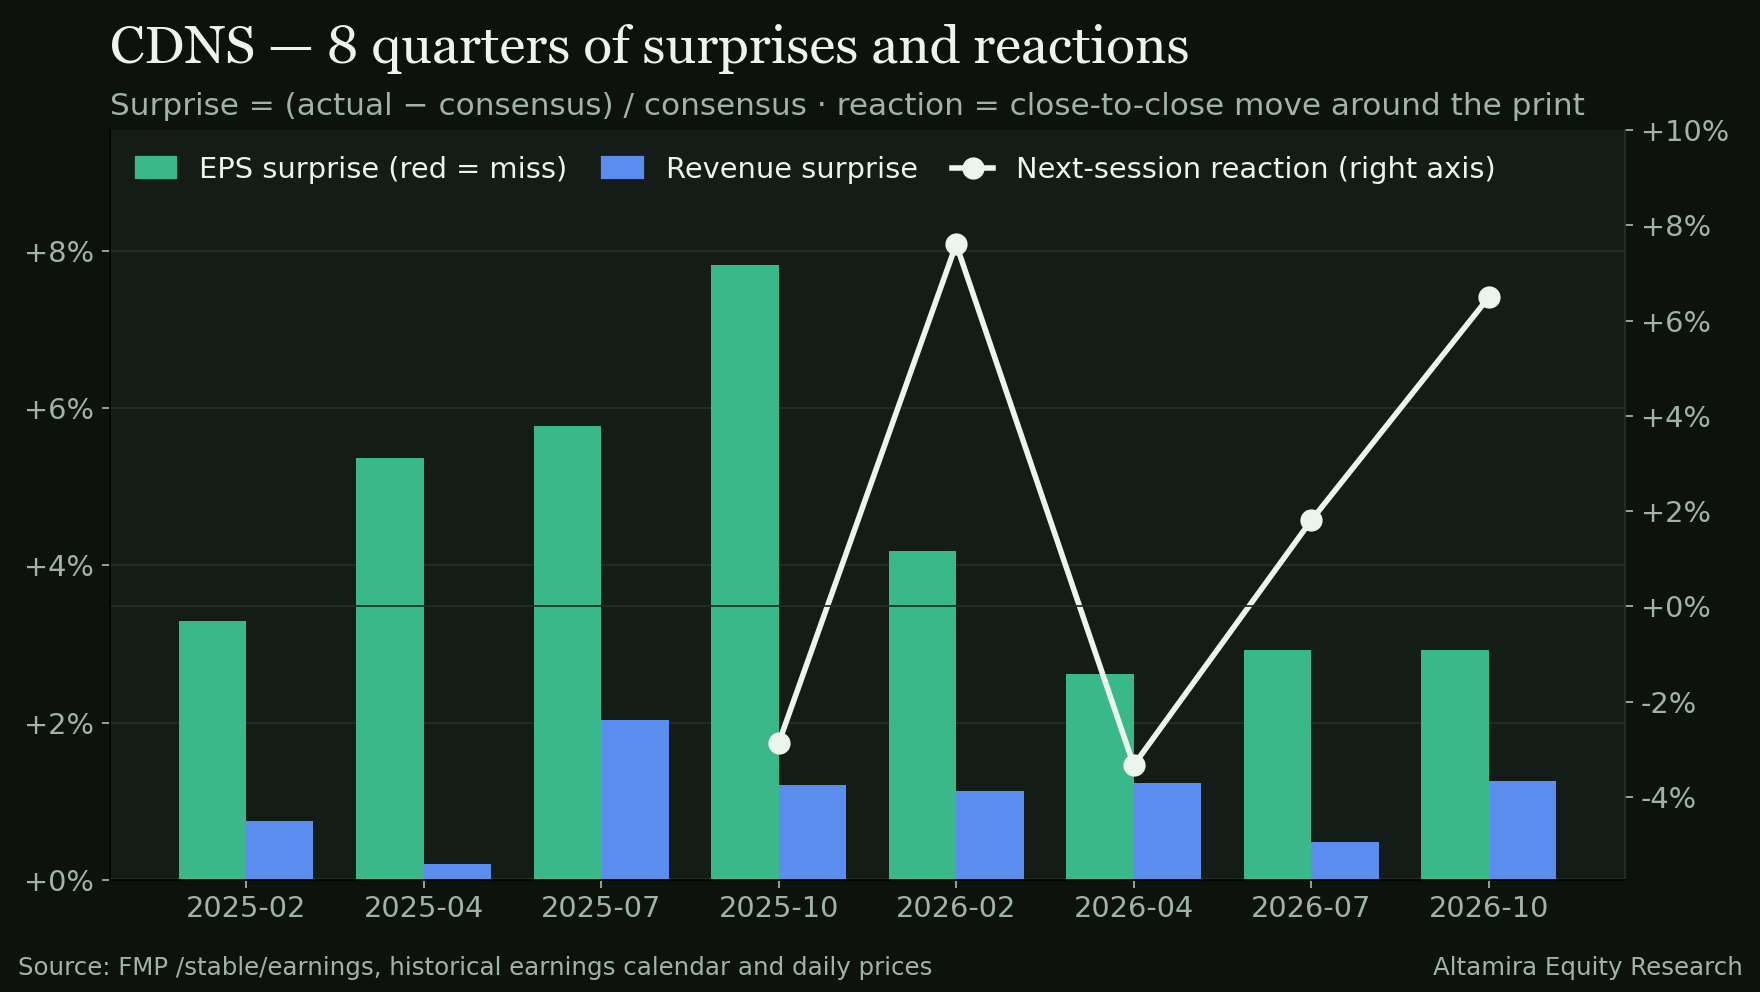
The quarter in one line: Cadence beat on both lines (non-GAAP EPS $2.11 vs $2.05, revenue $1,633M vs $1,613M), lifted full-year guidance to 21% revenue growth, and took backlog to a record $8.2B — the exact raise-and-beat yesterday's preview said the multiple required. The stock rose just +2.6% after hours, because at ~34.5× forward earnings, delivery was the expectation, not the surprise.
At a glance — Q3 2026 scoreboard
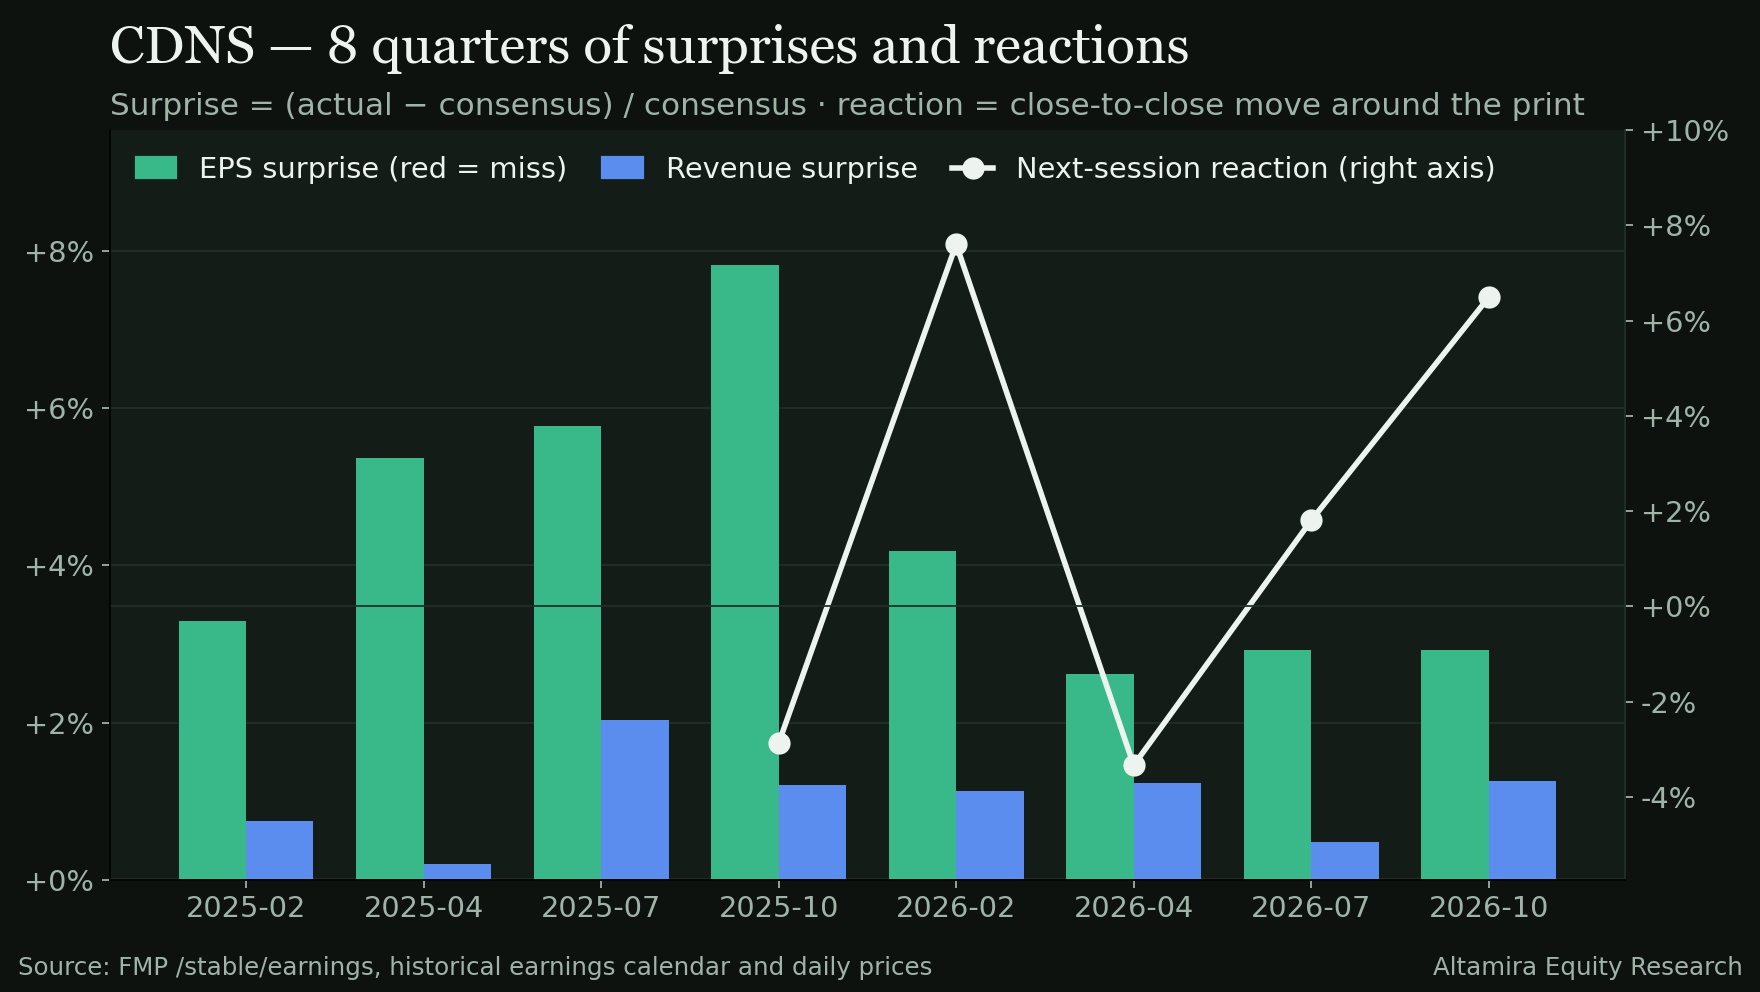
Revenue $1,633M vs $1,613M est · +1.3% surprise · +22.0% YoY · +3.1% QoQ
EPS (non-GAAP) $2.11 vs $2.05 est · +2.9% surprise · GAAP diluted EPS $1.05
Guidance RAISED FY26 revenue $6.387–$6.417B (+21%) · non-GAAP EPS mid $8.40 (+$0.30)
Reaction +2.6% AH To $324.88 from $316.49 close · 8Q avg abs move ±6.6%
| Metric | Actual | Estimate | Surprise |
|---|---|---|---|
| Revenue | $1,633.3M | $1,612.9M | +1.26% |
| EPS (non-GAAP, FMP calendar basis) | $2.11 | $2.05 | +2.93% |
| Gross margin (GAAP) | 85.6% · +68 bp QoQ · −82 bp YoY | ||
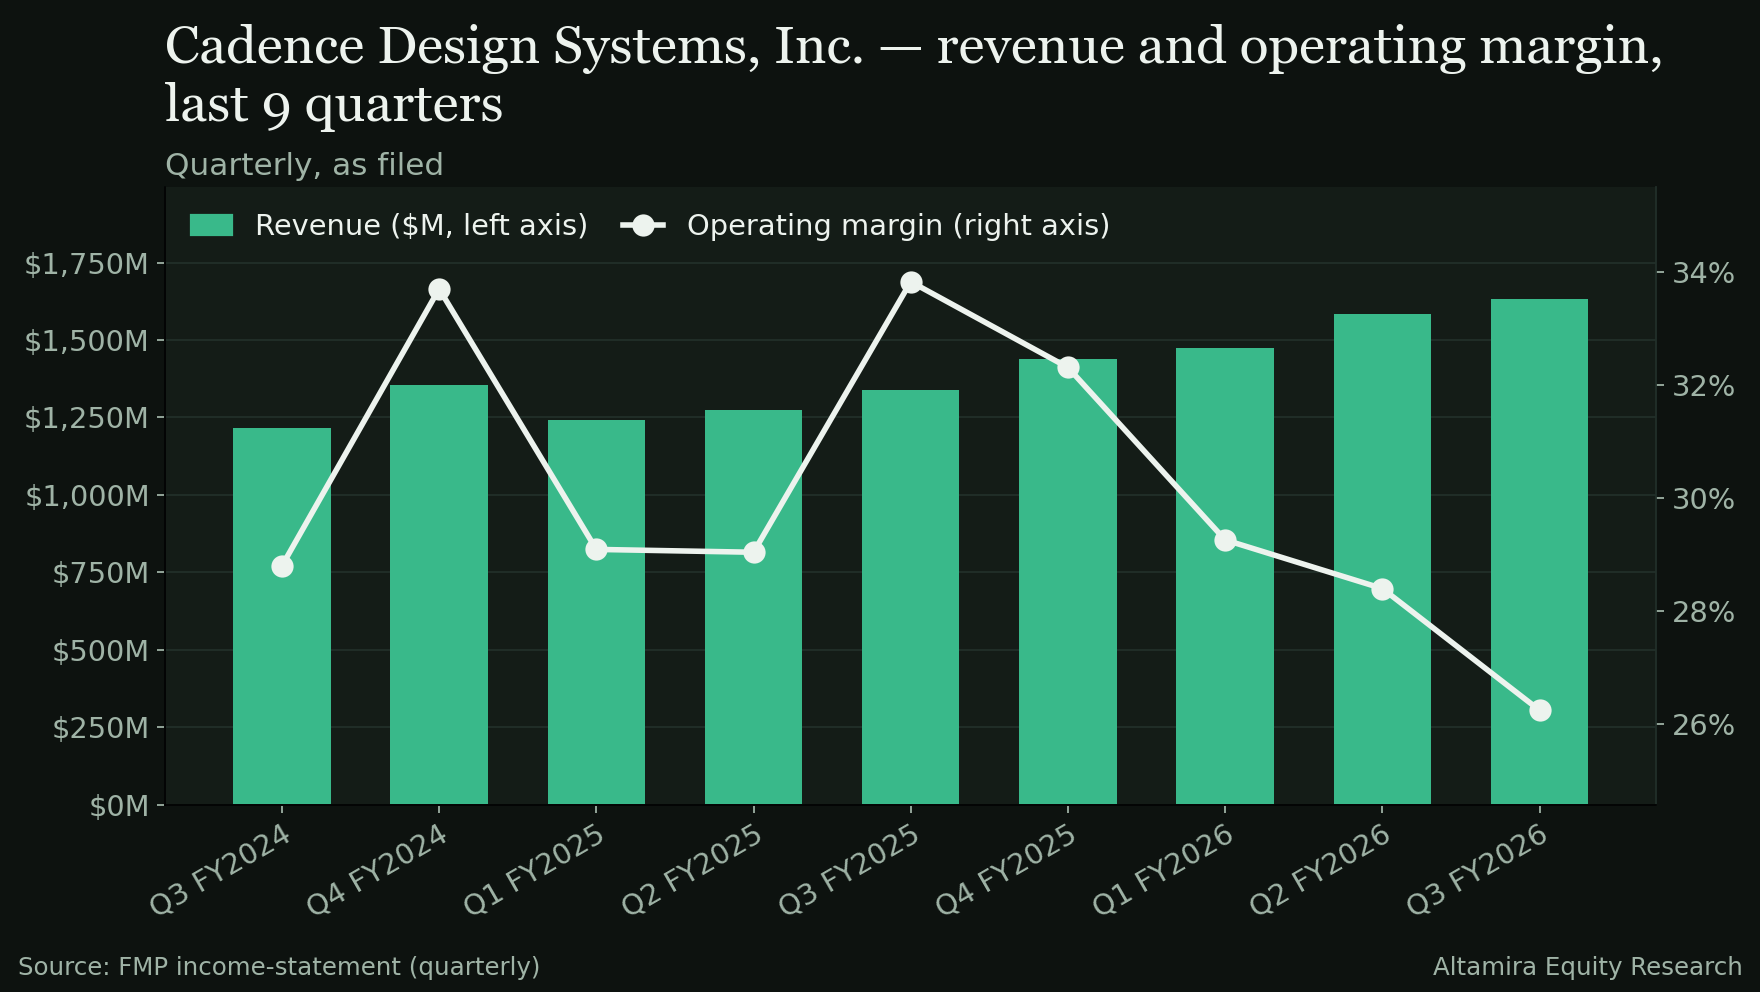
| Operating margin (GAAP / non-GAAP) | 26.2% / 44.1% · GAAP −215 bp QoQ, −757 bp YoY (see margins note) | ||
| Net margin (GAAP) | 17.7% · net income $289.7M | ||
| Backlog | Record $8.2B (call) — up from $8.1B at Q2 | ||
| Cash generation | OCF $423.7M · FCF $361.9M · FCF conversion 124.9% of net income | ||
| Capital return | $400.0M buyback in Q3 + new $2.5B authorisation · no dividend | ||
| Balance sheet | Cash $1,452.0M · total debt $2,483.2M · net debt $1,031.2M · net debt/EBITDA 0.46× | ||
Beat streak: this is Cadence's 8th consecutive quarter beating both EPS and revenue estimates in the Recap history (EPS surprises +2.9% to +12.3% over the window).
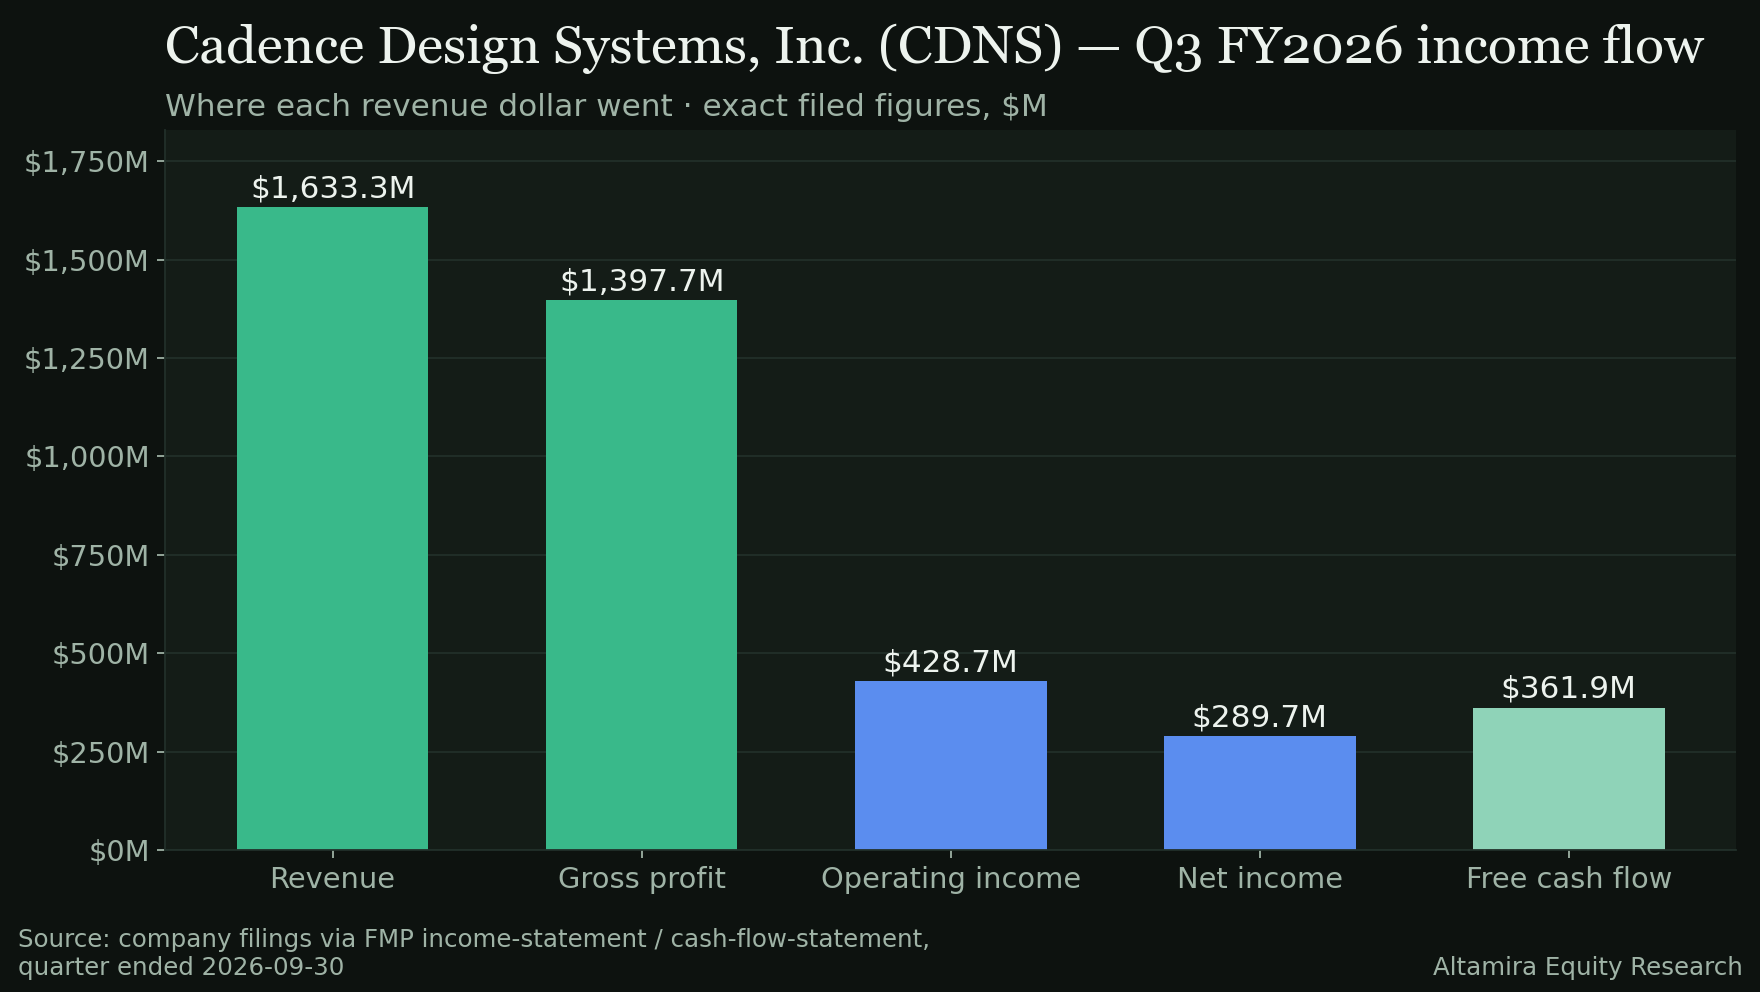
Q3 2026 Sankey — where the dollar went
Revenue $1,633.3M · 100.0%
Cost of revenue $235.6M · 14.4%
Gross profit $1,397.7M · 85.6%
R&D $537.5M · 32.9%
SG&A (S&M + G&A) $355.5M · 21.8%
Other operating expenses $75.9M · 4.6%
Operating income $428.7M · 26.2%
Income tax $118.6M · 7.3%
Net income $289.7M · 17.7%
Exact filed figures, FMP quarterly income statement, fiscal period ending Sep 30, 2026 (filed Oct 26, 2026). Flow widths are proportional to revenue. Pre-tax income was $408.3M (operating income less $20.4M net other expense); tax $118.6M. Stock-based compensation was $144.8M — 8.9% of revenue — which is why the GAAP operating margin (26.2%) and the non-GAAP margin (44.1%) differ so widely; never mix the two bases.
How Cadence makes money
Cadence sells the software (EDA), verification hardware/software, and semiconductor IP that chip and system companies use to design silicon — increasingly wrapped in agentic-AI agents that call its physics-based engines more often. Revenue is predominantly recurring software: in FY2025, product & maintenance was $4,821.6M (91.0%) of the $5,296.8M total, with technology services $475.2M (9.0%). By product group (Fiscal.ai, FY2025): Core EDA $3.70B (69.9%), System Design & Analysis $821.4M (15.5%), and IP $775.0M (14.6%). By geography (mutually exclusive split): Americas $2,479.3M (US $2,311.0M), EMEA $790.6M, China $680.0M (12.8% of revenue — the export-control exposure), Japan $341.7M, and Other Asia $1,005.2M. Q3 2026 growth by group (call): Core EDA +20% YoY, IP +24%, System Design & Analysis +30%; recurring revenue +18% YoY.
Product & maintenance $4,822M · 91.0%
Technology services $475M · 9.0%
By product group — FY2025
Core EDA $3,700M · 69.9%
System Design & Analysis $821M · 15.5%
IP $775M · 14.6%
In charts
The numbers behind this note, drawn from the same filed figures.
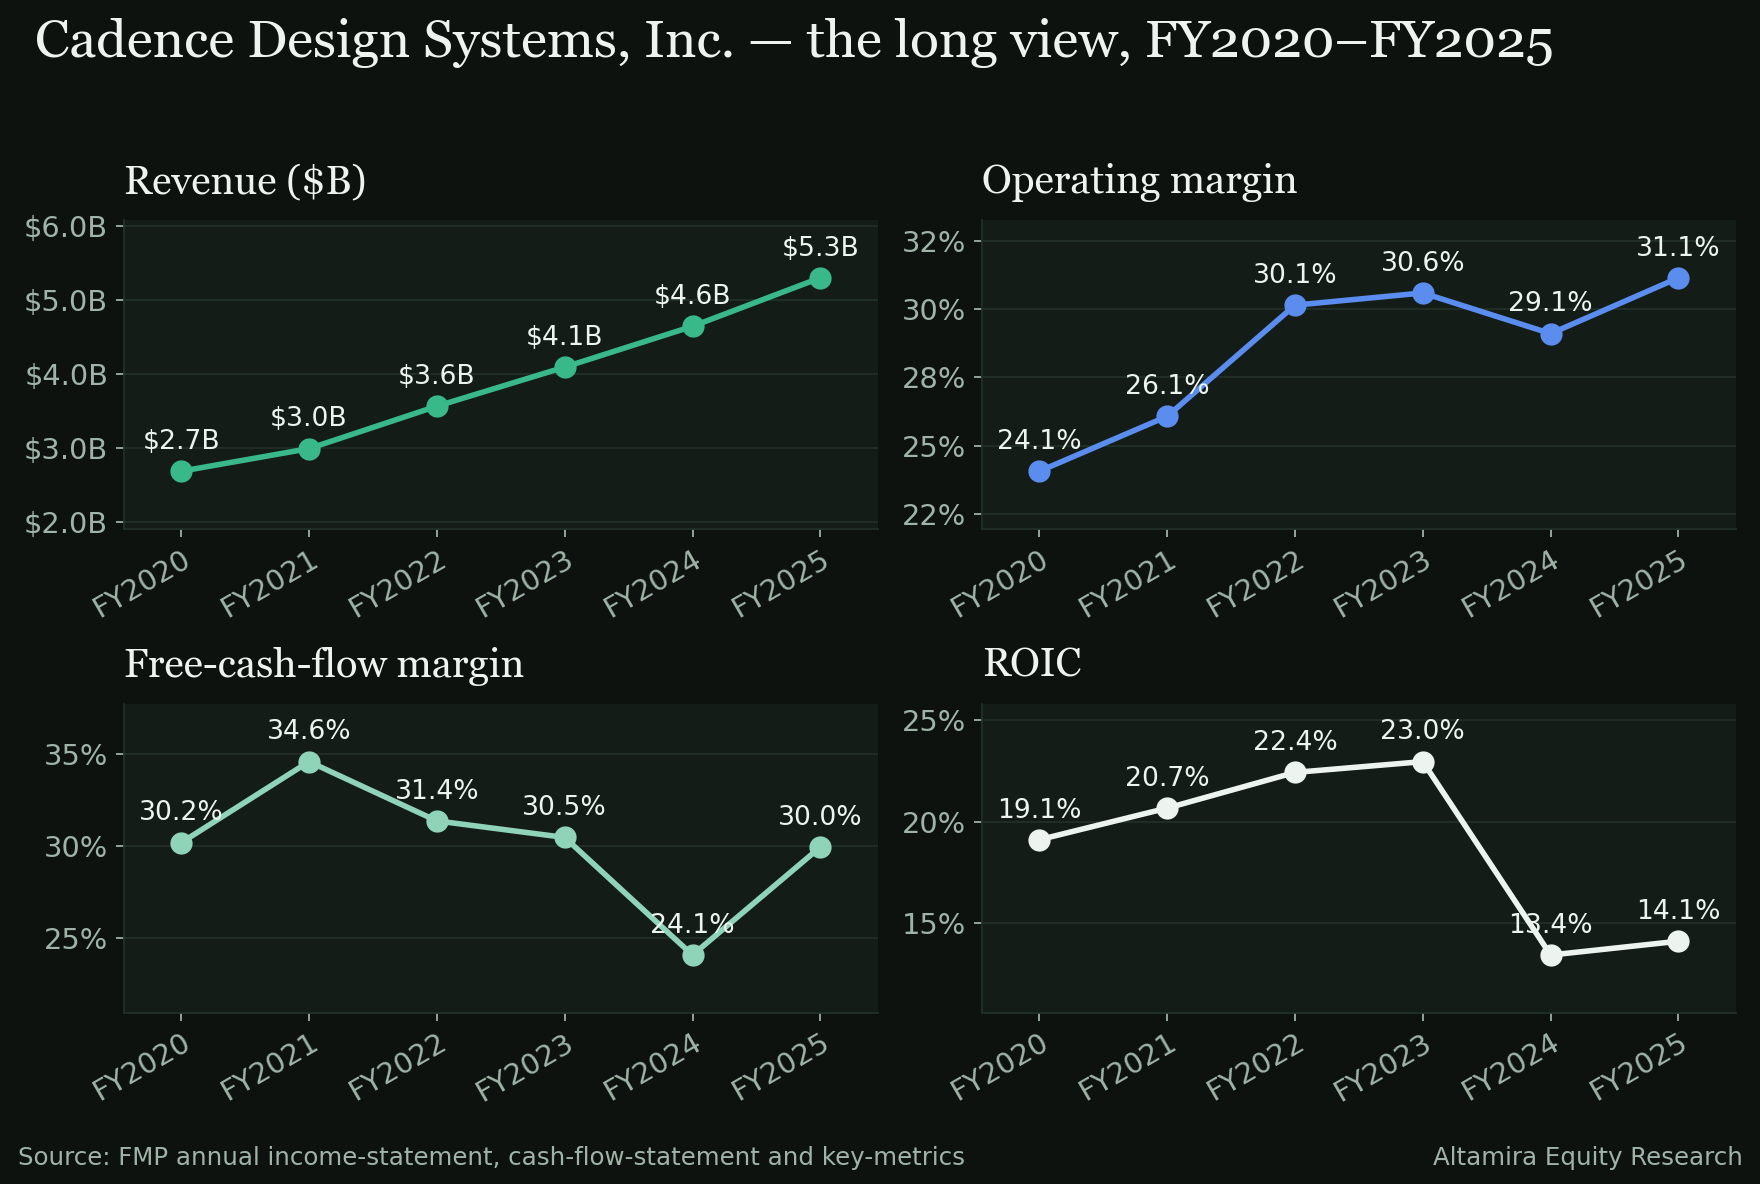
Sources: FMP revenue product segmentation (FY2025, filed), cross-checked line-by-line against Fiscal.ai Segments & KPIs pulled Oct 26, 2026 — the two agree. Fiscal.ai snapshot (Oct 26): revenue TTM $5.84B, market cap $88.35B, EV $89.39B.
The quarter in charts
Quarterly revenue — five quarters of step-ups
Q3 ’25$1,339MQ4 ’25$1,440MQ1 ’26$1,474MQ2 ’26$1,584MQ3 ’26$1,633M
Revenue has now stepped up five quarters in a row, and Q3's $1,633M (+22.0% YoY) came in above the top of Cadence's own $1,595–$1,625M guide. The Q4 guide of $1,695–$1,725M implies the step-up continues — the FY26 raise to $6.387–$6.417B is arithmetic on this trajectory, not hope.
Margins — the one soft spot, explained but not erased
GAAP operating margin fell to 26.2% (−757 bp YoY). Management attributed the two drags directly: (i) the Q3 G&A spike was the timing of annual charitable contributions (Q3 this year vs Q4 last year), not run-rate cost; and (ii) the Hexagon D&E acquisition adds ~$160M of guided revenue with little operating profit this year, masking the usual ~54–55% incremental margin. Non-GAAP operating margin held at 44.1%, and Q4 is guided to 44–45% non-GAAP (30–31% GAAP) — the recovery test is whether GAAP margin actually prints there.
What management said
- Guidance — RAISED. FY26 revenue $6.387–$6.417B (21% growth), non-GAAP EPS $8.37–$8.43 (midpoint $8.40, +$0.30), GAAP EPS $4.84–$4.90, GAAP operating margin 28.2–29.2%, non-GAAP 44.2–45.2%. Q4: revenue $1.695–$1.725B, non-GAAP EPS $2.19–$2.25. Quote: "Given our business momentum, expanding technology leadership, and compelling AI growth opportunities, we are raising our revenue outlook for the year to 21% growth and our EPS outlook by $0.30 to $8.40." The outlook still assumes export controls remain substantially as today.
- Demand. Revenue +22% YoY, broad-based: Core EDA +20%, IP +24%, SD&A +30%; recurring revenue +18% YoY (vs +11% a year ago). Record backlog $8.2B on strong bookings in a light renewal year. Palladium/Protium hardware had another record quarter; the agentic portfolio passed 100 active engagements.
- Agentic AI / Maestro. New Maestro domain-specialised models are claimed to deliver up to 30% higher quality and up to 5× token efficiency; ViraStack engagement is up 4×, MediaTek verification coverage +50–70%, Renesas InnoStack productivity 34×. Monetisation is still described in engagements and usage, not dollars.
- Margins. GAAP gross 85.6% (+68 bp QoQ, −82 bp YoY); GAAP operating 26.2%; non-GAAP operating 44.1%; net 17.7%. The G&A and Hexagon explanations are above — both were given unprompted in Q&A detail (Mizuho, Wells Fargo), which lends them credibility, but they are explanations, not reversals.
- Capital return. Q3 OCF $424M, FCF $362M; $400M repurchased in Q3 and a further $2.5B authorised. Full-year OCF guided to ~$2B, with more than 50% of FCF to repurchases in 2026. Cash $1.452B vs debt principal $2.65B; DSOs 66 days. No dividend.
- Analyst Q&A pressure points. Goldman pressed the recurring-revenue dip to +18% and agentic acceleration (answer: China timing last year; agentic use is driving base-tool usage). BofA pressed competitor claims of mid-teens-to-30% growth, ~50% margins and ~$1B royalties — Devgan countered with Cadence's own "rule of 65" (21% growth + ~45% margin), deferred the multiyear outlook to February, and noted royalties already exist in Tensilica/design IP but are "just 1 vector." KeyBanc, Needham, Morgan Stanley and Baird all pressed Maestro vs the Synopsys/frontier-lab route; management stressed control, model routing and on-prem/post-training flexibility.
The Key Issue
Thesis: The print answered the preview's question — Cadence did beat and raise. The Key Issue now moves one level up: can agentic AI turn engagement counts into disclosed, durable revenue fast enough to defend a ~34.5× forward multiple, while GAAP profitability absorbs an acquisition and stock compensation runs at ~9% of revenue?
Evidence for
- The raise is real and broad: FY revenue to +21%, EPS midpoint +$0.30, backlog to a record $8.2B, and every product group growing +20% or more — this is not one segment carrying the story.
- Recurring revenue re-accelerated to +18% YoY (from +11% a year ago) even in a light renewal year — the base business is strengthening underneath the AI narrative.
- Cash quality held: FCF $361.9M at 124.9% conversion, and the buyback stepped up to $400M in the quarter with $2.5B more authorised — capital return is funding itself.
- Management deferred the multiyear outlook to February rather than over-promising — and the "rule of 65" framing (growth + margin) is a testable yardstick they volunteered.
Evidence against
- GAAP operating margin is 26.2%, down 757 bp YoY. Even accepting the charitable-contribution timing and Hexagon drag, GAAP profitability is moving the wrong way while SBC runs at 8.9% of revenue ($144.8M in Q3) — the non-GAAP/GAAP gap is the cost of the model, not a footnote.
- Maestro monetisation remains unquantified: 100+ engagements, 4× ViraStack growth and customer productivity claims — but no agent revenue line, no attach rate, no pricing disclosure. BofA's royalty question went unanswered in dollars.
- Valuation still fails on its own terms: P/E NTM 34.5× (scorecard score 22.0), FCF yield ~1.9–2.0%, and Morningstar's $350 fair value is only ~7.7% above the after-hours price of $324.88. The +2.6% after-hours move — muted vs a ±6.6% historical average — is the market agreeing the beat was priced.
- The guidance still explicitly assumes export controls stay "substantially as today," with China at 12.8% of FY2025 revenue. That assumption is a policy variable outside management's control.
What to watch
February's multiyear outlook (the deferred answer to BofA's question); any first dollar disclosure for Maestro/agentic revenue; Q4 GAAP operating margin vs the guided 30–31% (the Hexagon/charitable explanations must show up as recovery); and recurring-revenue growth holding at or above +18%.
Research for information only — not investment advice; see Disclosures.