
MercadoLibre, Inc. (MELI) — Altamira company page
MercadoLibre, Inc. (MELI): 8 years of EDGAR statements charted, 8 quarters against consensus, scorecard pillars and Altamira's verdict record.
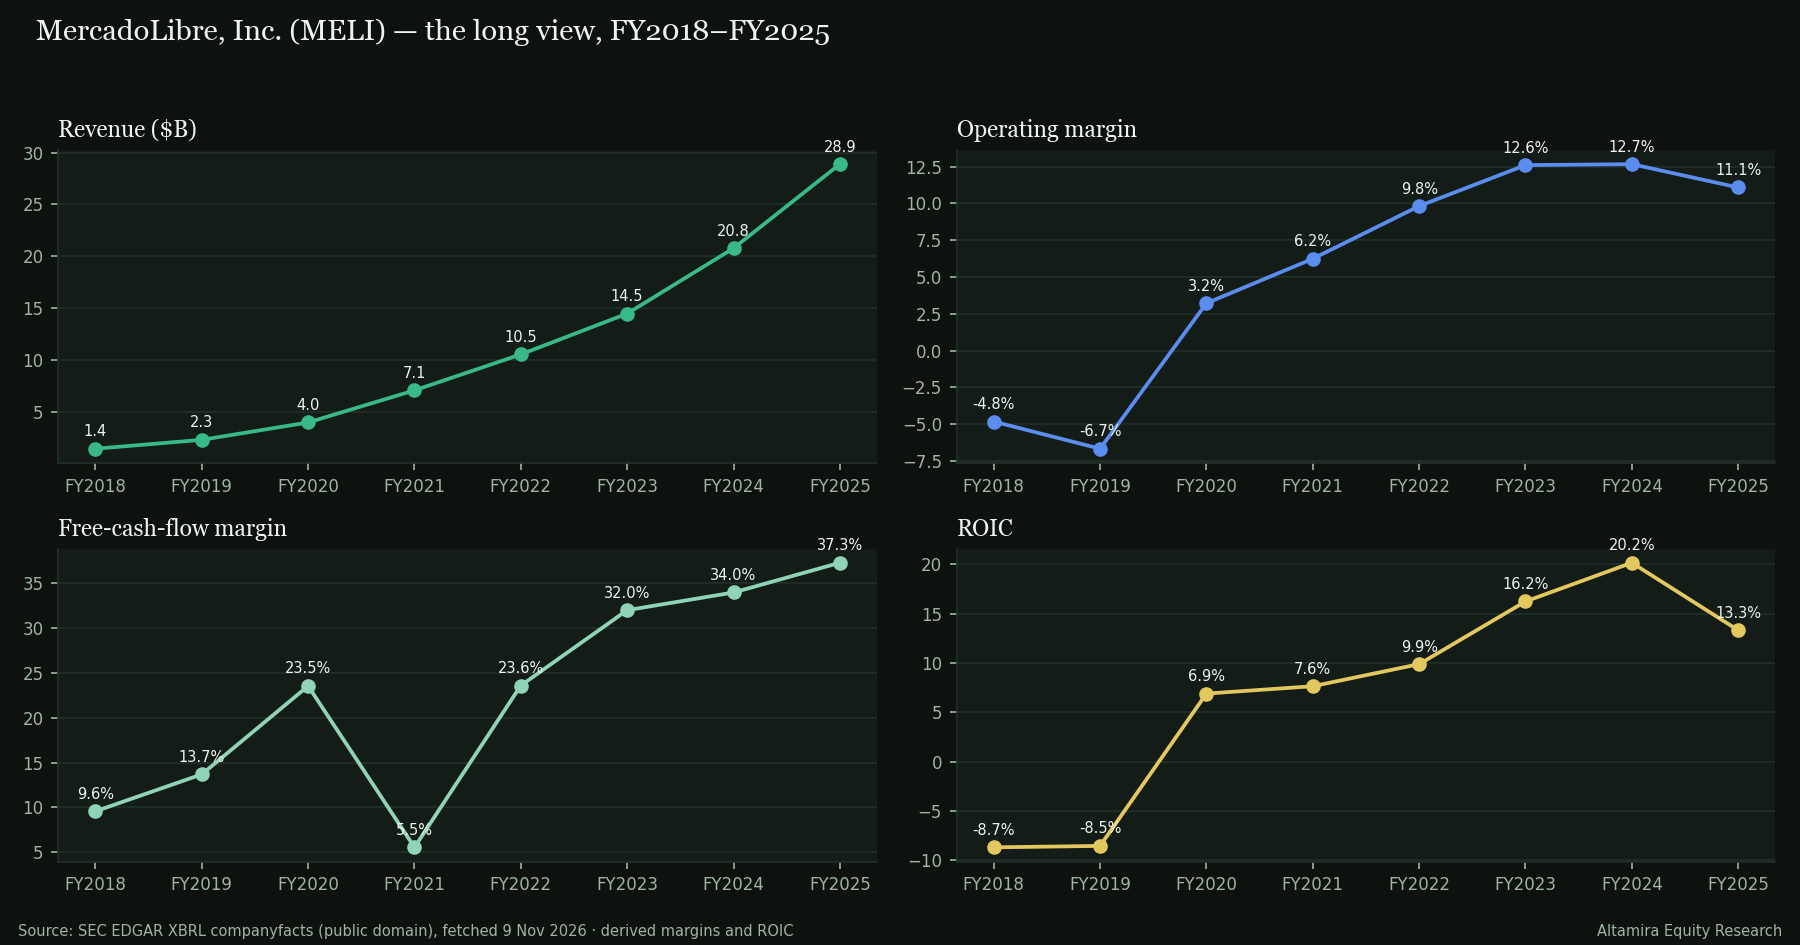
MercadoLibre, Inc. in its own filed numbers: what it earns, what it keeps, and what the last eight prints did to the case.
Data as of 6 Nov 2026Built 10 Nov 2026, 08:05 UTCNext refresh nightly, 03:30 PTSource SEC EDGAR companyfacts · FMP (derived figures) · Altamira KPI scorecard edition 9 Nov 2026
MercadoLibre, Inc. (MELI) · Consumer Cyclical · Specialty Retail
Compare MELI with another name →
Statements: SEC EDGAR XBRL companyfacts (public domain). Prints and consensus: FMP, derived figures only. Every table below names its source and pull time. Backward-looking throughout: nothing on this page forecasts a price or a result.
The picture
Revenue, 8 fiscal years
Gross and operating margin
Free cash flow and FCF margin
EPS (GAAP, diluted)
ROIC
Diluted shares outstanding
Last 12 quarters — revenue and operating margin
8 prints — surprise vs consensus and the market's reaction
Charts render from the tables below (EDGAR filings as first reported; FMP surprise and reaction figures). Hover for exact values.
The long view — FY2018 to FY2025
| Fiscal year | Revenue | YoY | Gross margin | Op margin | Net income | Free cash flow | FCF margin | ROIC | EPS (GAAP, diluted)As filed with the SEC under GAAP, per diluted share. Street consensus, and the actual it is compared with in the prints table, is on the analysts' adjusted basis (stock-based compensation, amortisation and one-offs stripped), so the two can differ: a Street beat can sit beside a GAAP decline. | Diluted shares | Net debt | First filed |
|---|---|---|---|---|---|---|---|---|---|---|---|---|
| FY2018 2018-12-31 | $1.44B | +18.3% | 48.4% | −4.8% | −$36.6M | $137.8M | 9.6% | −8.7% | −0.82 | 44.5M | $294.8M | 2019-02-28 10-K |
| FY2019 2019-12-31 | $2.30B | +59.5% | 48.0% | −6.7% | −$172.0M | $314.3M | 13.7% | −8.5% | −3.71 | 48.7M | −$567.2M | 2020-02-14 10-K |
| FY2020 2020-12-31 | $3.97B | +73.0% | 43.0% | 3.2% | −$0.7M | $935.5M | 23.5% | 6.9% | −0.08 | 49.7M | −$447.1M | 2021-03-01 10-K · restated later |
| FY2021 2021-12-31 | $7.07B | +77.9% | 42.5% | 6.2% | $83.3M | $392.1M | 5.5% | 7.6% | 1.67 | 49.8M | $2.22B | 2024-02-23 10-K |
| FY2022 2022-12-31 | $10.54B | +49.1% | 49.0% | 9.8% | $482.0M | $2.49B | 23.6% | 9.9% | 9.53 | 51.3M | $4.98B | 2024-02-23 10-K · restated later |
| FY2023 2023-12-31 | $14.47B | +37.4% | 49.8% | 12.6% | $987.0M | $4.63B | 32.0% | 16.2% | 19.46 | 51.0M | $4.23B | 2024-02-23 10-K · restated later |
| FY2024 2024-12-31 | $20.78B | +43.6% | 46.1% | 12.7% | $1.91B | $7.06B | 34.0% | 20.2% | 37.69 | 50.7M | $5.91B | 2025-02-21 10-K |
| FY2025 2025-12-31 | $28.89B | +39.1% | 44.5% | 11.1% | $2.00B | $10.77B | 37.3% | 13.3% | 39.40 | 50.7M | $10.15B | 2026-02-25 10-K |
Source: SEC EDGAR XBRL companyfacts, CIK 0001099590, fetched 9 Nov 2026, 07:26 UTC (public domain). Values as first reported in the filing named; a later restatement is flagged, not substituted. FCF = cash from operations − capex. ROIC = operating income × (1 − tax rate) ÷ (equity + debt − cash). Net debt = debt − cash; negative = net cash. Currency USD.
Last 12 quarters
| Quarter | Revenue | YoY | Gross margin | Op margin | EPS (GAAP, diluted)As filed with the SEC under GAAP, per diluted share. Street consensus, and the actual it is compared with in the prints table, is on the analysts' adjusted basis (stock-based compensation, amortisation and one-offs stripped), so the two can differ: a Street beat can sit beside a GAAP decline. | Cash from ops | Free cash flow | Cash | First filed | Derivation |
|---|---|---|---|---|---|---|---|---|---|---|
| Q4 FY2023 2023-12-31 | $4.26B | n/a | 45.9% | 7.9% | 3.25 | $1.93B | $1.75B | $2.56B | 2024-02-23 10-K · restated later | ytd-diff |
| Q1 FY2024 2024-03-31 | $4.33B | n/a | 46.7% | 12.2% | 6.78 | $1.51B | $1.37B | $2.58B | 2024-05-03 10-Q | as filed |
| Q2 FY2024 2024-06-30 | $5.07B | n/a | 46.6% | 14.3% | 10.48 | $1.88B | $1.70B | $2.82B | 2024-08-02 10-Q | ytd-diff |
| Q3 FY2024 2024-09-30 | $5.31B | +41.3% | 45.9% | 10.5% | 7.83 | $1.60B | $1.38B | $2.16B | 2024-11-07 10-Q | ytd-diff |
| Q4 FY2024 2024-12-31 | $6.06B | +42.2% | 45.4% | 13.5% | 12.60 | $2.92B | $2.62B | $2.63B | 2025-02-21 10-K | ytd-diff |
| Q1 FY2025 2025-03-31 | $5.93B | +37.0% | 46.7% | 12.9% | 9.74 | $1.03B | $759.0M | $2.98B | 2025-05-08 10-Q | as filed |
| Q2 FY2025 2025-06-30 | $6.79B | +33.8% | 45.6% | 12.2% | 10.31 | $2.92B | $2.63B | $3.01B | 2025-08-05 10-Q | ytd-diff |
| Q3 FY2025 2025-09-30 | $7.41B | +39.5% | 43.3% | 9.8% | 8.32 | $2.96B | $2.60B | $2.58B | 2025-10-30 10-Q | ytd-diff |
| Q4 FY2025 2025-12-31 | $8.76B | +44.6% | 43.2% | 10.1% | 11.03 | $5.21B | $4.78B | $3.67B | 2026-02-25 10-K | ytd-diff |
| Q1 FY2026 2026-03-31 | $8.85B | +49.0% | 43.7% | 6.9% | 8.23 | $2.08B | $1.80B | $3.68B | 2026-05-08 10-Q | as filed |
| Q2 FY2026 2026-06-30 | $10.17B | +49.8% | 40.9% | 6.7% | 9.19 | $3.66B | $3.22B | $3.65B | 2026-08-06 10-Q | ytd-diff |
| Q3 FY2026 2026-09-30 | $10.75B | +45.1% | 40.8% | 6.3% | 8.83 | $2.95B | $2.45B | $4.16B | 2026-11-05 10-Q | ytd-diff |
Source: SEC EDGAR XBRL companyfacts, fetched 9 Nov 2026, 07:26 UTC. 10-Qs report cash flow year-to-date, so quarterly cash figures are differences of consecutive YTD values (ytd-diff); fourth quarters are the 10-K figure minus the first three quarters (fy-minus-3q). Nothing is estimated.
8 prints against consensus
| Report date | Period | EPS actual (Street basis)Consensus and the actual FMP reports against it are on the Street (adjusted) basis analysts forecast, not GAAP. The EPS (GAAP, diluted) in the statement tables is the filed figure; the two can differ by stock-based compensation, amortisation and one-offs. | Consensus (Street basis)Consensus and the actual FMP reports against it are on the Street (adjusted) basis analysts forecast, not GAAP. The EPS (GAAP, diluted) in the statement tables is the filed figure; the two can differ by stock-based compensation, amortisation and one-offs. | EPS surprise | Revenue actual | Revenue consensus | Revenue surprise | Grade | Reaction |
|---|---|---|---|---|---|---|---|---|---|
| 2026-11-04 | 2026-09-30 | 8.83 | 9.27 | −4.7% | $10.75B | $10.69B | +0.6% | FHow the print compared with consensus: A both beat by ≥ 2% · B both beat · C mixed or in line · D one clear miss · F both miss or any ≤ −3%. REITs are graded on revenue only. | −12.0% |
| 2026-08-05 | 2026-06-30 | 9.19 | 8.65 | +6.2% | $10.20B | $9.79B | +4.1% | AHow the print compared with consensus: A both beat by ≥ 2% · B both beat · C mixed or in line · D one clear miss · F both miss or any ≤ −3%. REITs are graded on revenue only. | −4.8% |
| 2026-05-07 | 2026-03-31 | 8.23 | 8.75 | −5.9% | $8.85B | $8.29B | +6.7% | FHow the print compared with consensus: A both beat by ≥ 2% · B both beat · C mixed or in line · D one clear miss · F both miss or any ≤ −3%. REITs are graded on revenue only. | −12.7% |
| 2026-02-24 | 2025-12-31 | 11.03 | 11.45 | −3.7% | $8.76B | $8.45B | +3.7% | FHow the print compared with consensus: A both beat by ≥ 2% · B both beat · C mixed or in line · D one clear miss · F both miss or any ≤ −3%. REITs are graded on revenue only. | −8.1% |
| 2025-10-29 | 2025-09-30 | 8.32 | 9.12 | −8.8% | $7.41B | $7.22B | +2.7% | FHow the print compared with consensus: A both beat by ≥ 2% · B both beat · C mixed or in line · D one clear miss · F both miss or any ≤ −3%. REITs are graded on revenue only. | +2.8% |
| 2025-08-04 | 2025-06-30 | 10.31 | 11.93 | −13.6% | $6.79B | $6.67B | +1.7% | FHow the print compared with consensus: A both beat by ≥ 2% · B both beat · C mixed or in line · D one clear miss · F both miss or any ≤ −3%. REITs are graded on revenue only. | +0.5% |
| 2025-05-07 | 2025-03-31 | 9.74 | 8.27 | +17.8% | $5.93B | $5.49B | +8.2% | AHow the print compared with consensus: A both beat by ≥ 2% · B both beat · C mixed or in line · D one clear miss · F both miss or any ≤ −3%. REITs are graded on revenue only. | +6.5% |
| 2025-02-20 | 2024-12-31 | 12.61 | 10.21 | +23.5% | $6.06B | $5.82B | +4.1% | AHow the print compared with consensus: A both beat by ≥ 2% · B both beat · C mixed or in line · D one clear miss · F both miss or any ≤ −3%. REITs are graded on revenue only. | +7.1% |
Source: FMP historical earnings calendar and daily closes, pulled 10 Nov 2026, 08:05 UTC (internal licence; only derived figures are shown). Surprise = (actual − consensus) ÷ |consensus|. Grade: A both beat ≥ 2% · B both beat · C mixed or in line · D one clear miss · F both miss or any ≤ −3%. Reaction = close-to-close move around the print (report-day close to next close for after-close prints; prior close to report-day close for pre-open prints).
Scorecard pillars
| Pillar | Score (0–100) |
|---|---|
| Quality | 51.7 |
| Growth | 100.0 |
| Value | 81.5 |
| Shareholder | 33.3 |
| Health | 52.0 |
| Moat | 58.3 |
| Fundamental composite | 65.2 |
| Technical | 8.1 |
| Total | 48.1 (0.70 x fundamental 65.2 + 0.30 x technical 8.1) |
| Tier · trend state · scorecard letter | Tier 4Composite bands: Tier 1 ≥ 80, Tier 2 70–79, Tier 3 60–69. A tier describes the score, not a recommendation. DRIFTINGWhere the price sits against its own moving averages and recent highs: UPTREND, PULLBACK, RECOVERING, DRIFTING, MIXED, STAGNANT or DOWNTREND. A description of levels, not a forecast. scorecard letter C- |
| Quality-control gateA 13-criterion quality checklist on the filed figures (margins, returns, cash conversion, leverage, dilution and the like), shown as passed/13 with the failed criteria named. A description of the record, not a recommendation. | NOT QUALIFIED · 6/10 criteria · failed: Gross margin, Net margin, Diluted EPS 5Y CAGR, ROIC 5Y avg |
| MoatA heuristic reading of durable advantage from the filed figures (returns, margins, their stability), rated Wide, Narrow or None, with its direction. | Narrow · Stable · score 58.3 |
Source: Altamira KPI scorecard, edition 9 Nov 2026 (generated 9 Nov 2026, 14:40 UTC, prices as of 6 Nov 2026); fundamentals FMP, closes Massive. Pillars are sector-aware 0–100 scores; the full universe is on the scorecard page. Scores describe the business and the tape as of the edition date; they are not recommendations.
Tracked KPIs — what each print has to prove
NOT STATED — no tracked KPIs declared for MELI yet. When a preview names what the print has to prove, the series appears here.
Verdict timeline
| Date | Kind | Verdict | Superseded | Source note |
|---|---|---|---|---|
| 2026-10-13 | Bear-case severity | MEDIUM | current | Trade analysis 2026-10-13 |
| 2026-10-13 | Trade call | NO-GO | current | Trade analysis 2026-10-13 |
Source: Altamira belief ledger (derived nightly from the research vault; pointers, not evidence), file dated 9 Nov 2026, 02:00. Trade calls are the routine's GO / CONDITIONAL / NO-GO on structured setups; thesis status is the weekly review's Intact / Drifting / At-risk / No-thesis; bear-case severity is the reviewer's HIGH / MEDIUM. Record of what was said when — not a recommendation.
Altamira on MELI
No published note on MELI yet. Previews land two sessions before a print, recaps the morning after.
Research for information only — not investment advice; see Disclosures. Statements are SEC EDGAR XBRL facts as first filed (public domain); surprise, reaction and scorecard figures are Altamira derivations from licensed data and are shown as derived values only.