The shoe company the market stopped believing in — at exactly the wrong moment
Every portfolio has a product so ordinary it hides in plain sight. This month it is on your feet.

ALTAMIRA CAPITAL — STOCK OF THE MONTH
Stock of the Month · November 2026 · Deckers Outdoor Corporation (NYSE: DECK) — HOKA and UGG · Prices as of the November 4, 2026 close · Pilot edition
Every portfolio has a product so ordinary it hides in plain sight. This month it is on your feet. Deckers makes two of the most visible shoes in America — HOKA's maximalist runners and UGG's boots — and over five fiscal years it compounded revenue at 16.5% a year, lifted returns on capital every single year to 32.9%, and built a net-cash balance sheet. The market's response in 2026 has been to cut the stock 27% from its high and price it at 11.2x forward earnings — the cheapest multiple ever put on this quality in our finalist set, cheaper than insurers at their cycle peak. Our analyst team's job this month was to decide whether the market knows something the filings don't. It doesn't — or at least, not yet, and the price already pays us for the risk that it might.
The company, in one page
What Deckers actually does, in plain English: it designs shoes other people manufacture, and sells heat.
Deckers Outdoor, based in Goleta, California, owns two premium footwear brands. HOKA — chunky, maximal-cushion running shoes — is the growth engine, riding the running boom from races into everyday wear. UGG is the cash cow: a two-decade-old comfort brand that keeps reinventing itself into new categories. Sales run through wholesale partners and a growing direct-to-consumer channel. The model is asset-light to an extreme: capital expenditure runs around $85M a year on $5.5B of sales, there is no dividend, and every spare dollar goes to buybacks — $1.08B of them in fiscal 2026 alone. The fair-value analyst of record rates the moat narrow and capital allocation exemplary; we agree with both, and the narrowness of that moat is priced honestly in our bear case below.
The industry, briefly — and the peers
Why footwear economics reward brands and punish everyone else.
Performance footwear is a brand business wearing a manufacturing costume. The value sits in design, athlete credibility and the spec moment — the runner who asks for HOKA by name — while production is outsourced and replicable. That is why the winners earn 30%+ returns on capital with almost no plant, and why the losers' margins evaporate: there is no patent on a foam midsole, only on the desire for it. Nike remains the scale incumbent fighting its own reset; On Holding is the premium Swiss challenger compounding faster from a smaller base; Brooks owns the speciality-run niche. Deckers' position — number-two heat brand in running, plus a comfort franchise with twenty years of staying power — is genuinely scarce. It is also genuinely perishable, which is what the next sections are for.
The Long View
Four numbers decide whether a company deserves a five-year thesis: growth, margin, cash, and what it earns on its capital.
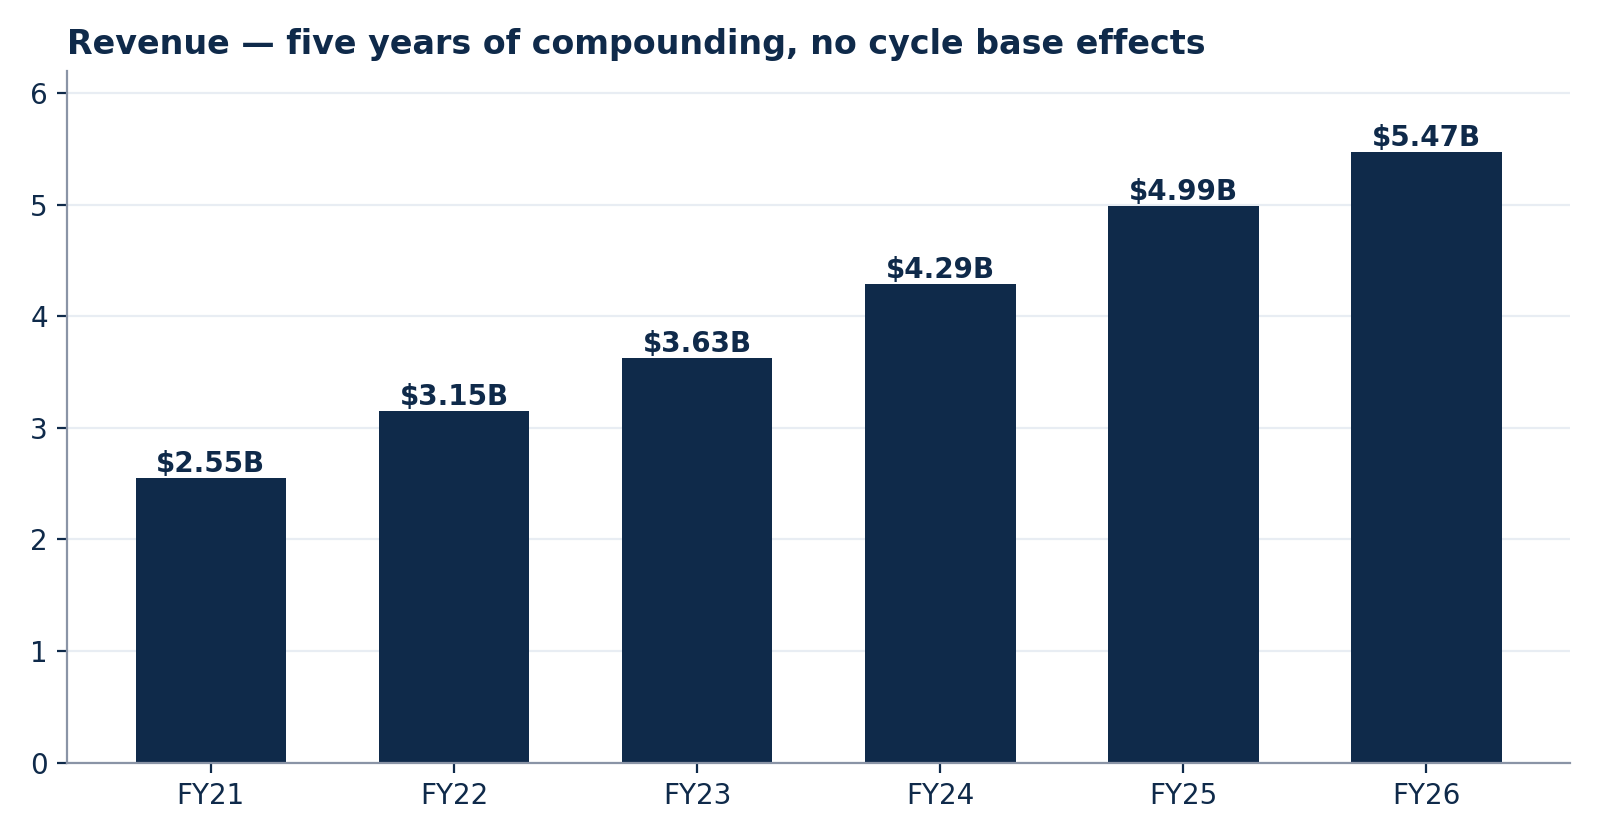
Revenue growth. Revenue rose from $2.55B in fiscal 2021 to $5.47B in fiscal 2026 — a 16.5% five-year CAGR, 14.7% over three years, 13.0% over two. Read the shape, not just the size: this is a gentle deceleration from hyper-growth, not a stall, and unlike several of this month's finalists there are no COVID or cycle base effects flattering the line — every year in the window is a real year.
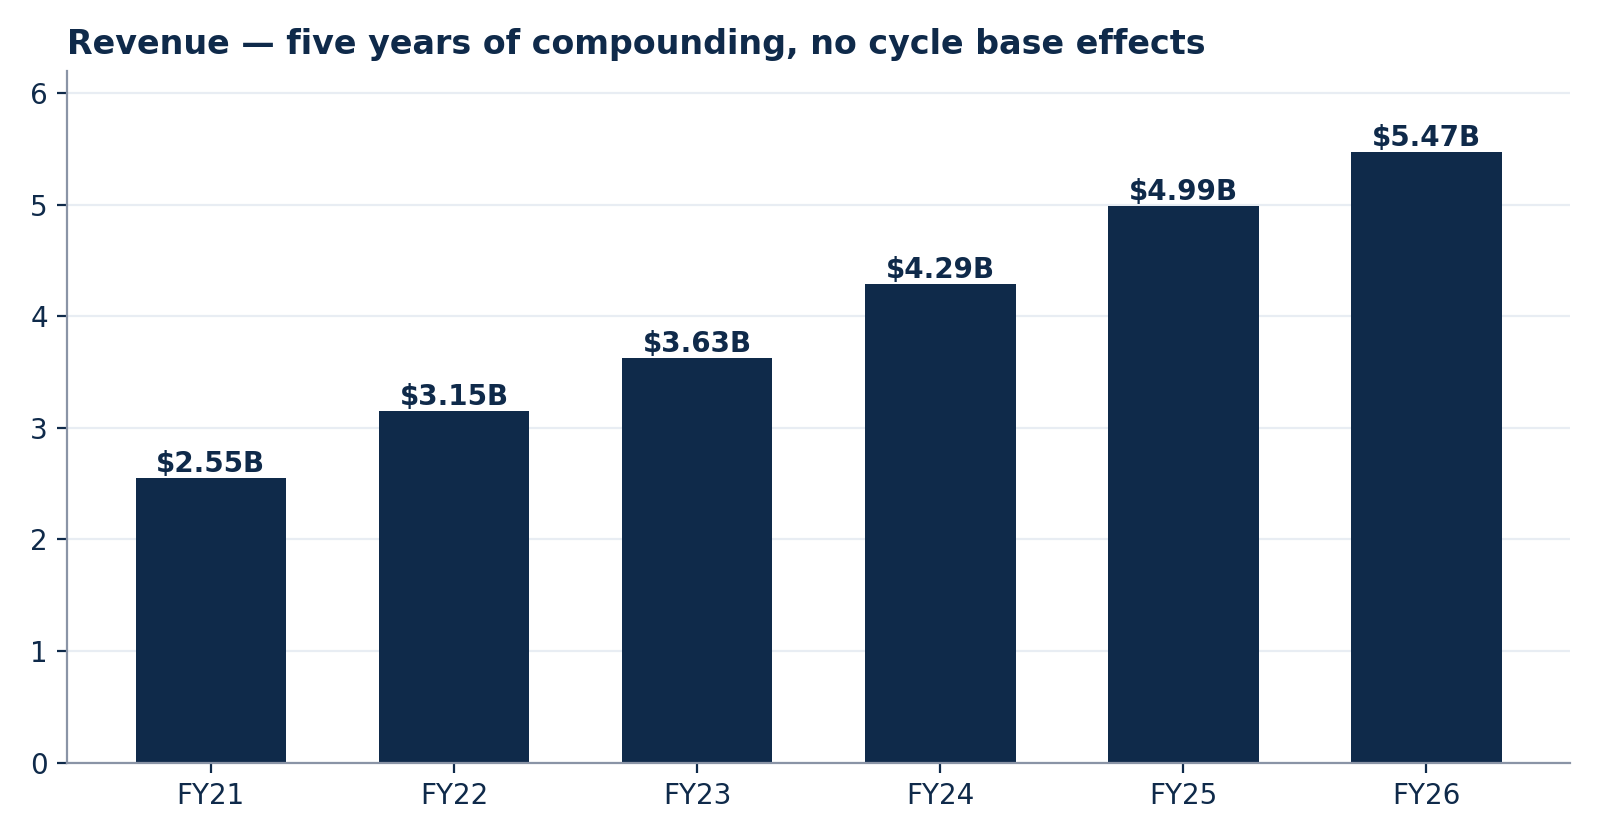
Revenue by fiscal year (FYE March). Source: FMP — company filings (GAAP).
Margins. Gross margin troughed at 50.3% in fiscal 2023 — the inventory mistake year — and has since recovered to 57.7%, with operating margin at 23.1%. The recovery is the pricing-power evidence: Deckers raised prices into a downturn narrative and kept them. Tariffs are the live threat to this line, and our trigger table watches it quarterly.
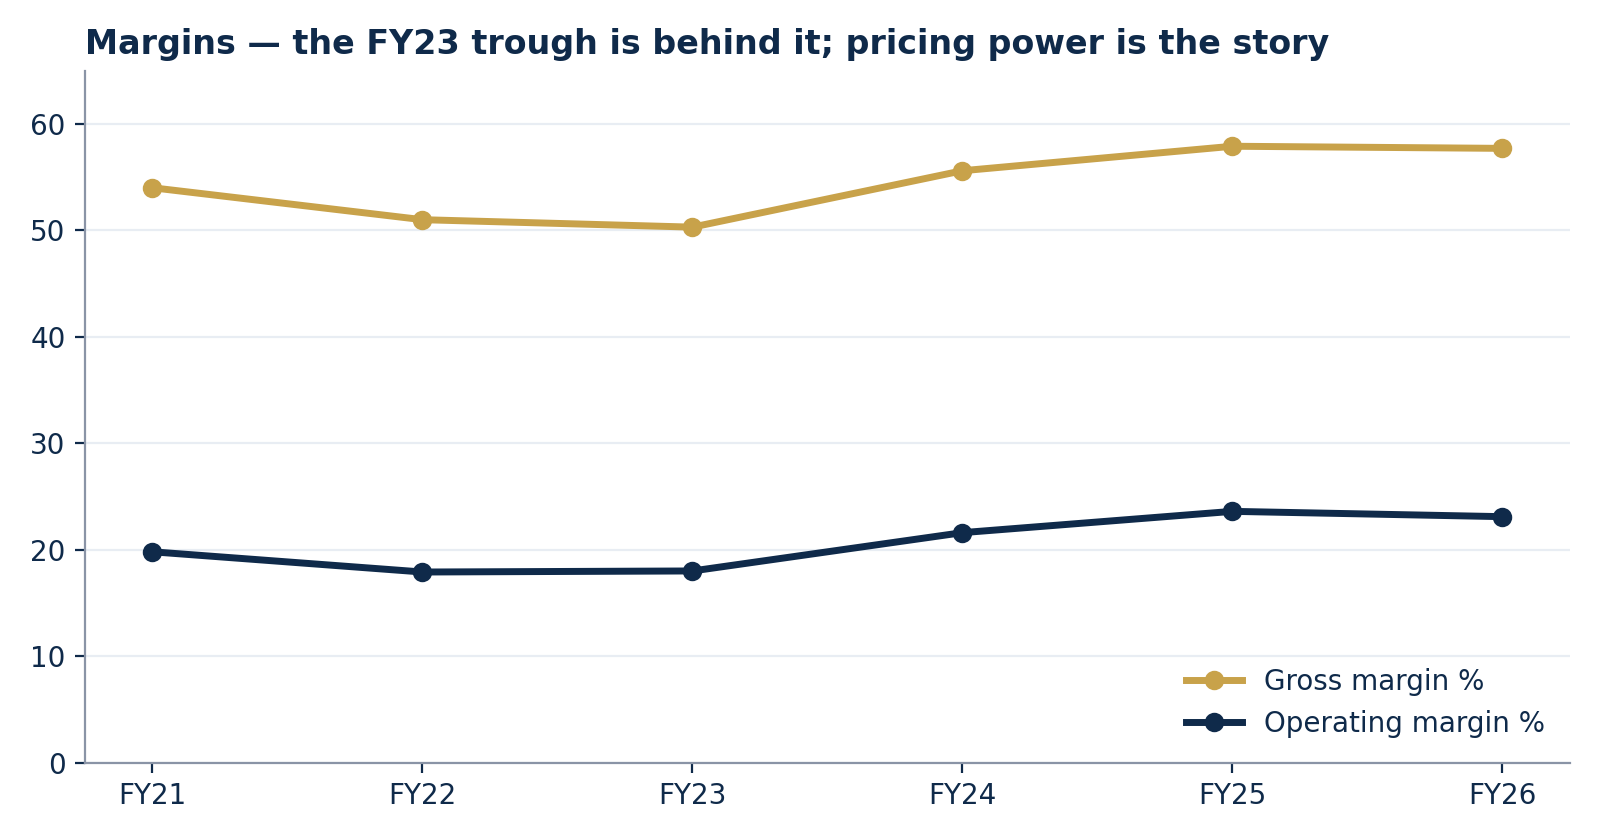
Gross and operating margin. Source: FMP — company filings (GAAP).
Cash. Free cash flow reached $1,097M in fiscal 2026 (~20% of sales), and management pointed it at the share price: buybacks stepped up from $567M to $1,079M as the stock fell. The one blemish is fiscal 2022, when FCF fell to $121M on an inventory over-build — the company's own demonstration of what its bear case looks like, and the reason our pre-mortem takes inventory seriously.
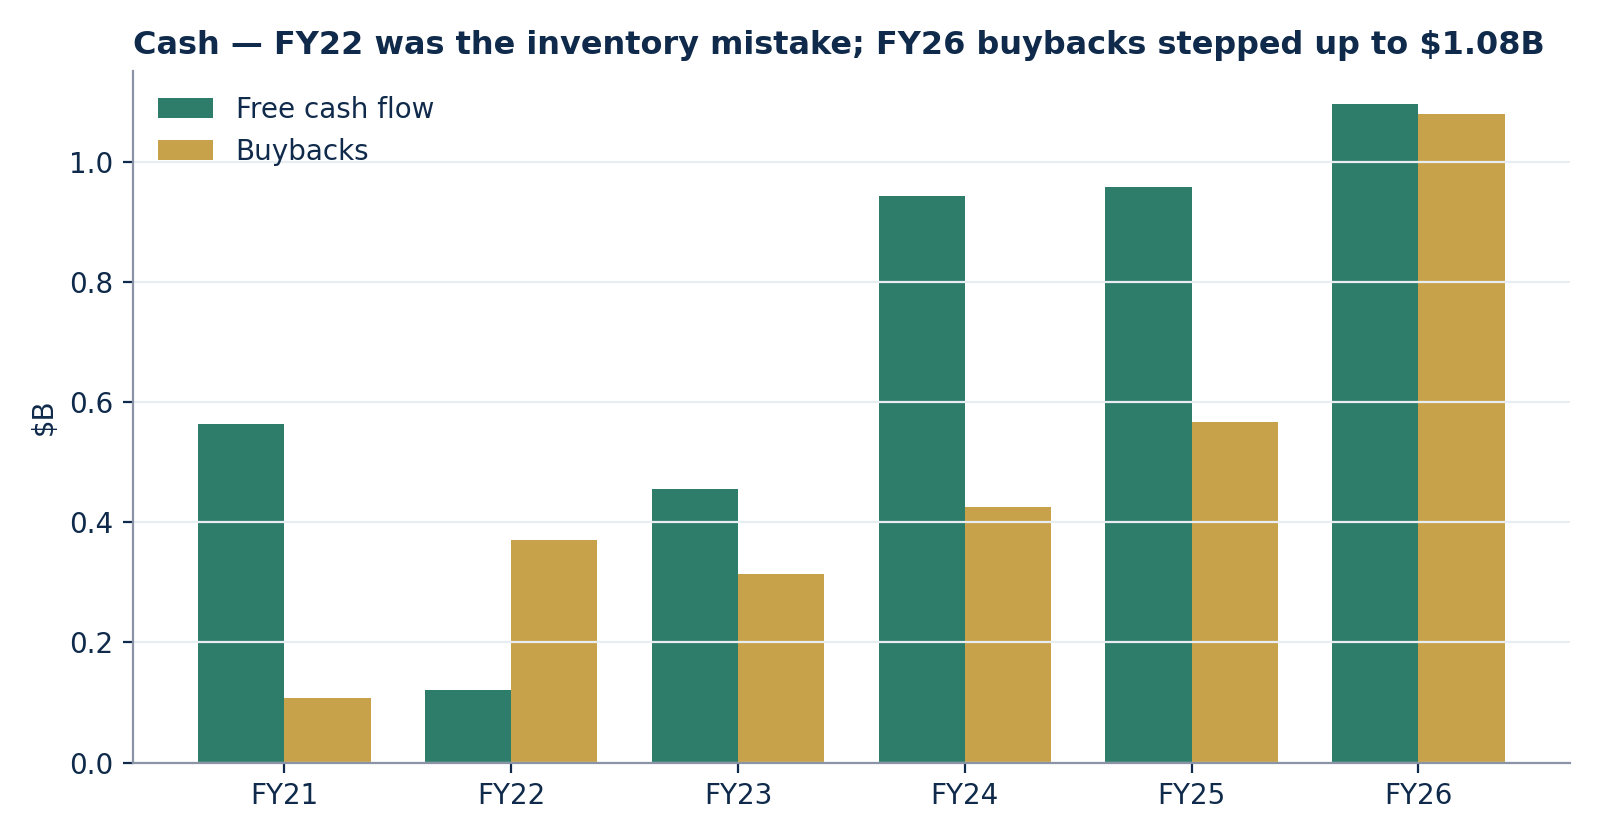
Free cash flow vs buybacks, $B. Source: FMP — company filings (GAAP).
Returns on capital. ROIC has risen from 22.0% to 32.9% in five years — the single best quality trajectory in this month's entire finalist field, large-cap and discovery lanes combined. Quality of earnings is honest, too: diluted shares fell 14.4% (170.4M → 145.8M) while GAAP EPS more than tripled ($2.25 → $7.02), so buybacks amplify a real compounding record rather than manufacturing one. The balance sheet carries $1,907M of cash against $375M of debt — net cash.
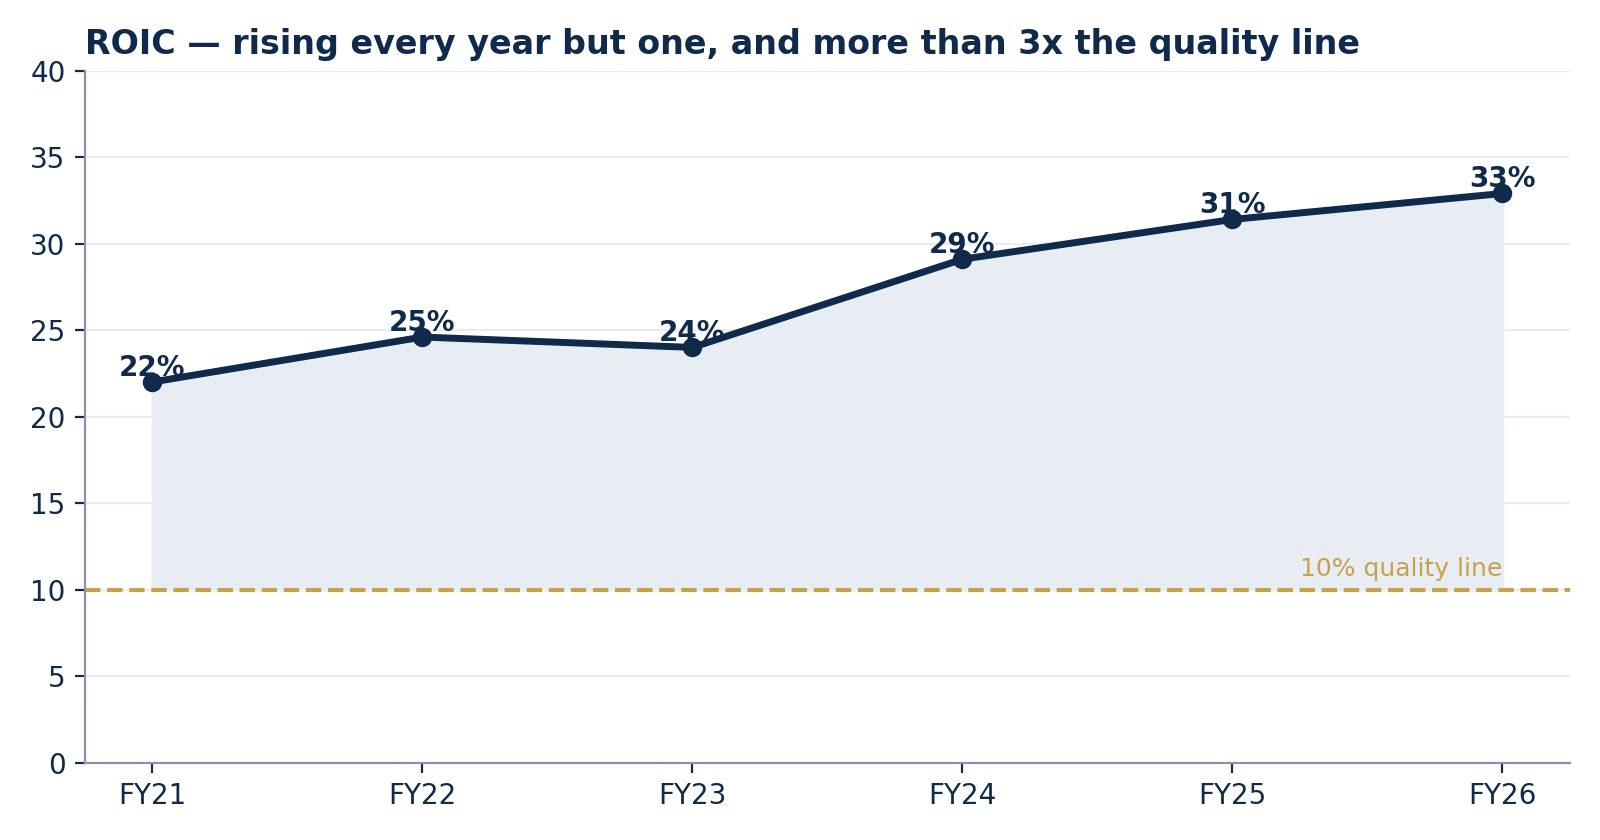
Return on invested capital. Source: FMP key metrics.
Why now — and what the Street expects
A great company at a fair price is a bond. A great company at a derated price is an opportunity.
The derating is factual: −27.1% from the 52-week high of $122.29, roughly 10% below its 200-day average, 11.2x forward earnings and an 8.8% free-cash-flow yield (External 516 KPI Scorecard, edition Nov 5, prices Nov 4 — where Deckers also posts the #1 Fundamental score, 87.3, of the entire Top 30). Fair value of record is $131 (October 23) — a 32% margin of safety at the Nov 4 close; the shares traded lower still on Nov 5 ($87.74). Consensus expects roughly 12.5% annual EPS growth (FMP estimates, reaching ~$12.64 by 2030). Our variant perception: the market is pricing HOKA as a fading fad — a low-single-digit grower inside two years — while the filed record shows a brand still compounding double digits with international and direct-to-consumer runway. We side with the record, but we do not side with consensus either: our base case deliberately assumes 10% EPS growth, below the Street's path, and the thesis still clears its hurdle. The first datapoint that resolves the argument is the holiday-quarter print (expected late January 2027): HOKA growth and the guidance that comes with it.
The bear case — written before the verdict, as always
The strongest honest argument against owning this stock.
- HOKA is a fashion-cycle asset. Brand heat fades; if growth gaps to low single digits, 11x earnings stops being cheap and becomes fair value for a no-growth shoe company. This is the whole ballgame.
- Tariffs and offshore production. Deckers manufactures abroad; sustained tariff costs attack the 57.7% gross margin the thesis leans on, and fiscal 2022–23 proved the margin can give back 400+ points in a bad year.
- The tape is broken. The KPI engine flags the stock DRIFTING with a weak technical template. Markets sometimes know first: the deceleration (16.5% → 13.0%) may have further to run than our base case assumes.
Pre-mortem — it is 2028 and the position failed. What happened? (1) HOKA heat faded — earliest warning: HOKA growth under +5% year-on-year, or wholesale partners cutting door counts. (2) Tariffs ate the margin — warning: a gross-margin print down more than 200 points year-on-year. (3) The fiscal-2022 inventory mistake repeated — warning: inventories growing faster than revenue for two consecutive quarters, the exact signature that preceded the FCF collapse to $121M.
The five-year thesis
What has to go right is modest. That is the point.
Following the discipline of the format: the base case needs no heroics — HOKA and UGG keep taking modest share, pricing holds, direct-to-consumer mix lifts margins a little, and buybacks shrink the share count roughly 3% a year. Emerging avenues — HOKA's international expansion, apparel adjacency, UGG category extensions — are treated strictly as bull-case upside, never as base-case fuel.
| Scenario | EPS CAGR | Exit EPS × multiple | Value in 5 yrs | Return/yr | Probability |
|---|---|---|---|---|---|
| Bear — fashion miss | 3% | $8.14 × 10x | $81 | −1.8% | 25% — two-brand concentration is a real fragility |
| Base — durable compounder | 10% | $11.31 × 13x | $147 | +10.5% | 50% — set below the Street's ~12.5% path on purpose |
| Bull — HOKA goes global | 13% | $12.93 × 16x | $207 | +18.4% | 25% — international + DTC mix do the work |
Probability-weighted value ≈ $146, or +10.3%/yr — above the 10% hurdle this product requires, with the bear case costing less than 2% a year rather than impairing capital. No dividend: returns are price and buyback only.
One quiet accelerant deserves its own line: at the current price, fiscal 2026's $1,079M buyback equals roughly 8% of the entire market capitalisation, and it retired 4.5% of the share count in a single year (152.7M → 145.8M diluted shares). Buybacks at a derated price are worth more per dollar than buybacks at a peak — every share retired at $89 against $131 of fair value transfers value to the holders who remain. Management stepping the programme up into weakness, rather than into strength, is the capital-allocation behaviour the "exemplary" rating describes — and it is verified in the filed cash-flow statement, not in a press release.
Appendix — how the pick was made
The screen, the gates, and the names that lost — so the pick can be audited, not just believed.
Lane A (External 516 KPI Scorecard, edition 2026-11-05, prices Nov 4): six names passed all ten quality/growth/value gates. Lane B (discovery sweep of 357 U.S. names outside the 516, $2–30B): two credible all-gate finalists. AWI was judged separately, on its merits, as the incumbent benchmark. Runners-up, and the one reason each lost: Booking Holdings — chased a +9.8% earnings-day spike; buyback-manufactured EPS over negative book equity. Arch Capital — at its 52-week high with RSI 73: full price for hard-market peak earnings. Chubb — the fortress is fully priced; ~9% book compounding already in the price. Regeneron — the only finalist whose quality is collapsing (ROIC 34.9% → 8.5%, margins halved). Progressive — consensus itself forecasts EPS falling from the 2026 peak; we would be buying the top of the cycle. ResMed — the cleanest earnings in the field, but 19.2x for decelerating growth pencils to +7.2%/yr, under the hurdle. Kinsale (Lane B) — ties the base case; loses the head-to-head above. Paycom (Lane B) — gate-pure, but ~+8.9%/yr at $250 is under the hurdle. Armstrong World Industries — a quality story (ROIC 7% → 20% in five years) that fails the free-cash-flow-yield gate (3.2% on the last twelve months vs the 3.5% floor) and weights to ~+7.5%/yr: watchlist at $152, not this month's pick.
Evidence grades. Compounding record and balance sheet: A (filed GAAP). Pricing power: A− (filed margins through a downturn narrative). Fair value and moat: B (analyst estimates, Oct 23). HOKA's runway: B−/C (judgment — deliberately not load-bearing; the verdict rests on price, margin of safety and the filed record). Data gaps, printed not papered over: no consensus price target exists in our FMP data for any finalist; exact DECK earnings dates unconfirmed (see trigger note); insurer ROIC prints are distorted in both data sources and were replaced with ROE/book-value analysis for the insurance finalists, as the method requires.
Sources. External 516 KPI Scorecard, edition 2026-11-05 (prices Nov 4) — screening scores and gates. FMP — Deckers' filed annual statements FY2021–FY2026 (FYE March), cash-flow and key-metrics history, analyst estimates; candidate fundamentals for all finalists and the Lane B sweep (357 names). Fair value of record $131 with moat and capital-allocation ratings — analyst report dated October 23, 2026, pulled November 5, 2026. Lane A, Lane B and AWI analyst memos, Stock of the Month project files, November 2026. This is the pilot edition; it will be revisited at 6 and 12 months and scored against the S&P 500 in the December accountability review.
Research for information only — not investment advice; see Disclosures.