The KPI Gauntlet: How the Scorecard Scores a Company, Pillar by Pillar
All 515 scored companies run the same gauntlet: 31 metrics in six fundamental pillars — Quality 25%, Growth 20%, Value 20%, Shareholder Returns 15%, Health 10%, Moat 10% — blended 70/30 with a technical pillar into one total, four hard tiers, and a 13-criterion QC gate that is allowed to disagree.

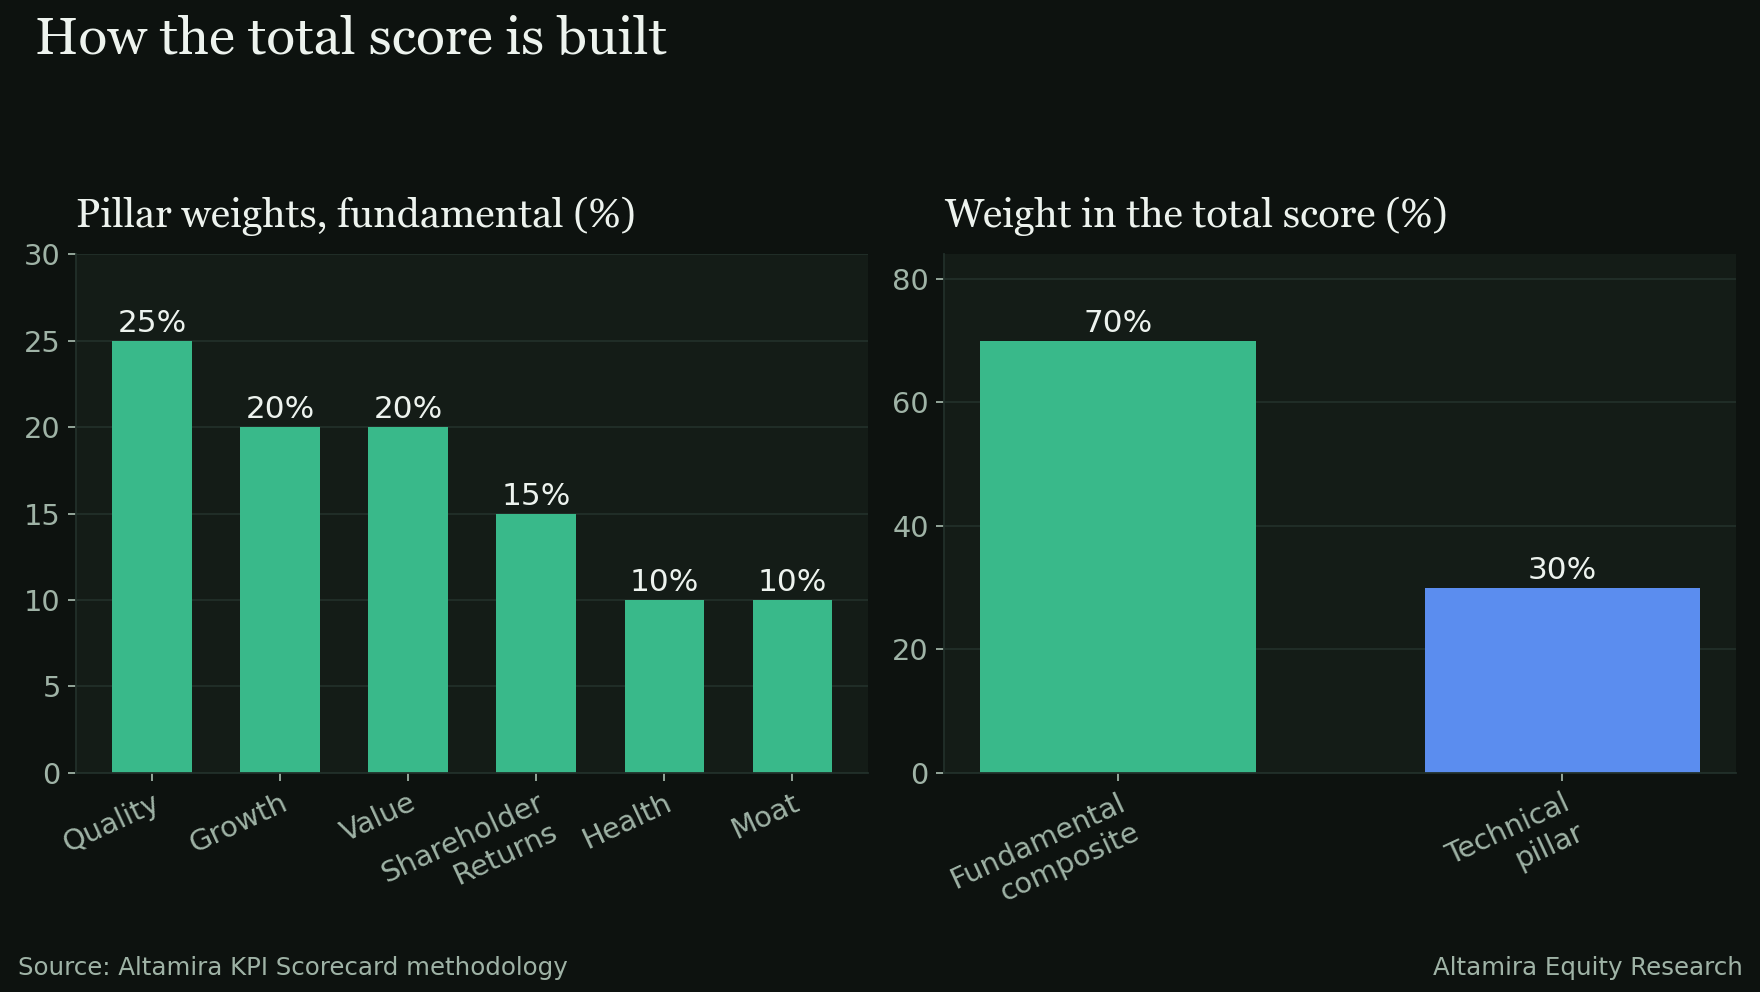
Every company on this site — 515 scored names drawn from the S&P 500, the Nasdaq 100 and the Dow 30 — is run through the same gauntlet: 31 metrics, grouped into six fundamental pillars, blended with a technical pillar into a single total score out of 100. This article explains exactly how that number is built, so any score on the site can be taken apart and checked.
The shape of the score
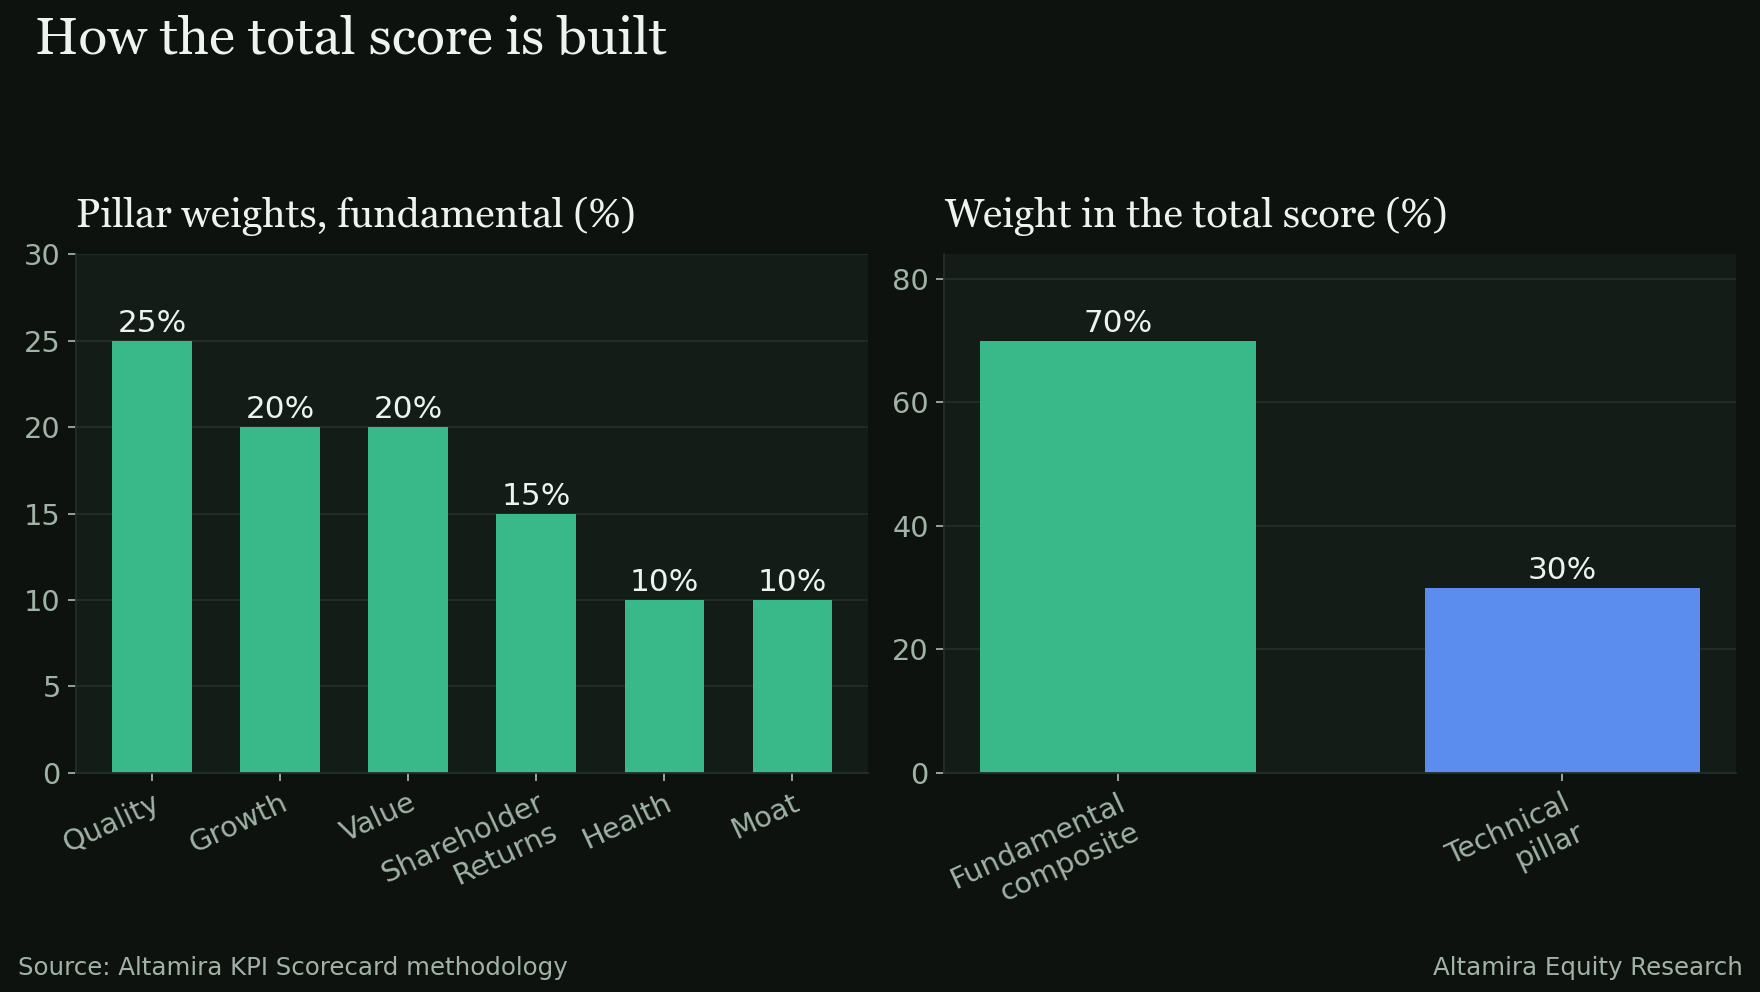
The total has two halves. The fundamental composite carries 70% of the weight and is built from six pillars. The technical pillar — what the share price itself has been doing — carries the remaining 30%.
Each metric is first scored on a linear 0–100 scale between a published floor and ceiling: a five-year average return on invested capital of 0% scores 0 and 30% scores 100, for example, with everything between interpolated. A pillar score is the weighted average of its metrics, and the fundamental composite is the weighted average of the six pillars. Nothing in the chain is a black box: every input, weight and threshold is listed in the scorecard's methodology, and the per-company pages show the underlying cells.
The six pillars
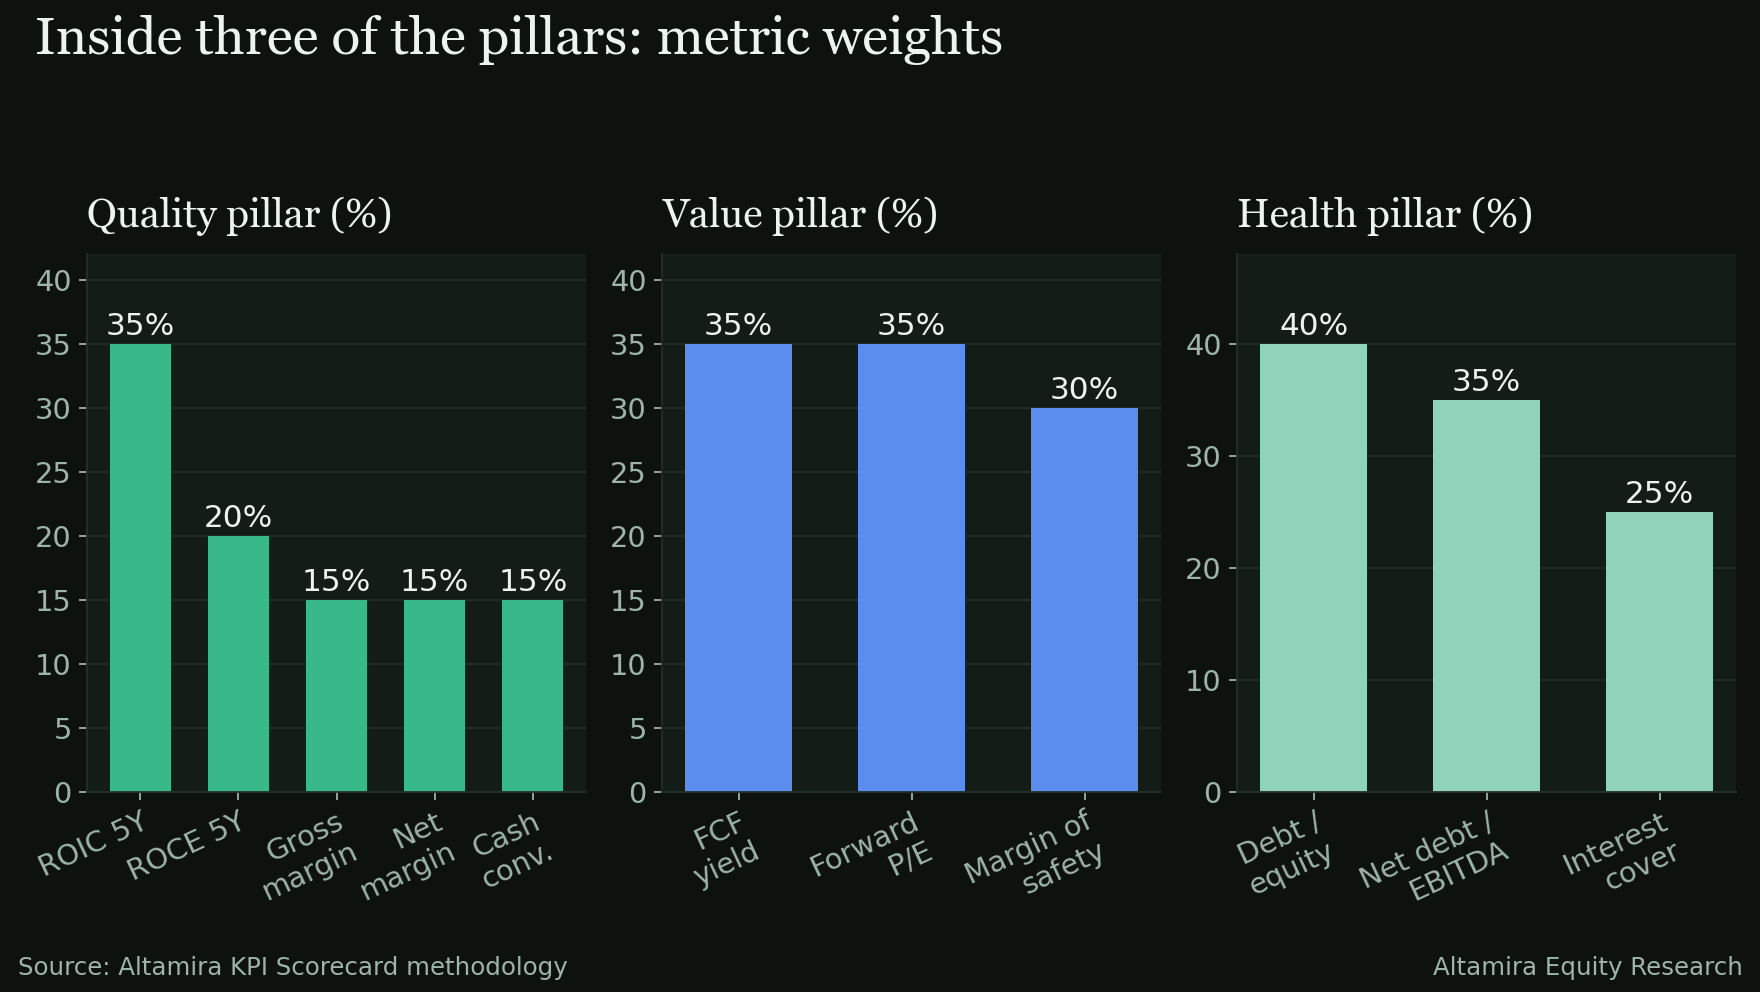
Quality (25% of the fundamental composite) asks whether the business earns high returns on the capital entrusted to it — and whether the accounting profit is real cash. Its heaviest metric is five-year average ROIC (35% of the pillar), followed by five-year average return on capital employed (20%), gross margin (15%), net margin (15%) and cash conversion — operating cash flow against net income, averaged over five years (15%). A company can grow quickly and still fail here; quality is deliberately the largest single block in the model.
Growth (20%) measures compounding, not one good year. Revenue growth over five and three years, free-cash-flow growth over five and three years, free-cash-flow-per-share growth over both windows, and five-year diluted EPS growth — seven metrics, each scored against demanding ceilings (a 25% five-year revenue CAGR scores 100). Per-share measures sit alongside company-level ones so that growth bought by issuing shares does not score the same as growth that accrues to each share.
Value (20%) is a three-legged stool: free-cash-flow yield (35% of the pillar), forward price-to-earnings (35%), and margin of safety — the distance between the share price and fair value (30%). Any one leg can look extreme on its own; the pillar only rewards a name when cash yield, multiple and price-versus-value point the same way.
Shareholder Returns (15%) tracks what reaches the owner: dividend yield, payout ratio (scored in reverse — a lower, safer payout scores higher), dividend-per-share growth over five and three years, and buyback yield, the net repurchase rate after issuance. A company that returns cash while diluting it away does not get credit for the gross figure.
Health (10%) is the balance-sheet check: debt-to-equity (40% of the pillar), net debt to EBITDA (35%) and interest coverage (25%). It carries the smallest weight of the fundamental pillars, but it is a veto in disguise — the model's other screens refuse to advance names whose health pillar falls below a minimum, however exciting the growth.
Moat (10%) is a single heuristic score built from return-on-capital durability, gross-margin level and stability, pricing power, capital efficiency, reinvestment and recurring revenue. It is the most judgement-laden number in the model, which is exactly why it is capped at a tenth of the composite.
From score to tier
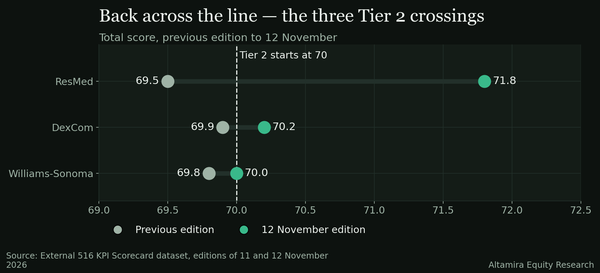
The total sorts the universe into four tiers at hard cutoffs: Tier 1 at 80 and above, Tier 2 at 70, Tier 3 at 60, Tier 4 below 60. Hard lines have hard consequences — a name at 69.9 and a name at 70.1 are nearly identical businesses with different labels — which is why the site reports the score itself, the tier changes between editions, and the names sitting within a point of a boundary. Separately, a 13-criterion quality-compounder checklist (the QC gate) renders its own verdict — QUALIFIED, NEAR-QUALIFIER, NOT QUALIFIED or INCOMPLETE — and the two systems are allowed to disagree. When they do, that disagreement is usually the story.
Sources: Altamira KPI Scorecard methodology (pillar weights, metric floors and ceilings, tier cutoffs and the QC gate definition), as published with each scorecard edition. Research for information only — not investment advice.