FICO: The Beat Was Clean — the Margin Was Not
Fair Isaac beat on both lines and grew revenue 27.40% — then printed its lowest operating margin in nine quarters, down 1,322 bp from the quarter before. The stock, already 57.93% below a year ago, barely moved. This recap reads the quarter the market read: the margin, not the beat.

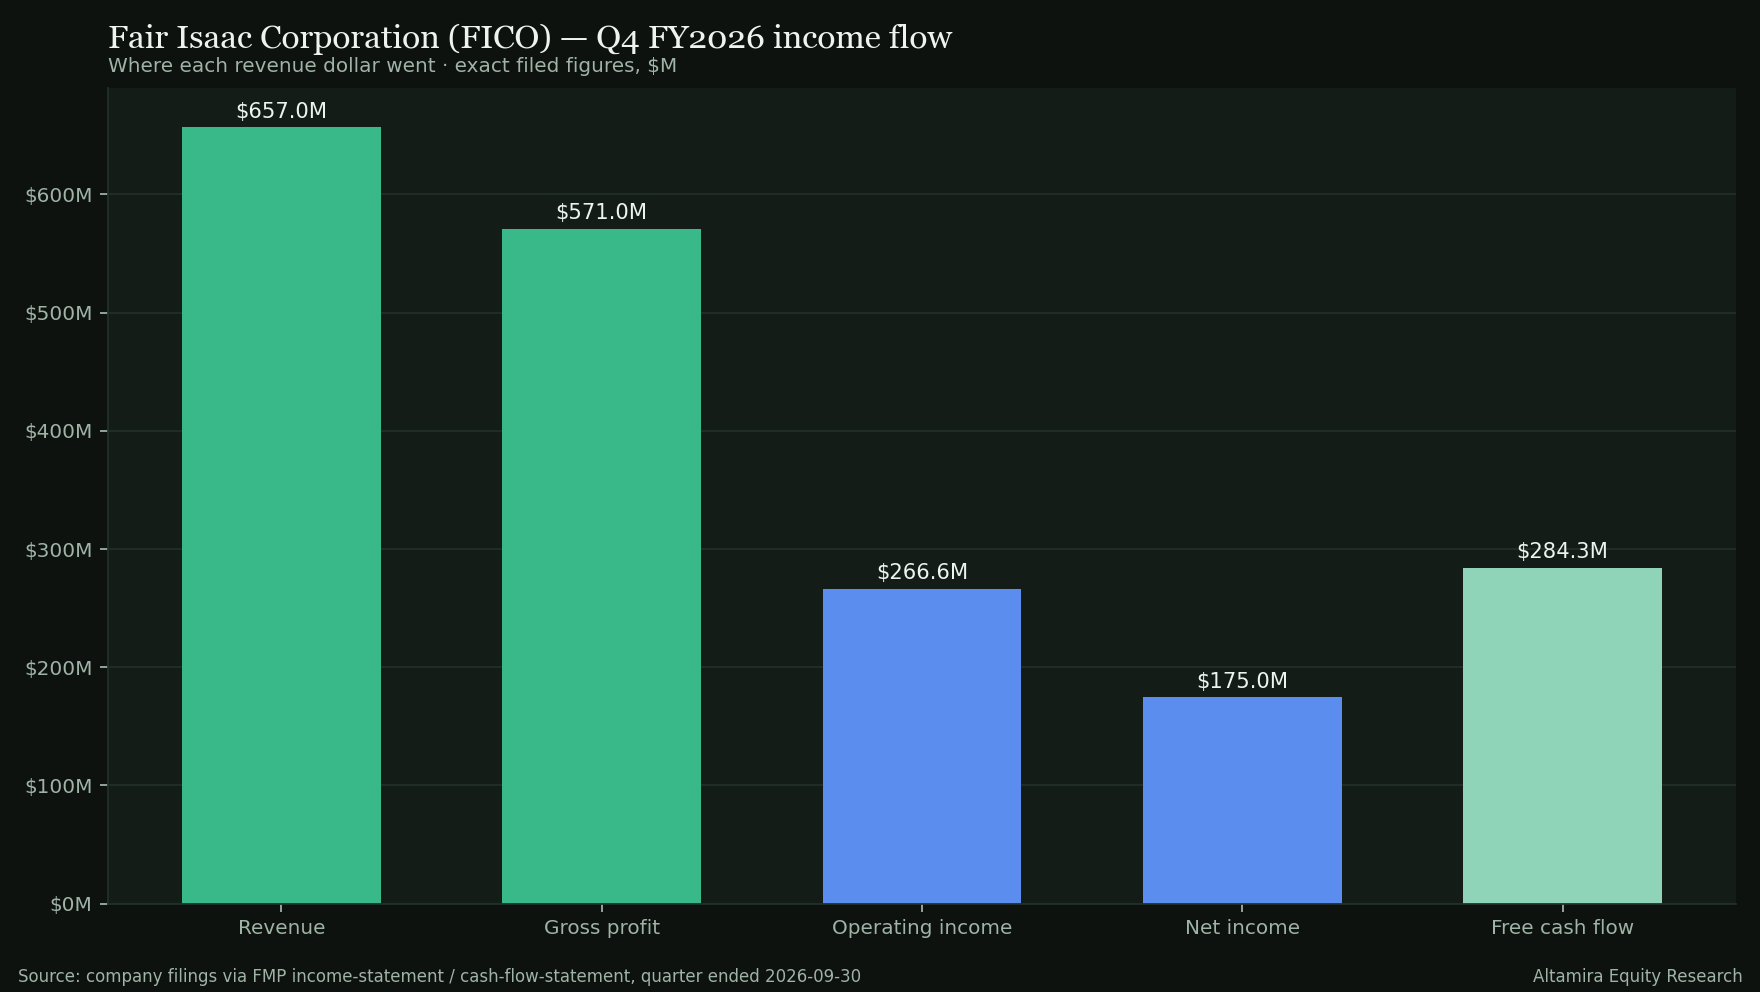
Revenue $657.0M, +0.82% vs estimate and +27.40% YoY · adjusted EPS 11.10 vs 10.69 expected (+3.84%) · operating margin 40.57%, −1,322 bp QoQ · free cash flow $284.3M, 162.51% of net income · stock +0.91% close to close, a fifth of its usual move
The story in 30 seconds
- Fair Isaac's fiscal fourth quarter cleared both bars: revenue of $657.0M beat the estimate by 0.82% and grew 27.40% year over year; adjusted EPS of 11.10 beat 10.69 by 3.84%. On the uniform scale that is a B — a beat, with one surprise under 2%.
- The quarter's real line is the margin. Operating margin fell to 40.57%, the lowest of the last nine quarters, down 1,322 bp from the 53.79% of the quarter before and 541 bp below a year ago, as operating expenses climbed to 46.34% of revenue. Revenue also slipped 2.54% sequentially, the first decline in the series.
- Cash argued the other way: free cash flow of $284.3M was 43.28% of revenue and 162.51% of net income. The market split the difference — the shares rose 0.91% close to close, a fifth of the 5.11% average move on the company's last eight prints.
A beat that moves the stock less than 1% is a beat the market had already priced, or a beat with something in it the market did not like. For Fair Isaac (FICO) it is the second. The company that scores most of the consumer credit decisions in the United States printed a quarter in which the headline lines did what they have done seven times in eight prints — beat — while the line beneath them, the operating margin, did something new.
Fair Isaac sells two things: scores, licensed to lenders and the credit bureaus with pricing power that shows in an 86.91% gross margin, and decision-management software, which carries the sales and development spend. For five fiscal years the mix has moved toward profit: operating margin expanded 1,154 bp from FY2021 to FY2026, revenue compounded at 14.00% and diluted EPS at 22.07%, and the company retired 21.44% of its diluted share count. The fourth quarter interrupted that line.
In this post: (1) the print in one picture — the flow of a revenue dollar; (2) what to make of it, including the quality-of-earnings line; (3) the long view against five years; (4) the Key Issue — the margin — and the verdict.
At a glance — Q4 FY2026
- Revenue: $657.0M vs $651.7M expected · +0.82% surprise · +27.40% YoY · −2.54% QoQ
- Adjusted EPS: 11.10 vs 10.69 expected · +3.84% surprise · GAAP diluted EPS 8.12, +26.48% YoY
- Guidance: NOT STATED — the earnings-call transcript is not in the dataset; no guidance class is assigned and none is invented here
- Reaction: +0.91% close to close, from 701.03 to 707.40 · 8-quarter average absolute move 5.11% · largest −17.01% (July 2026)
- Margins: gross 86.91% (+459 bp YoY) · operating 40.57% (−541 bp YoY, −1,322 bp QoQ) · net 26.63% (−343 bp YoY)
- Cash generation: operating cash flow $294.2M · capital expenditure $9.8M · free cash flow $284.3M · 43.28% of revenue · 162.51% of net income
- Share count: diluted shares 21,559,000 in the filed dataset, −10.77% YoY and −5.04% QoQ · buybacks and dividends not populated in the cash-flow dataset for the quarter — flagged, not estimated
- Balance sheet: cash and short-term investments $217.6M · total debt $5,277.9M · net debt $5,060.3M · shareholders' equity −$3,873.2M · net debt to EBITDA 4.01× trailing
The quarter in one line: the scores business kept pricing and the cash kept converting; the operating margin gave back a year of expansion in one quarter, and the market, up 0.91%, declined to celebrate the beat.
Q4 FY2026 flow — where the revenue dollar went
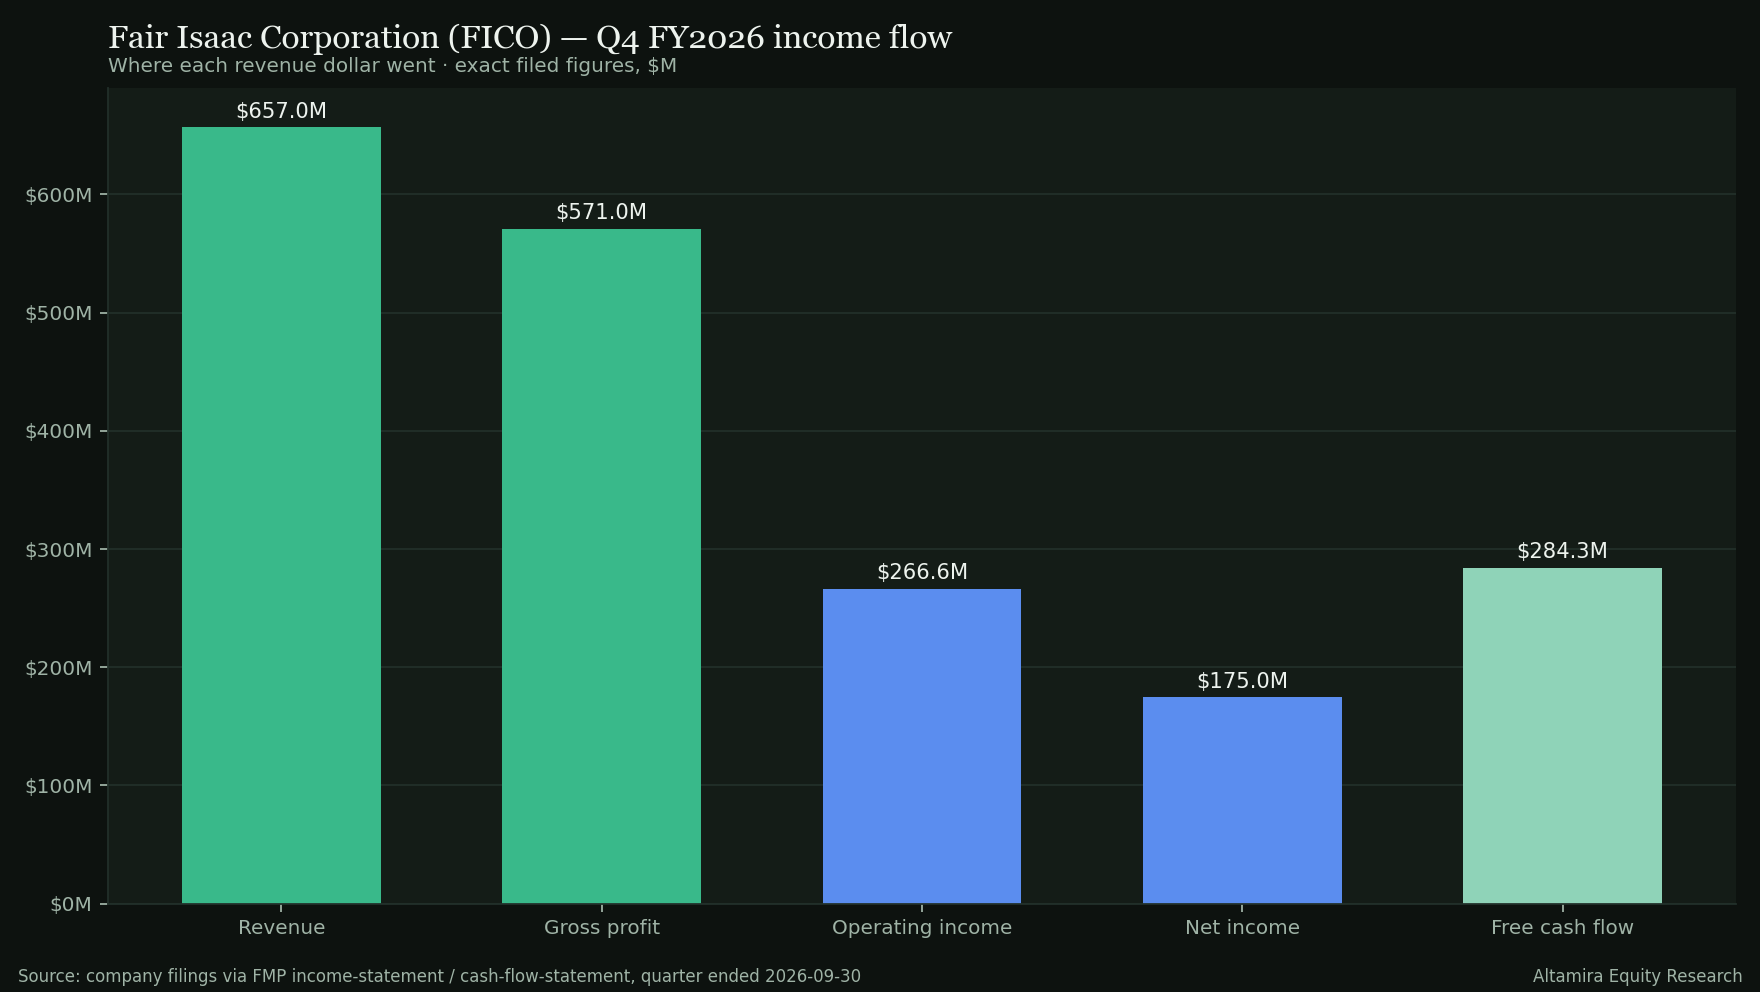
- Revenue: $657.0M (100%)
- Cost of revenue: $86.0M (13.09%)
- Gross profit: $571.0M (86.91%)
- Operating expenses: $304.5M (46.34%) — SG&A $225.4M (34.31%), R&D $51.8M (7.88%), other $27.3M (4.15%)
- Operating income: $266.6M (40.57%)
- Pre-tax income: $237.4M (36.14%)
- Income tax: $62.5M (9.51%)
- Net income: $175.0M (26.63%)
- Free cash flow: $284.3M (43.28%)
Exact filed figures. The swing item is operating expenses: at 46.34% of revenue they are the reason a quarter with an 86.91% gross margin produced a 40.57% operating margin.
What to make of this print
Six readings, each a finding plus what it means.
- The top line is intact and the comparison is honest. Revenue of $657.0M grew 27.40% on the same quarter last year ($515.8M) — the fourth consecutive quarter of growth above 16% in the series (Q1 +16.36%, Q2 +38.69%, Q3 +25.68%). The sequential decline of 2.54% from the $674.2M third quarter is the first in nine quarters and is the first thing to check against the January print.
- The margin is the story, and it is an expense story, not a pricing story. Gross margin rose 459 bp year over year to 86.91% — the scores franchise is pricing as well as it ever has. The operating margin fell anyway, to 40.57% from 53.79% a quarter earlier and 45.98% a year earlier, because operating expenses reached $304.5M, 46.34% of revenue. SG&A alone was $225.4M, 34.31% of revenue. Whether that spend is a step-up in the software go-to-market or a one-quarter item is not stated in the filed summary, and this post does not guess.
- Quality of earnings: the EPS growth is partly the share count. GAAP diluted EPS grew 26.48% year over year while net income grew 12.87%. The gap is the denominator: diluted shares in the filed dataset fell 10.77% year over year and 5.04% sequentially to 21,559,000. The buyback and dividend cells for the quarter are not populated in the cash-flow dataset, so the capital returned is flagged rather than quantified here. Readers should hold the 26.48% EPS line next to the 12.87% net-income line; the second is the operating result.
- Cash converted far above earnings. Free cash flow of $284.3M was 162.51% of GAAP net income and 43.28% of revenue, on capital expenditure of just $9.8M. For the full fiscal year free cash flow was $1.07B, a 42.21% margin, against $0.77B and 38.67% in FY2025. Whatever the operating-expense line is, it did not consume cash at the same rate it consumed margin.
- The balance sheet is the standing counterweight. Total debt of $5,277.9M against $217.6M of cash leaves net debt of $5,060.3M and shareholders' equity of −$3,873.2M — the arithmetic of a company that has borrowed to retire 21.44% of its shares over five years. Net debt is 4.01× trailing EBITDA. The scorecard's health pillar scores this at 9.4 of 100, the one weak cell in an otherwise top-decile profile. With interest expense not populated in the filed quarterly summary, the cost of that debt is a gap this post names rather than fills.
- The stock had already repriced before the print. On the November 6 close of 704.55 the shares were 14.88% below the 50-day average, 36.08% below the 200-day average of 1,102.20, 61.81% below the 52-week high of 1,844.98 and down 57.93% over twelve months — but 18.92% above the 52-week low and flat (−0.41%) over one month. The de-rating left the shares on 19.31× trailing earnings with a 6.97% free-cash-flow yield. A 0.91% reaction to a beat is what a stock that has already fallen 57.93% does.
Takeaway: a franchise quarter in which the scores engine, the growth rate and the cash all held, and the operating margin did not. The beat earned a B; the margin earns the Key Issue.
The long view — five fiscal years
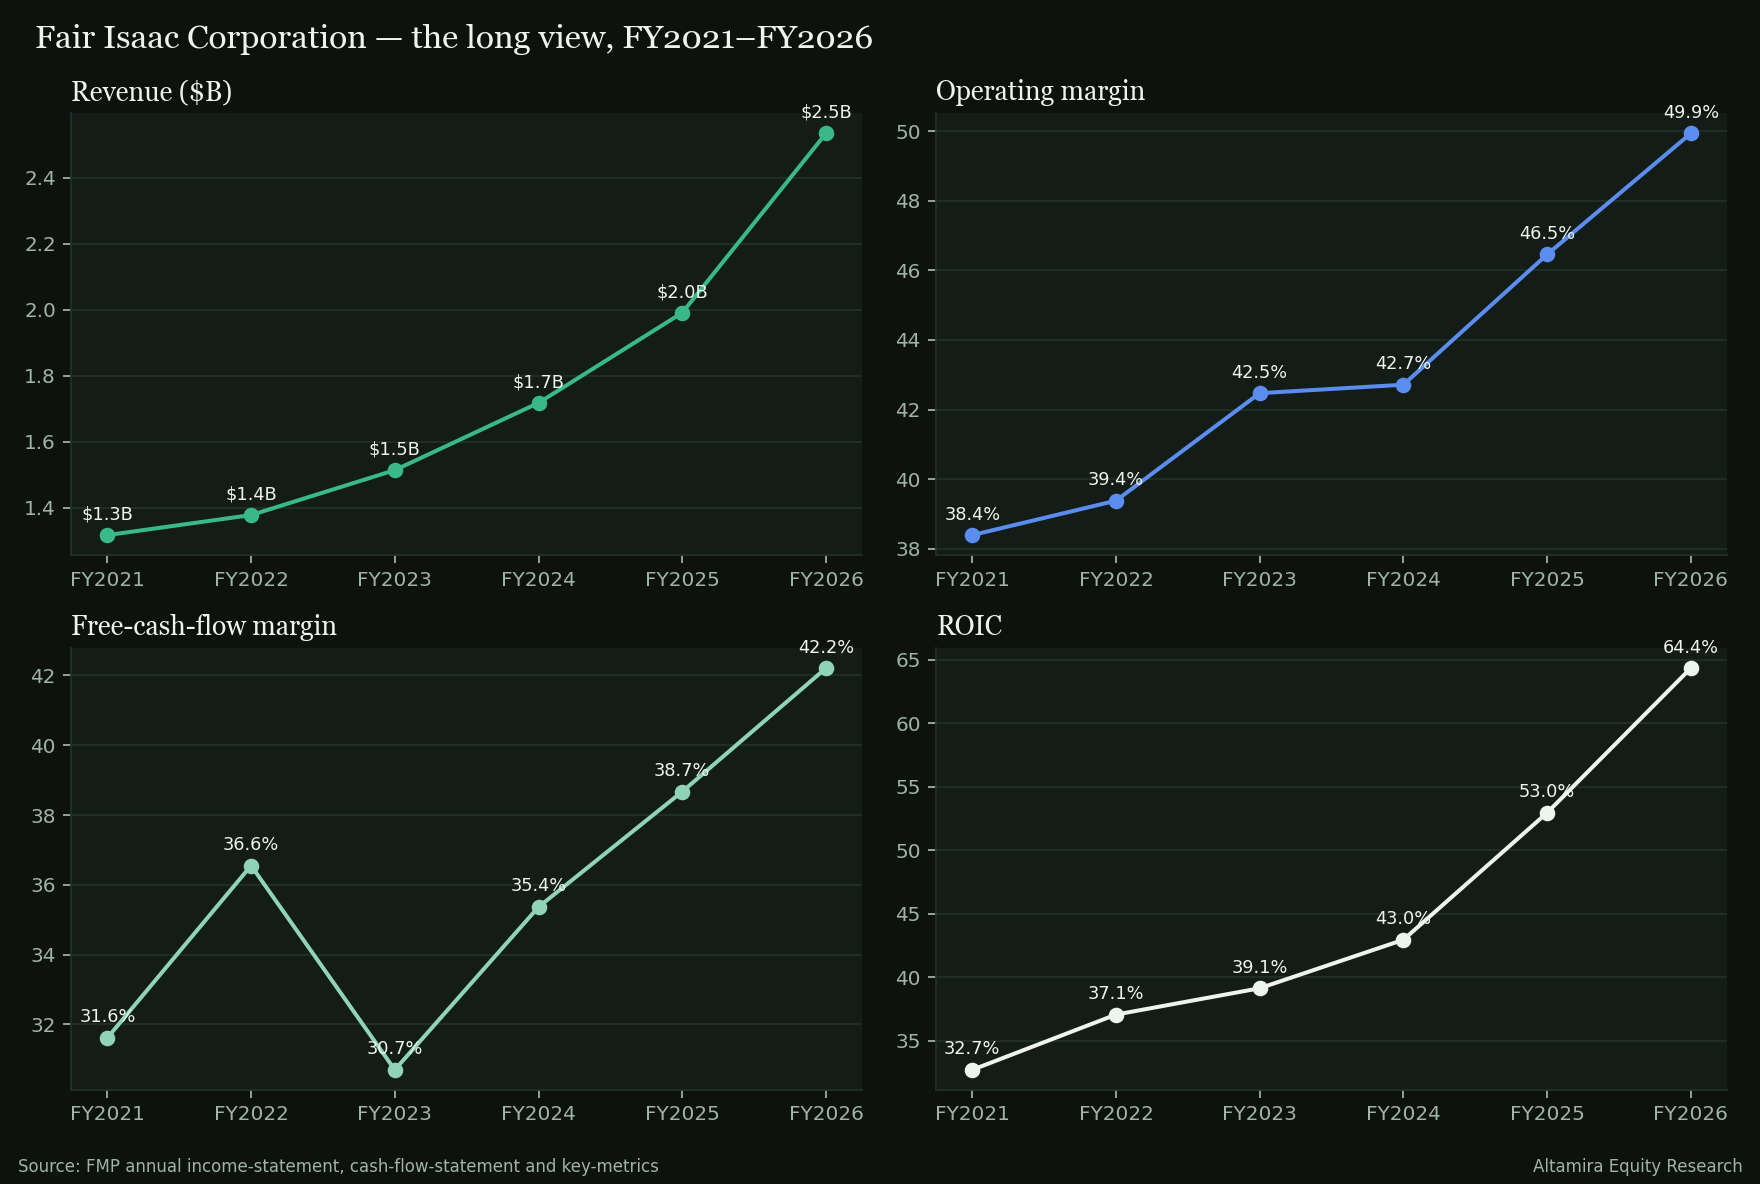
- Revenue growth. $1.32B in FY2021 to $2.53B in FY2026, a 14.00% compound rate, with the last fiscal year the fastest in the series. The top line is accelerating against its own record, not fading.
- Operating margin. 38.40% in FY2021 to 49.93% in FY2026 — 1,154 bp of expansion over five years, delivered almost every year (FY2024 42.71%, FY2025 46.45%). The fourth quarter's 40.57% sits below every full-year figure since FY2022's 39.38%. One quarter does not break a five-year line; it does put the FY2027 margin on watch.
- Cash. Free-cash-flow margin 31.62% in FY2021, 42.21% in FY2026; free cash flow compounded at 20.78%. Cash has grown faster than revenue throughout.
- ROIC. 32.71% in FY2021 to 64.35% in FY2026, the discipline metric at a level few software companies reach — a product of the scores business's capital-light economics and a shrinking equity base. The same leverage that flatters ROIC produces the 9.4 health score.
The honest counterweight
Three cells argue for patience before calling the quarter a clean pass.
- Trend state DRIFTING, technical score 10.3. The scorecard's November 7 edition has Fair Isaac at a fundamental composite of 83.4 — quality 98.8, value 96.8, shareholder 100.0, moat 84.4 — but a technical score of 10.3 and a total of 61.5, Tier 3, rank 102, verdict MONITOR. The fundamentals are top of the table; the trend is not.
- The next bar is lower. Consensus for the January quarter (fiscal Q1 FY2027) is $608.2M of revenue and EPS of 9.40 — 7.44% below this quarter's revenue, though 18.79% above the $512.0M of the same quarter last year. A second sequential decline would turn the 2.54% slip into a pattern.
- Leverage at 4.01× with negative equity. The balance sheet works while the scores franchise prices; it is the cell that would hurt first if the margin compression proves structural.
The Key Issue
Whether the 46.34% operating-expense ratio is a one-quarter item or the new cost of growing the software business. The filed summary does not say; the transcript, when it posts, will — and the January print will show it in a single cell, the operating margin, against this quarter's 40.57% and the fiscal year's 49.93%. Until then the five-year record (1,154 bp of expansion) gets the benefit of the doubt, and the quarter gets a flag.
Thesis verdict: Intact (grade B)
Revenue +27.40%, gross margin +459 bp, free cash flow at 162.51% of net income — the franchise cells all held. The operating margin's 1,322 bp sequential decline is the one line that argues otherwise, and one line is a Key Issue, not a broken thesis.
Sources
- FMP /stable/earnings (actuals vs consensus, eight quarters), /historical/earning_calendar/FICO (report timing), /historical-price-full/FICO (daily closes; moving averages, ranges and the close-to-close reaction computed from them) — pulled November 9, 2026.
- FMP /income-statement, /cash-flow-statement, /balance-sheet-statement (quarterly, nine quarters; the Q4 FY2026 statements filed November 6, 2026) and the annual statements plus /key-metrics for FY2021–FY2026 — pulled November 9, 2026.
- FMP /analyst-estimates and /key-metrics-ttm — pulled November 9, 2026.
- Altamira KPI Scorecard, edition 2026-11-07 (kpi-scorecard-2026-11-07.json): composite, pillar and technical scores, tier, trend state and verdict as published.
- Guidance, segment detail and management commentary: NOT STATED — the earnings-call transcript is not in the dataset for this edition.
Research for information only — not investment advice; see Disclosures.