Alphabet: The Engine Has Never Run Hotter — or Cost More — Q3 2026
The quarter in one line: Alphabet's operating engine posted its strongest verified quarter in this series — Search revenue +12% to $63,300M with query growth at a five-year high, and Google Cloud +103% to $30,700M at a 36.2% operating margin with a $561B backlog

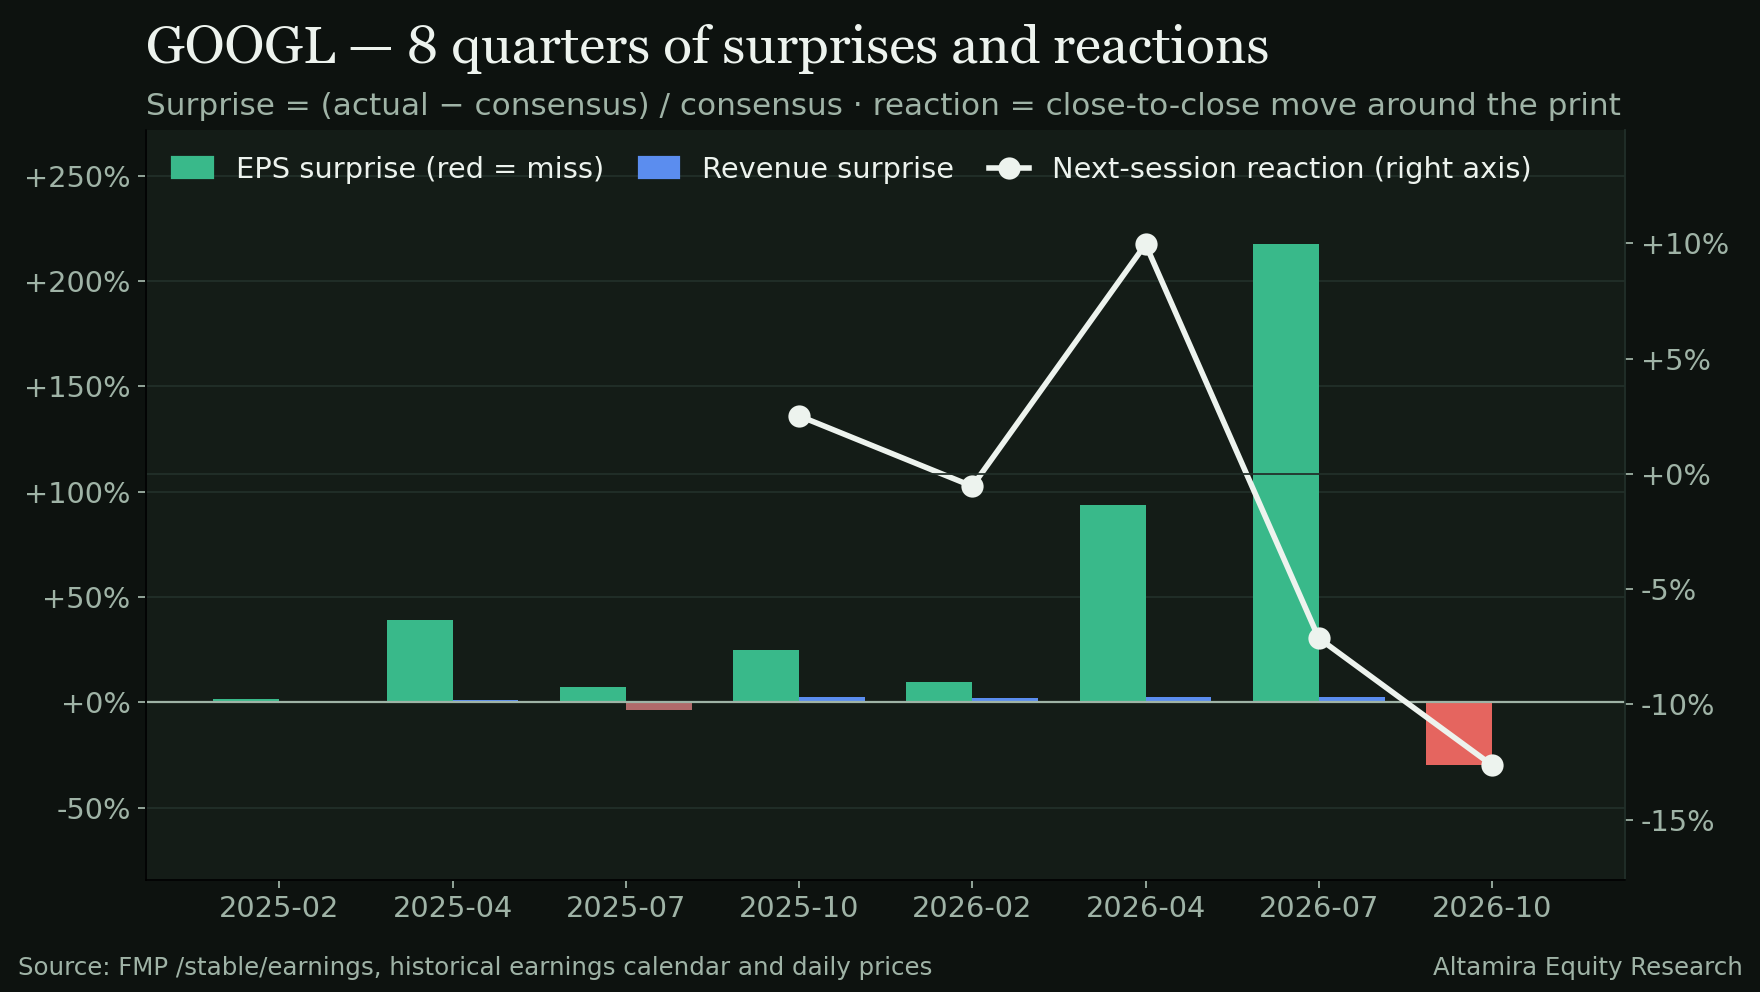
The quarter in one line: Alphabet's operating engine posted its strongest verified quarter in this series — Search revenue +12% to $63,300M with query growth at a five-year high, and Google Cloud +103% to $30,700M at a 36.2% operating margin with a $561B backlog — yet EPS missed by 29.8% on an $8.2B unrealised loss on its SpaceX investment, free cash flow was −$9,065M, no buyback ran, and the stock fell 11.5% after hours.
At a glance — Q3 2026 scoreboard
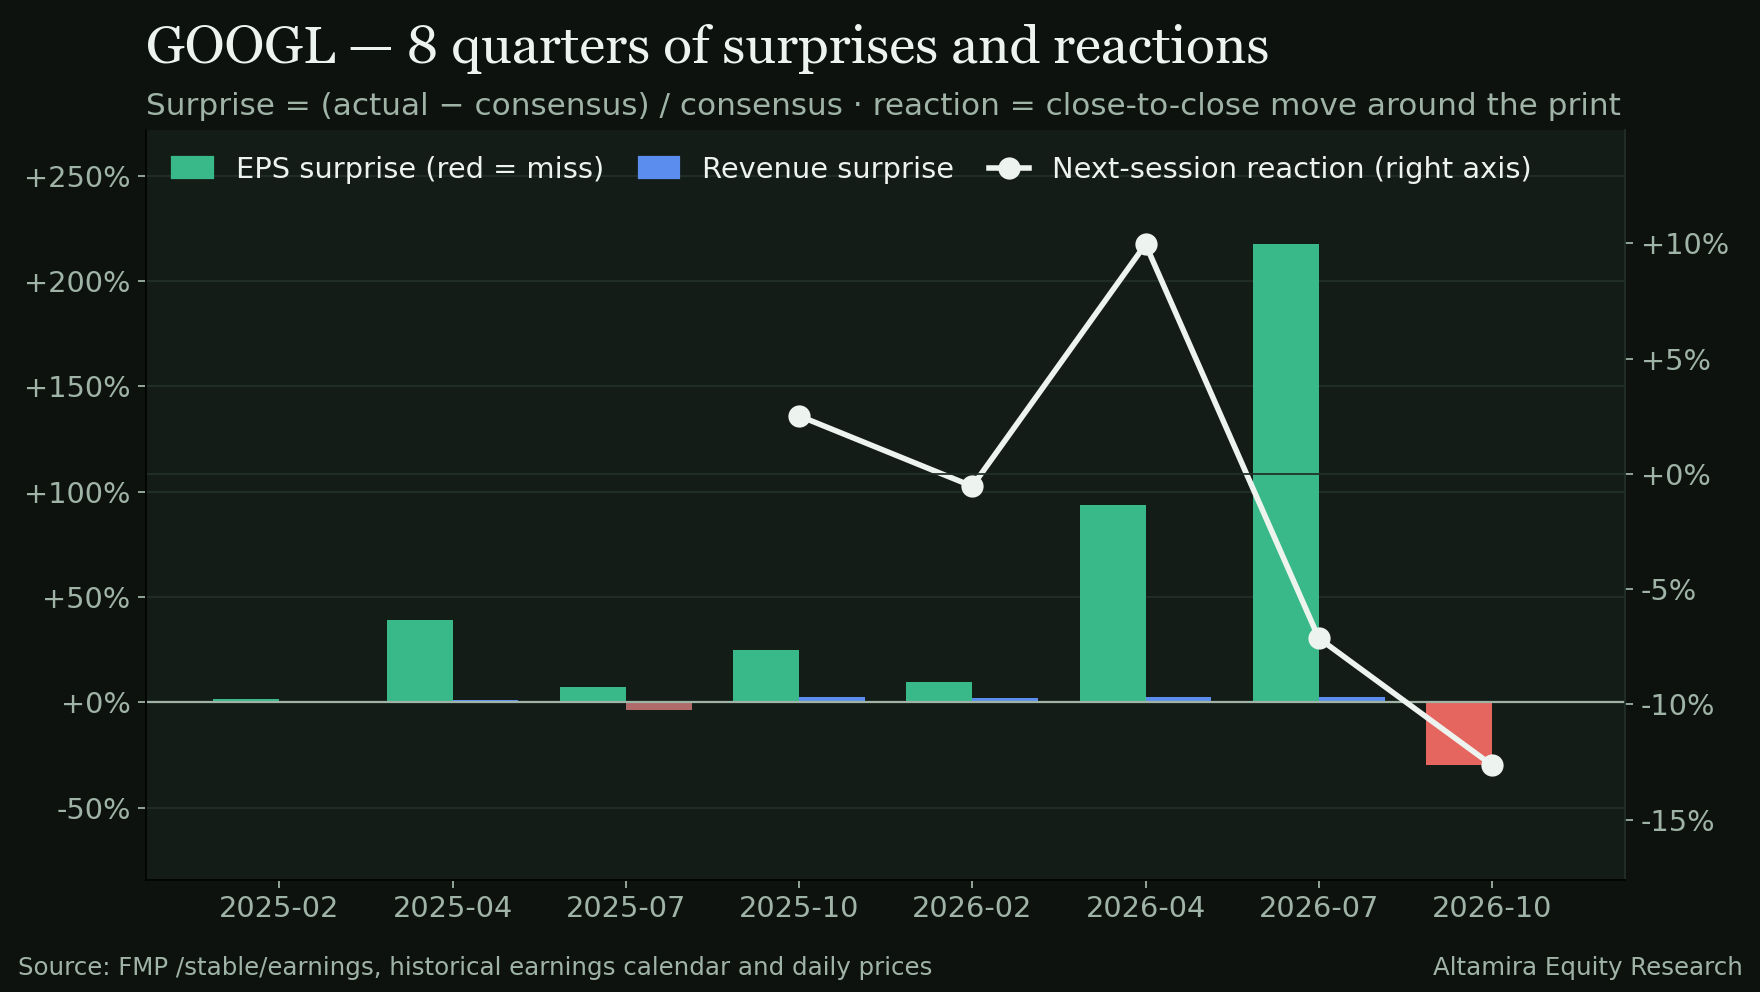
Revenue $127,577M vs $127,962M est · −0.30% surprise · +24.7% YoY · +6.5% QoQ
EPS (diluted) $2.12 vs $3.02 est · −29.80% surprise · −26.1% YoY (other-income driven — see below)
Guidance MAINTAINED FY2026 capex $195–205B unchanged · 2027 capex guided up significantly, detail on Q4 call
Reaction −11.5% AH To $287.50 from $324.89 close · 8Q avg abs move ±4.1% · scorecard price basis $283.36 on Oct 30
| Metric | Actual | Estimate | Surprise |
|---|---|---|---|
| Revenue | $127,577.0M | $127,962.3M | −0.30% |
| EPS (diluted) | $2.12 | $3.02 | −29.80% |
| Gross margin | 59.7% · +12 bp YoY · −195 bp QoQ · gross profit $76,158M | ||
| Operating margin | 31.8% · +129 bp YoY · operating income $40,576M (+30% YoY) | ||
| Net margin | 20.7% · −1,343 bp YoY · net income $26,468M — the YoY/QoQ net comparisons are distorted by large equity-investment marks in other income in prior quarters | ||
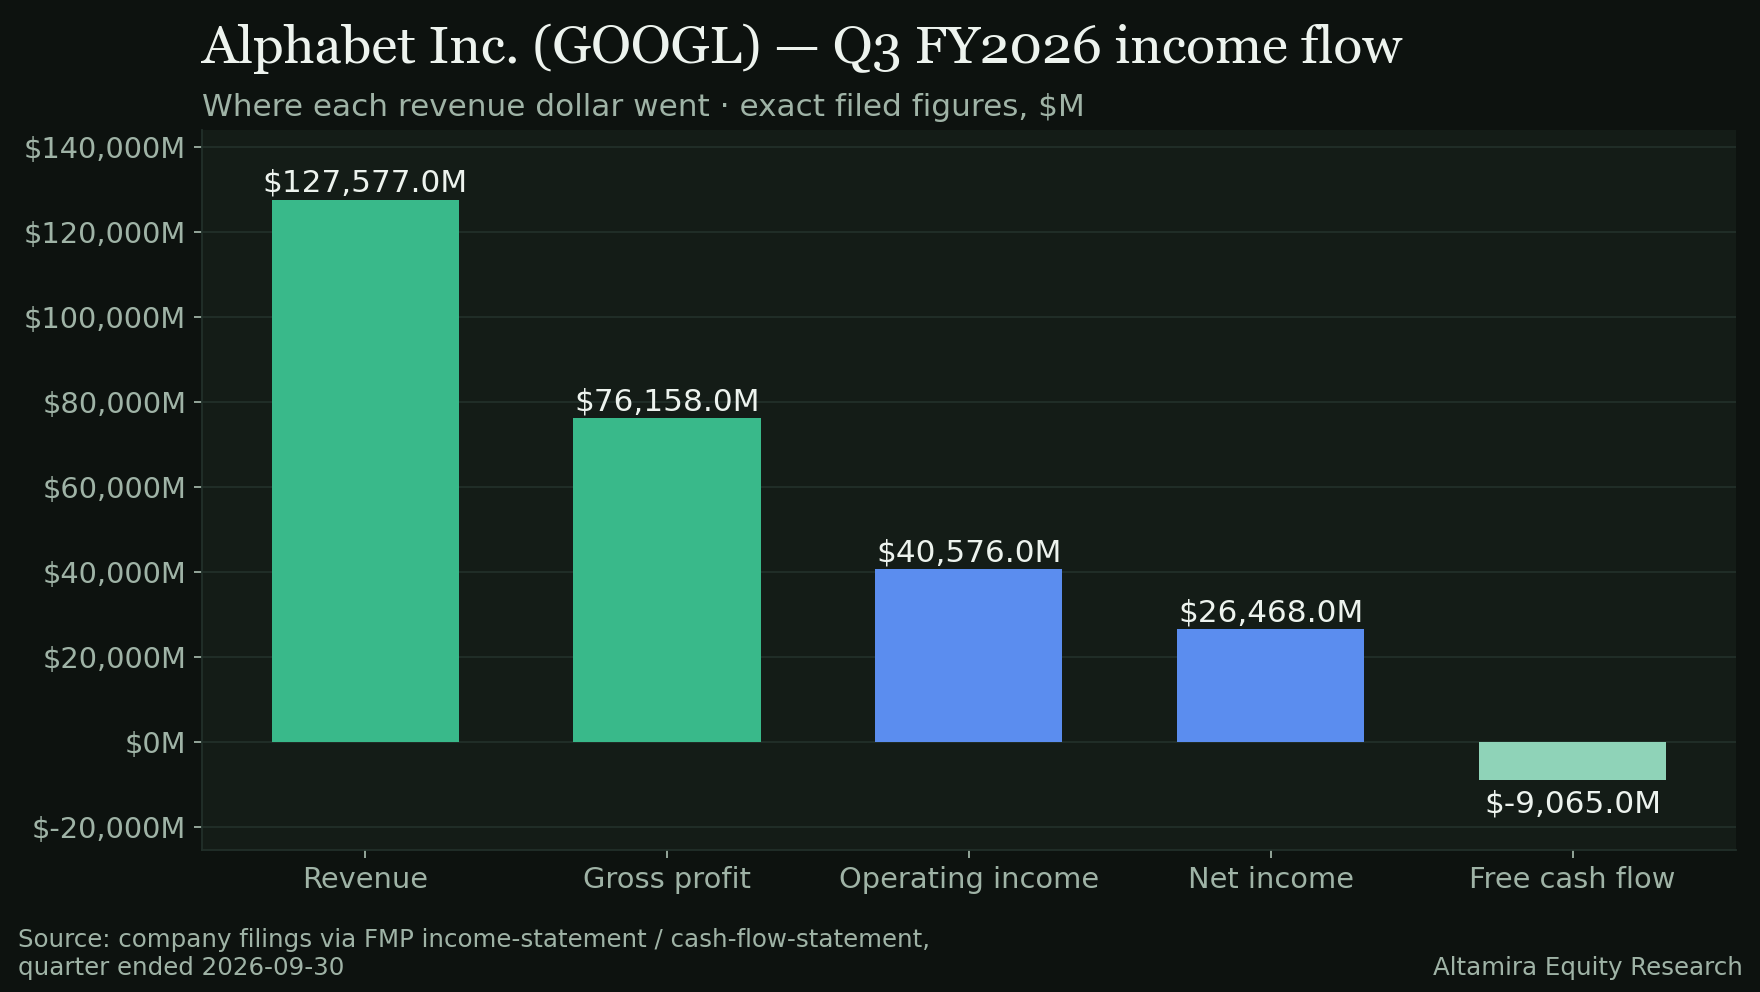
| Cash generation | OCF $42,290M · capex $51,355M · FCF −$9,065M · FCF conversion −34.2% of net income · trailing-12-month FCF $19.7B (call) | ||
| Capital return | No buyback disclosed in the quarter · dividends paid $2,936M · quarterly dividend declared $0.22/share · diluted shares 12,368M, +0.86% QoQ · stock comp $8,630M (6.8% of revenue) | ||
| Balance sheet | Cash + marketable securities $265,098M (call: $265.1B, incl. $90.4B marketable equity securities) · total debt $141,917M · long-term debt $125.1B (call) · future purchase commitments $924B (call, maximum contractual) | ||
| Estimate range | EPS estimates $2.70–$3.15 (29 analysts) — the $2.12 actual printed below the range, driven by the other-income loss · FMP price-target consensus null — omitted | ||
Read the EPS miss correctly: operating income rose 30% YoY. The miss sits below the operating line — net other expense was −$8,221M, which management attributed primarily to an unrealised loss on Alphabet's SpaceX investment as its stock price fell in Q3. That does not make the quarter clean — free cash flow, buybacks and dilution are separate, real strains — but it does mean the headline −29.8% is not an operating collapse.
Q3 2026 Sankey — where the revenue went
Revenue $127,577M · 100.0%
Cost of revenue $51,419M · 40.3%
Gross profit $76,158M · 59.7%
Operating expenses $35,582M · 27.9%
Operating income $40,576M · 31.8%
Net other expense −$8,221M · −6.4%
Income tax $5,887M · 4.6%
Net income $26,468M · 20.7%
Exact filed figures, FMP quarterly income statement, period ending Sep 30, 2026 (filed Oct 29, 2026). Operating expenses: R&D $20,640M + selling & marketing $8,804M + G&A $6,138M = $35,582M. Check: $40,576M − $8,221M = $32,355M pre-tax; − $5,887M tax = $26,468M net ✓.
How Alphabet makes money
Alphabet is organised in three segments (FMP profile, pulled Oct 30, 2026; segment revenues below are from the Q3 2026 earnings call — FMP's product/geographic segmentation endpoints returned no data for GOOGL, so no FMP segment split is asserted). Google Services — Search, YouTube, subscriptions, platforms and devices, Android, Chrome, Maps, Play and hardware — is the cash engine. Google Cloud — GCP infrastructure and AI, Workspace, and now TPU system sales — is the second engine, and this quarter it stopped looking like an option and started looking like a pillar. Other Bets (incl. Waymo) remain small and loss-making. Headquarters: Mountain View, California; 198,933 employees (FMP profile); CEO Sundar Pichai.
Google Services $96,300M
Search & other $63,300M
Subscriptions, platforms & devices $14,300M
YouTube ads $11,200M
Network ads $7,500M
Google Cloud $30,700M
Other Bets $372M
Segment revenue, Q3 2026, from the earnings call (CFO remarks). Services sub-lines sum to $96,300M ✓. Services operating income $39,200M (40.7% margin); Cloud operating income $11,100M (36.2%); Other Bets operating loss $2,000M on $372M revenue; Alphabet-level activities operating loss $7,700M (shared AI R&D) — $39,200M + $11,100M − $2,000M − $7,700M = $40,600M ≈ consolidated $40,576M (rounding) ✓. No Fiscal.ai profile exists for GOOGL and no live Fiscal session was available in this run — this section is built from FMP + the call, labelled as such.
The quarter in charts
Revenue — five quarters ($M)
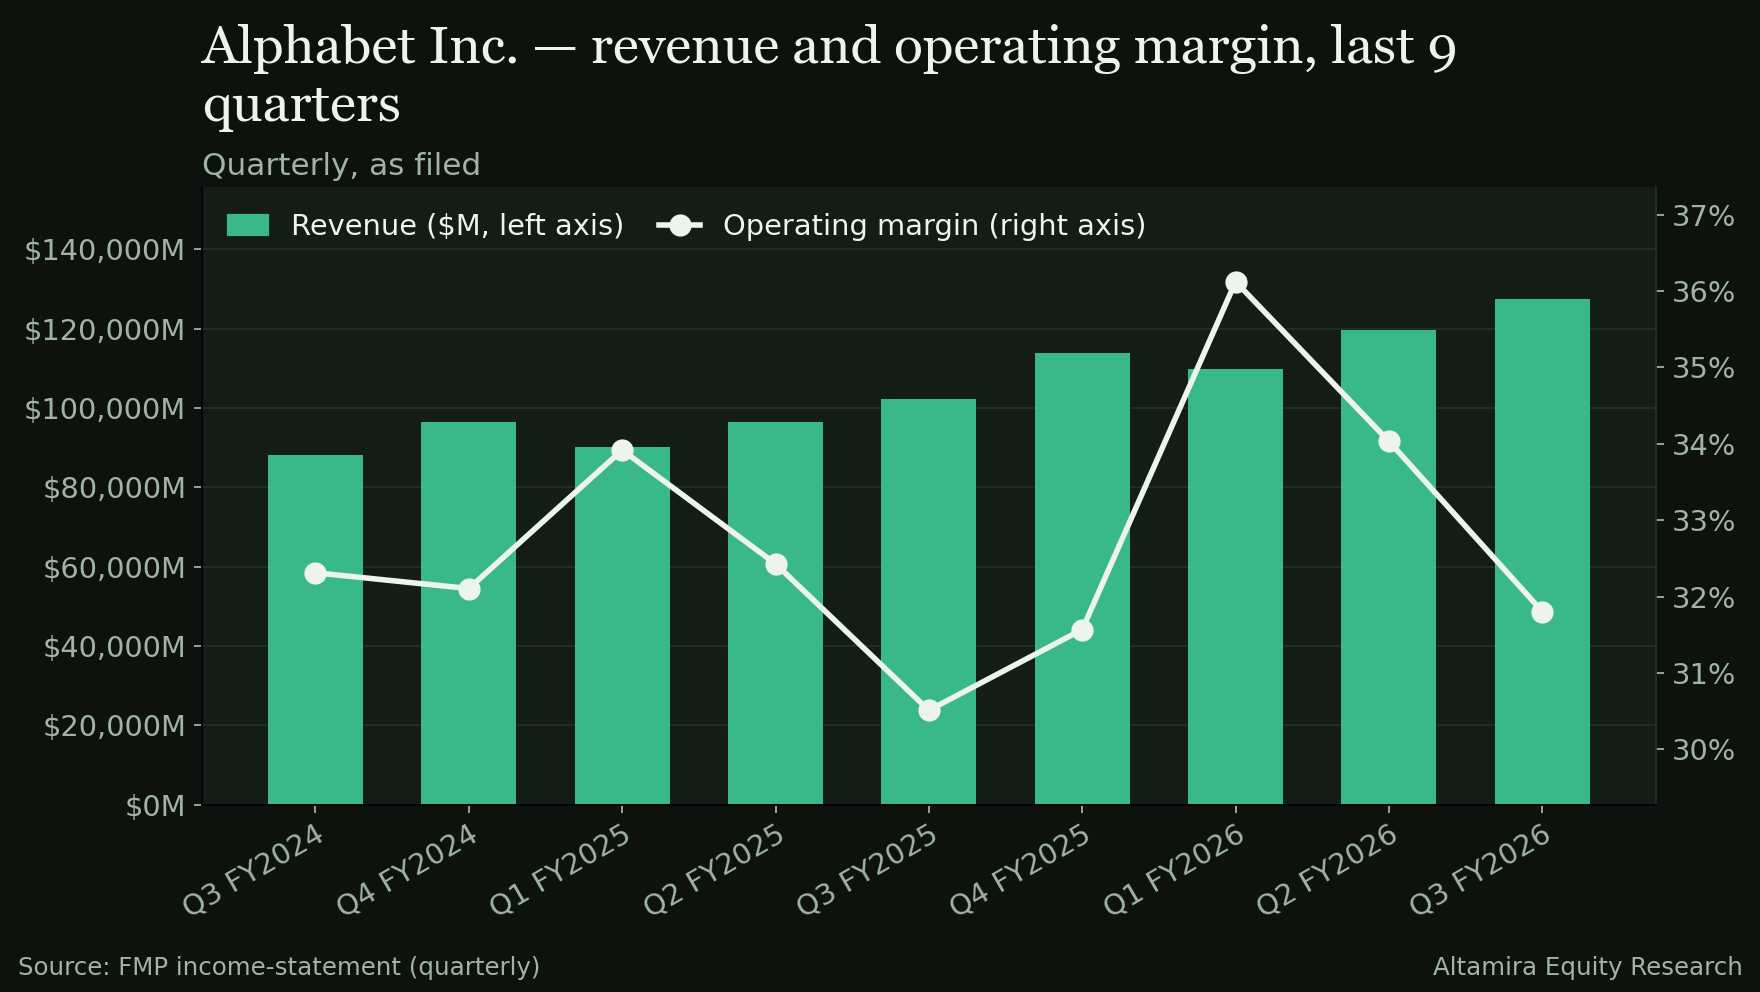
Q3 ’25$102,346MQ4 ’25$113,829MQ1 ’26$109,896MQ2 ’26$119,796MQ3 ’26$127,577M
Revenue accelerated to +24.7% YoY — the 13th consecutive quarter of double-digit growth (call) — with Cloud's doubling doing the heavy lifting this quarter.
Operating income — five quarters ($M)
Q3 ’25$31,228MQ4 ’25$35,934MQ1 ’26$39,696MQ2 ’26$40,770MQ3 ’26$40,576M
Operating income was essentially flat sequentially ($40,770M in Q2 → $40,576M) despite $7,781M more revenue — depreciation, TPU hardware costs and AI talent are absorbing the incremental gross profit. That absorption is the Key Issue in one chart.
Annual revenue ($B)
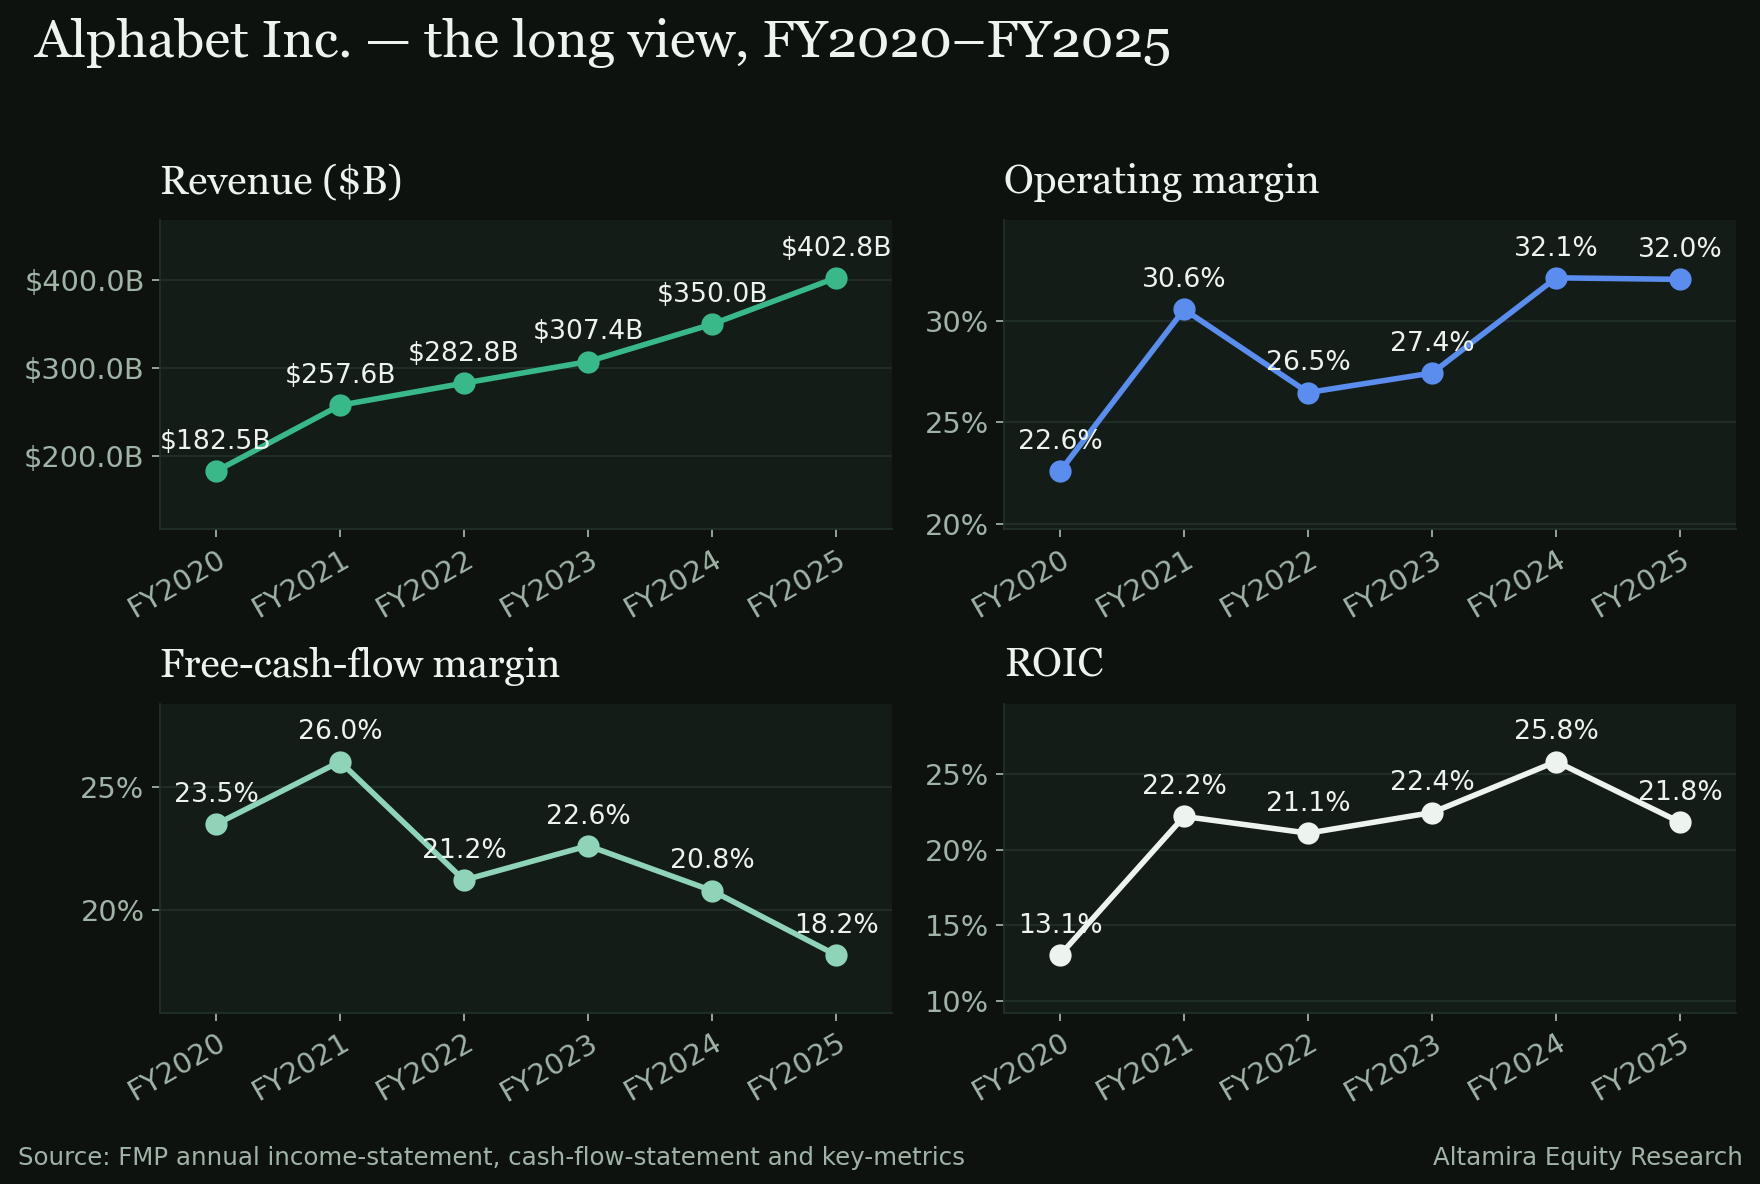
FY2022$282.8BFY2023$307.4BFY2024$350.0BFY2025$402.8B
Filed annual revenue (FMP annual statements): FY2022 $282.8B · FY2023 $307.4B · FY2024 $350.0B · FY2025 $402.8B.
What management said — Q3 2026 call (Oct 28, 2026)
- Guidance — MAINTAINED: No revenue/EPS guidance, per Alphabet practice. FY2026 capex held at $195–205B; capex guided to increase significantly again in 2027, with detail promised on the Q4 call. Q4 flags: a slightly larger FX headwind than Q3, Search lapping last year's acceleration, TPU system sales scaling ahead of a guided meaningful 2027 revenue ramp, and near-term Cloud margin headwinds as third-party bridging capacity ramps.
- Margins: Consolidated operating margin 31.8%. Cloud margin expanded to 36.2% from 23.7% a year ago (operating income more than tripled to $11.1B); Services margin 40.7%. Other cost of revenues +32% on TPU system hardware, depreciation, content and infrastructure operations; TAC $16.4B (+10%).
- Demand: Search & other +12% to $63.3B (retail largest, then finance) with YoY query growth the highest in five years and AI features expanding commercial queries. Cloud +103% to $30.7B; backlog $561B, just over 55% expected as revenue within 24 months. YouTube ads +9% to $11.2B. Gemini app at 1 billion users; first-party model APIs processing nearly 32 billion tokens per minute (+40% QoQ, >4× YoY).
- Capital return: FCF −$9.1B — OCF $42.29B (after a TPU inventory build and a $5.2B cash payment of the 2018 EC fine, appeal concluded) did not cover $51.4B capex. TTM FCF $19.7B. Dividend declared $0.22/share; no buyback disclosed; diluted share count +0.86% QoQ; SBC 6.8% of revenue — repurchases did not offset dilution this quarter.
- Analyst Q&A: JPMorgan pressed the gap between five-year-high query growth and decelerating Search revenue growth with lower AI-answer ad load — management cited FX, APAC retail (EU de minimis change) and media normalisation after a World Cup-strong Q2, and said AI Mode monetisation is lower but scaling. Barclays and others received no numeric answer on TPU system revenue recognition, TPU margins, or Cloud growth excluding TPU sales.
The Key Issue — is the capex supercycle a bridge or a new regime?
Thesis: Alphabet is converting the world's most profitable advertising engine into an AI full stack — TPUs, Gemini, Cloud — at a cost that has, for now, consumed its free cash flow and paused its buyback. The investment case no longer turns on whether the AI demand is real (this print says it is) but on whether the cash economics normalise: FCF inflecting, buybacks resuming, and 2027 capex detail that shows a peak in sight.
Evidence for (it is a bridge): Cloud revenue +103% with margin expanding to 36.2% and a $561B backlog — the spend is buying contracted, high-margin revenue, not hope. Search — the asset AI answers were supposed to erode — grew 12% with queries at a five-year growth high. Operating income +30% YoY at a 31.8% margin, and 5-year ROIC of 22.7% and ROCE of 27.1% (scorecard) say the installed base earns well above its cost of capital, as management argued on the call. Two of this quarter's FCF drags are explicitly one-off in nature: the $5.2B EC fine payment and a TPU inventory build ahead of guided 2027 system-sales revenue.
Evidence against (it is a regime): Capex of $51.4B in one quarter exceeded operating cash flow; FY2026 capex is $195–205B and 2027 is guided up significantly — no peak is in view, and future purchase commitments stand at $924B. Operating income was flat sequentially on $7.8B more revenue. With no buyback, SBC dilution (6.8% of revenue) flowed straight into a +0.86% share count. TPU system sales flatter Cloud growth and carry hardware economics management declined to quantify — the quality of the +103% is partly unverifiable from outside. And other income is now a material earnings swing factor in both directions: equity marks drove outsized net income in Q1–Q2 and the miss in Q3.
What to watch: Q4's 2027 capex detail (the single biggest catalyst); any buyback resumption; Cloud margin through the third-party capacity ramp; TPU sales converting to the guided 2027 ramp; and whether other income stabilises. The Recap thesis check rated the print STRAINED — operating pillars supported, capital-return pillar violated, no break trigger fired.
In charts
The numbers behind this note, drawn from the same filed figures.
Research for information only — not investment advice; see Disclosures.