Intuitive Surgical: The Beat Was Real — the Operating Margin Gave Most of It Back
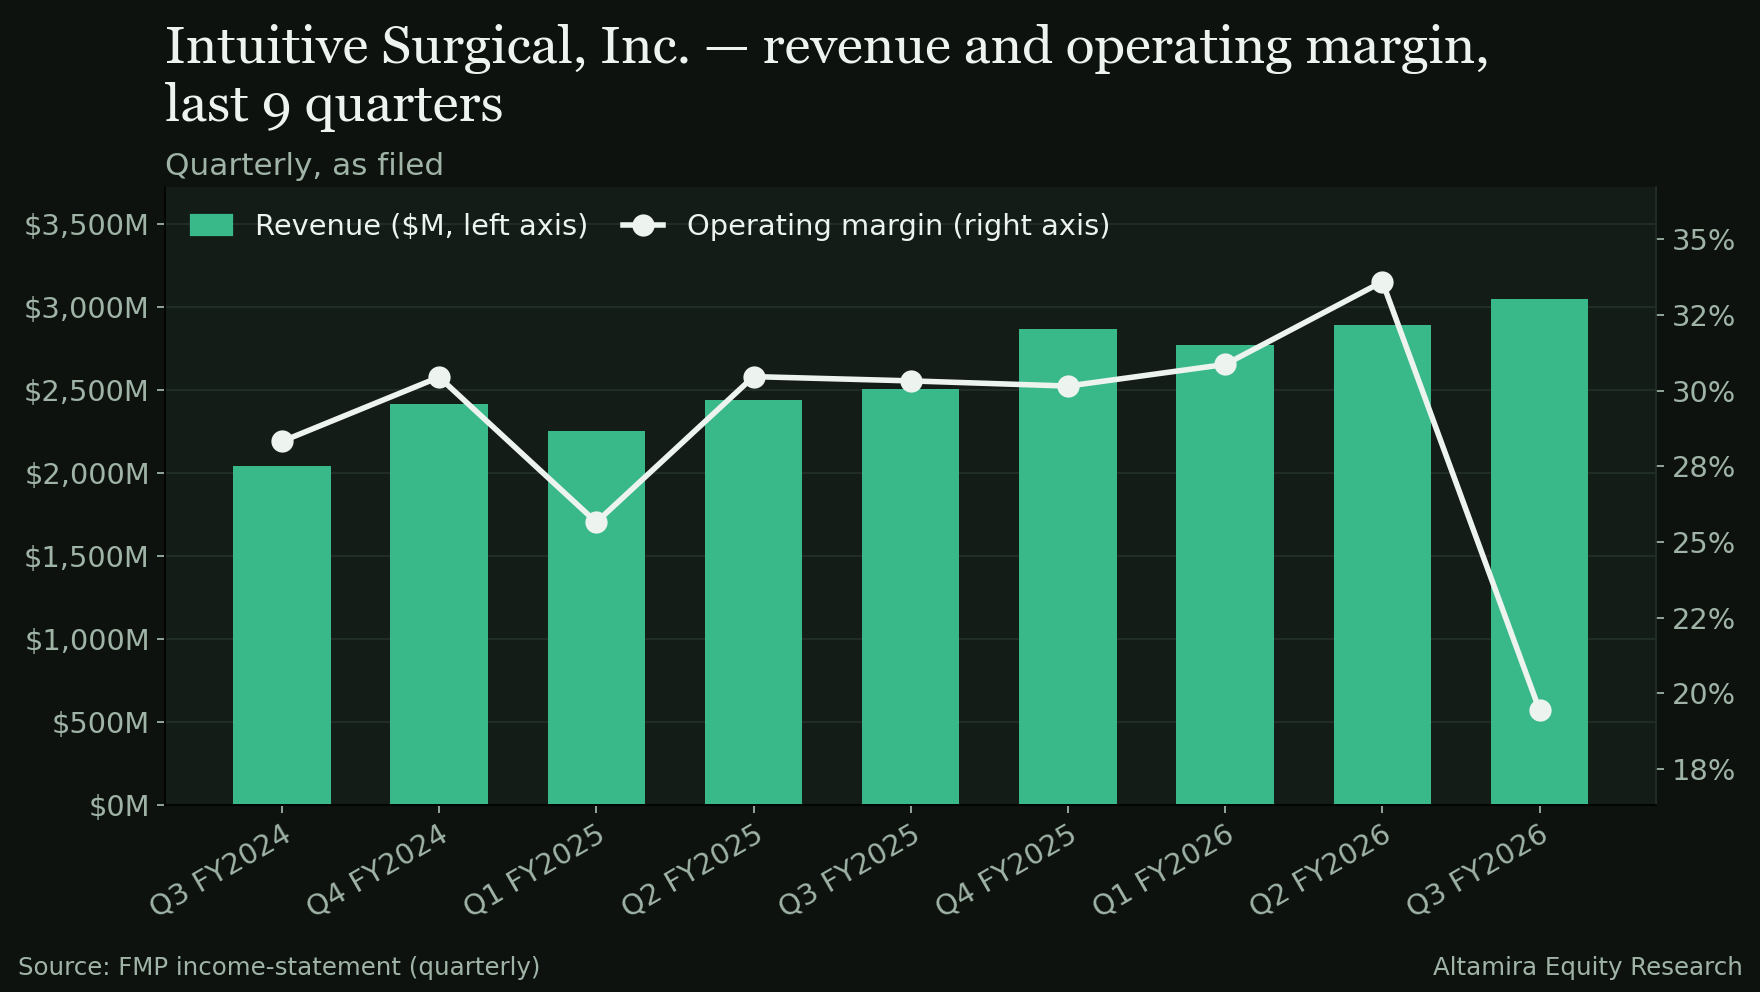
Intuitive Surgical beat on both lines for an eighth straight quarter and grew revenue 21.70% — then posted an operating margin of 19.44%, down 1,417 basis points from the quarter before. The stock fell 2.26% on the print, a third of its usual move, and has since recovered all of it and more.

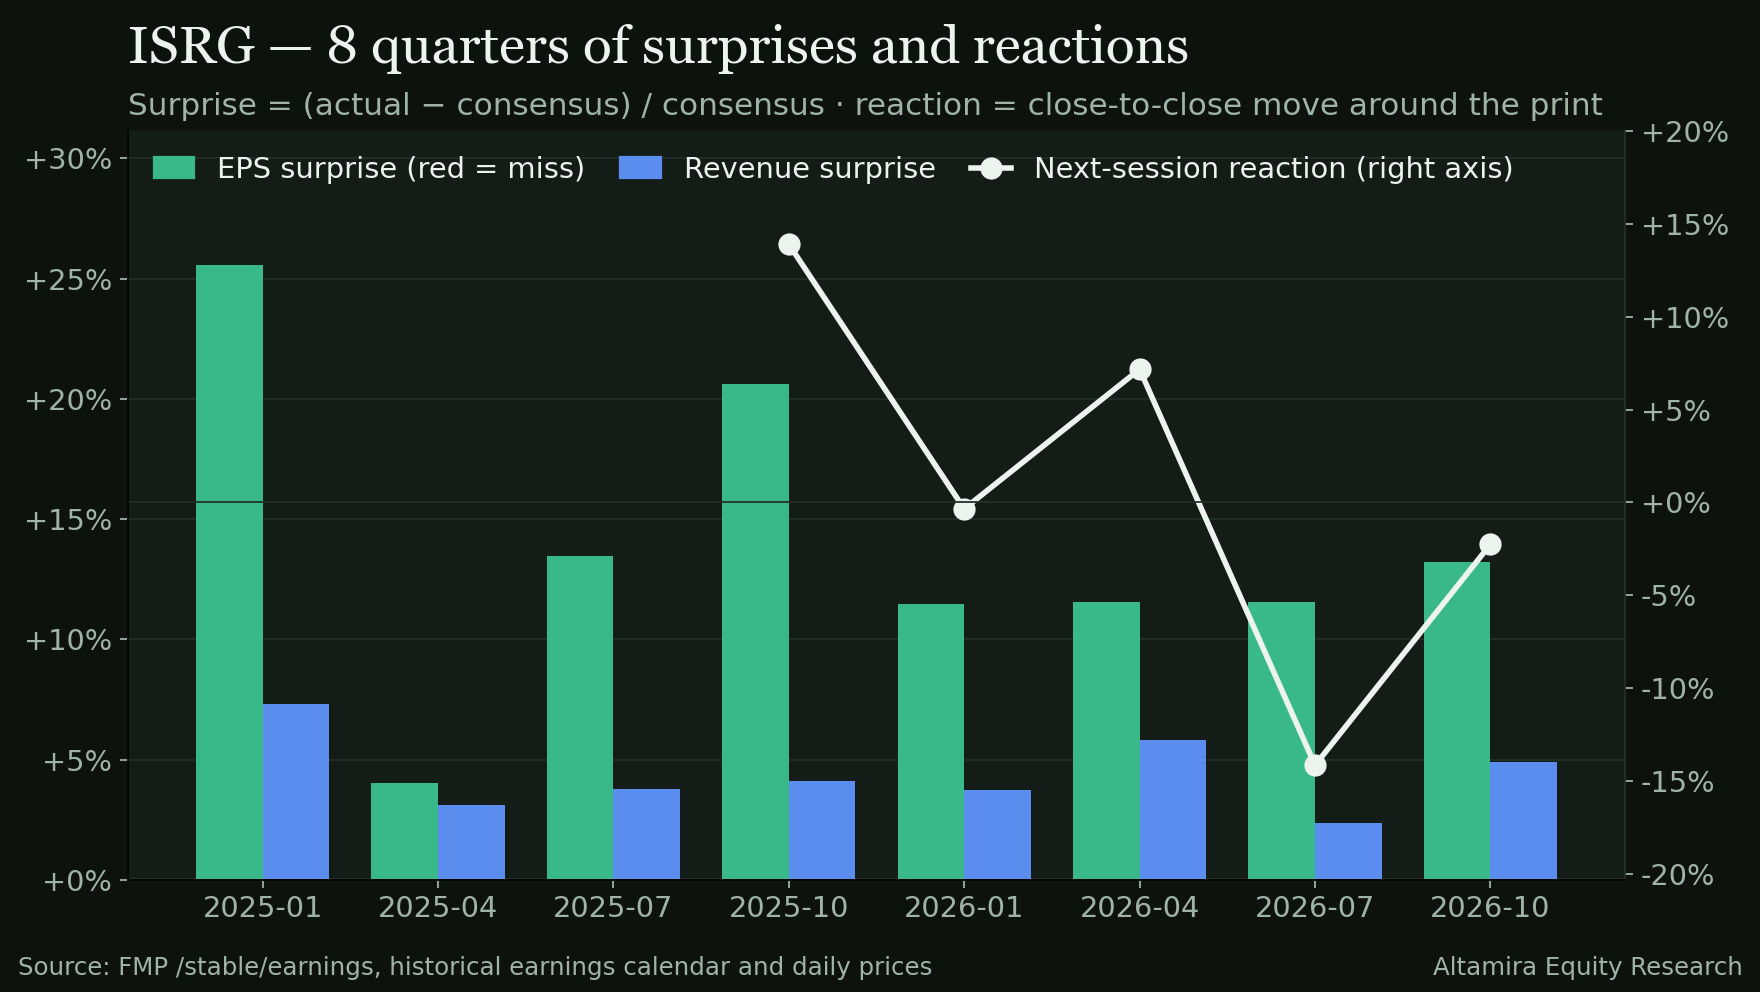
Adjusted EPS 3.00 vs 2.65 expected (+13.21%) · revenue $3,048.7M, +4.88% vs estimate and +21.70% YoY · operating margin 19.44%, −1,417 bp QoQ and −1,089 bp YoY · GAAP net income −25.78% YoY · stock −2.26% on the print, a third of its usual move, +3.34% since
The story in 30 seconds
- Intuitive Surgical's third fiscal quarter cleared both bars on the headline numbers: adjusted EPS of 3.00 beat the estimate by 13.21% and revenue of $3,048.7M beat by 4.88% and grew 21.70% year over year — the company's eighth consecutive double-beat quarter, grade A on our rubric.
- The quarter underneath the beat moved the other way. Operating margin fell to 19.44%, down 1,417 basis points from 33.60% the quarter before and 1,089 basis points from a year earlier. GAAP net income fell 25.78% year over year to $522.8M and GAAP diluted EPS fell 23.59% to 1.49, even with revenue up 21.70%.
- The open question is whether the margin compression is a one-quarter item or the start of a new cost base; the company's next print, January 28, 2027, is the first place it will show.
Read quickly, this is a franchise that just beat estimates for the eighth straight quarter and grew revenue above 20% — a reader skimming the headline would expect the stock to have run. It fell 2.26% on the print instead, and the reason is in the next layer down: the operating margin that has run between 25% and 34% for two years dropped to 19.44% in a single quarter, and the net income and GAAP EPS lines that are supposed to track an "A" quarter both fell. The adjusted EPS beat and the margin compression are both real; they are measuring different things, and the market, moving only a third of its usual amount, priced something in between.
Intuitive Surgical sells the da Vinci surgical systems, the instruments and accessories that go with every procedure, and service contracts — a razor-and-blade model that has compounded revenue at 18.22% a year since FY2020 with operating margin expanding 518 basis points over the same five years. The third quarter is the first in that run where the margin line moved sharply against the trend rather than with it.
In this post: (1) the quarter against the eight-quarter beat streak and the market's muted reaction; (2) where the margin went, in one chart; (3) what to make of the GAAP-versus-adjusted gap and the cash line that didn't weaken; (4) the five-year record against this one quarter; (5) the honest counterweight and the Key Issue for January.
At a glance — Q3 FY2026
- Revenue: $3,048.7M vs $2,906.9M expected · +4.88% surprise · +21.70% YoY
- Adjusted EPS: 3.00 vs 2.65 expected · +13.21% surprise · GAAP diluted EPS 1.49, −23.59% YoY
- Guidance: NOT STATED — the earnings-call transcript is not in the dataset; no guidance class is assigned and none is invented here
- Reaction: −2.26% close to close, from 438.00 (2026-10-20) to 428.12 (2026-10-21) · 0.3× the 8-quarter average absolute move of 7.56%
- Margins: gross 68.37% (+201 bp YoY, +59 bp QoQ) · operating 19.44% (−1,089 bp YoY, −1,417 bp QoQ) · net 17.15% (−1,097 bp YoY, −1,114 bp QoQ)
- Cash generation: operating cash flow $1,224.1M · capital expenditure −$113.1M · free cash flow $1,111.0M · 36.44% of revenue, +708 bp YoY · free cash flow to net income 212.51%
- Share count: diluted shares 351,600,000, −2.82% YoY and −1.92% QoQ · dividends $0.0M · buybacks −$2,975.7M
- Balance sheet: cash & short-term investments $4,042.5M · total debt $0.0M · net debt −$2,978.1M (net cash) · shareholders' equity $15.99B · inventory $2,128.2M
Since the print: the stock closed at 428.12 the session after the print (2026-10-21) and has traded up to 442.40 as of November 12 — a gain of roughly +3.34% that erased the entire post-print decline and then some, even as the shares remain 22.72% below where they traded twelve months ago.
The quarter in one line: the beat on the numbers the street watches was real, the beat on the numbers the business runs on was not, and the stock's muted, since-reversed reaction read that correctly.
Q3 FY2026 flow — where the revenue dollar went
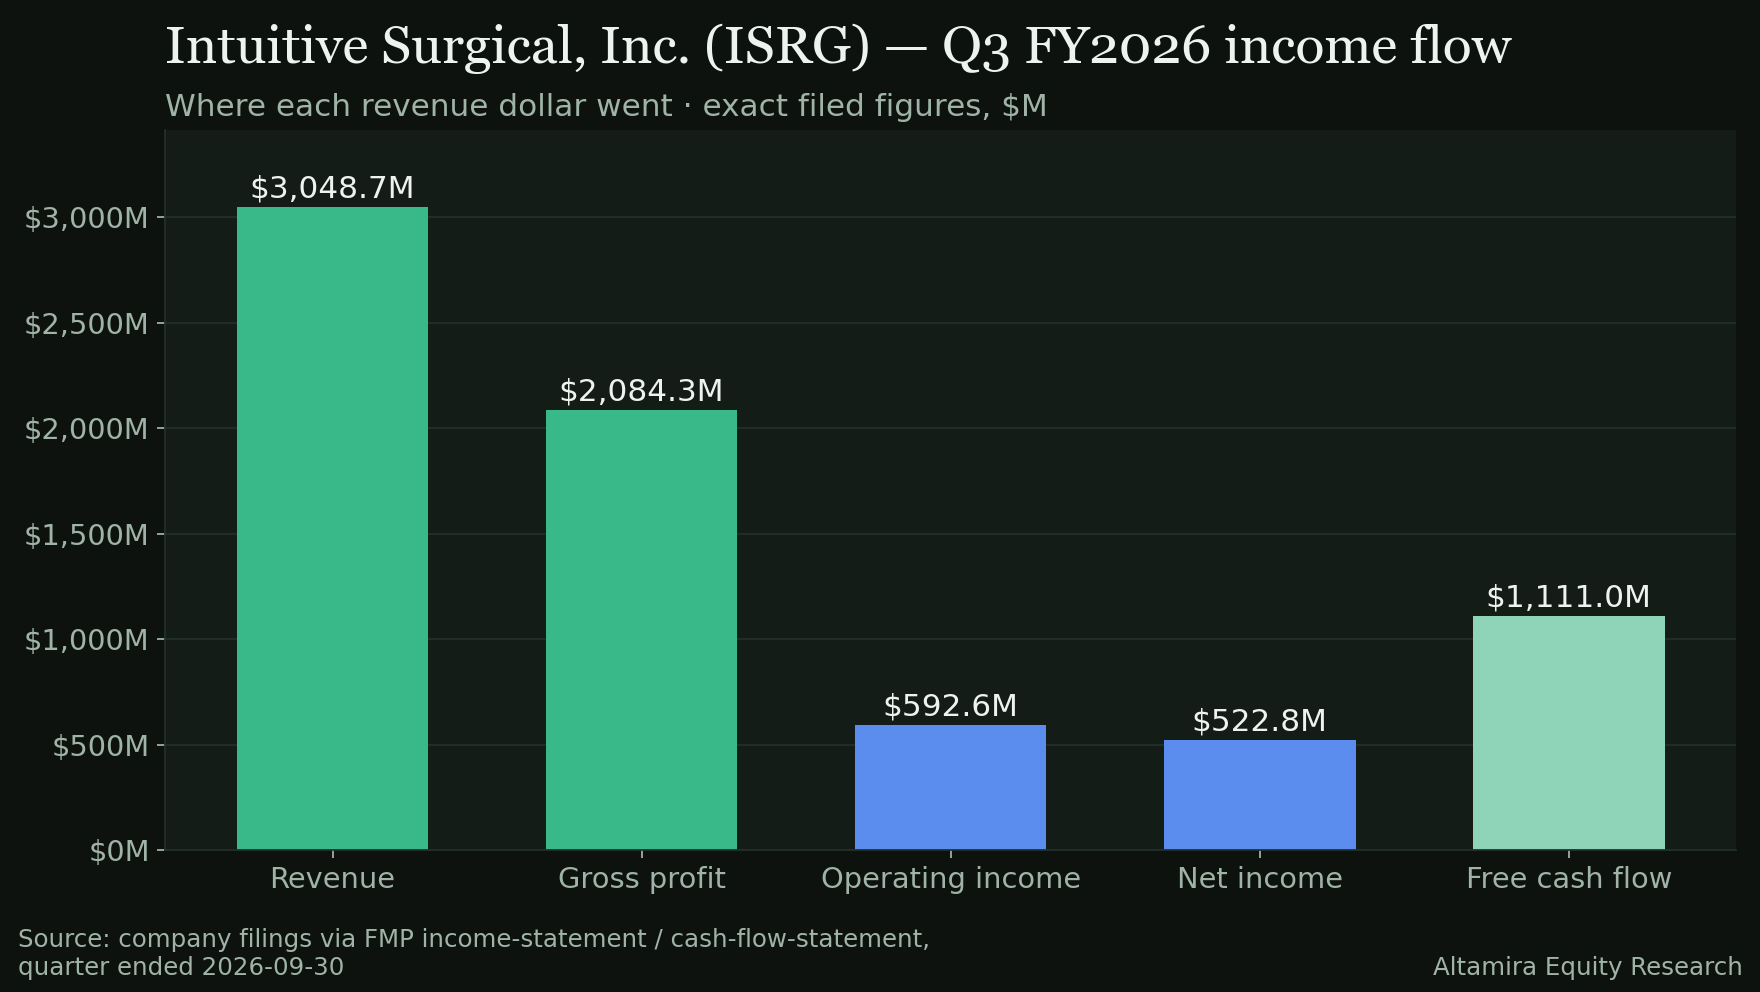
- Revenue: $3,048.7M (100.00%)
- Cost of revenue: $964.4M (31.63%)
- Gross profit: $2,084.3M (68.37%)
- Operating expenses: $1,491.7M (48.93%) — R&D $408.3M (13.39%), SG&A $1,083.4M (35.54%)
- Operating income: $592.6M (19.44%), −22.00% YoY
- Pre-tax income: $668.4M (21.92%)
- Income tax: $144.0M (4.72%)
- Net income: $522.8M (17.15%)
- Free cash flow: $1,111.0M (36.44%)
The swing item is the same one line twice: operating expenses at 48.93% of revenue are the direct arithmetic reason a 68.37% gross margin, up 201 bp year over year, produced only a 19.44% operating margin, down 1,089 bp over the same stretch.
What to make of this print
Six readings, each a finding plus what it means.
- The top line kept its multi-year pace. Revenue of $3,048.7M grew 21.70% year over year and 5.41% sequentially from $2,892.3M — the eighth straight quarter in which both EPS and revenue beat the street. The procedure volume and system-placement franchise behind that growth is not the part of this quarter in question.
- The margin move is large and is an expense story. Operating margin fell to 19.44% from 33.60% the quarter before (−1,417 bp) and 30.33% a year earlier (−1,089 bp), even as gross margin rose 201 bp year over year to 68.37%. Operating expenses of $1,491.7M, 48.93% of revenue, are the entire gap; the filed summary does not break out whether that is a one-time item, and this post does not guess.
- Quality of earnings: the adjusted and GAAP lines diverged sharply. Adjusted EPS of 3.00 beat the estimate by 13.21%; GAAP diluted EPS was 1.49, down 23.59% year over year, and GAAP net income of $522.8M was down 25.78% year over year despite revenue up 21.70%. A reader who only sees the adjusted beat is seeing half the quarter.
- Cash did not weaken with the margin. Free cash flow of $1,111.0M was 36.44% of revenue, up 708 basis points year over year, and 212.51% of GAAP net income, on capital expenditure of just $113.1M. Operating cash flow of $1,224.1M funded $2,975.7M of buybacks in the quarter against no debt issuance.
- The share count fell faster than usual. Diluted shares of 351,600,000 were down 2.82% year over year and 1.92% sequentially, against $2,975.7M of buybacks and no dividend. Buybacks are supporting the per-share lines in a quarter where the aggregate net-income line fell.
- The balance sheet is a clean counterweight to the margin story. Net debt of −$2,978.1M (a net cash position) and shareholders' equity of $15.99B give the company room to absorb a weak quarter without financing pressure, which the health pillar of the KPI Scorecard scores at 99.5 of 100 — the strongest cell in the company's profile.
Takeaway: a quarter in which the procedure-volume franchise and the balance sheet both held, the cash line actually improved, and the operating margin gave back more than a year of its own trend in one print.
The long view — FY2020 to FY2025
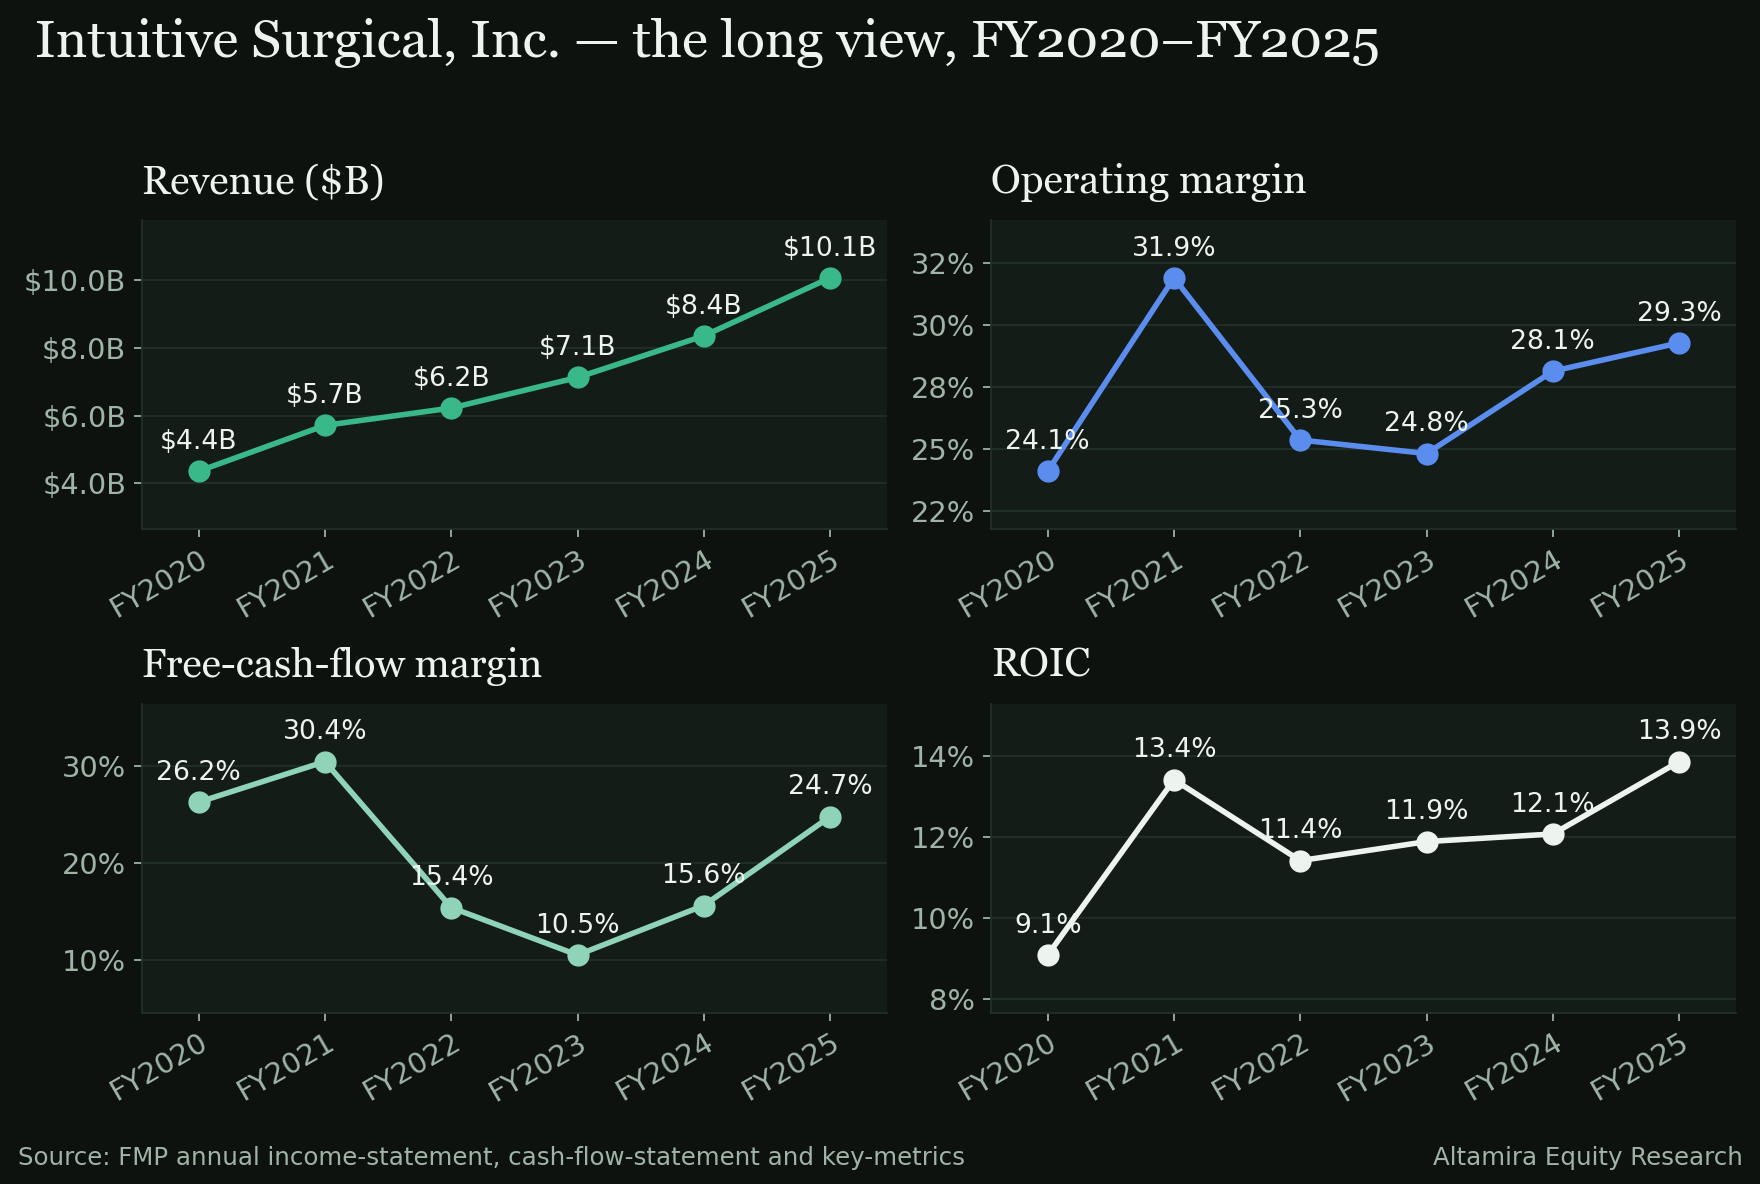
- Revenue growth. $4.36B in FY2020 to $10.06B in FY2025, an 18.22% compound rate — a franchise that has more than doubled in five years without the growth rate breaking down.
- Operating margin. 24.09% in FY2020 to 29.27% in FY2025, 518 basis points of expansion, reached unevenly (FY2021 31.89%, FY2022 25.35%, FY2023 24.80%, FY2024 28.12%). The third quarter's 19.44% sits below every one of those six annual figures.
- Cash. Free-cash-flow margin moved from 26.23% in FY2020 to 24.75% in FY2025 — flat to slightly lower even as operating margin improved, and free cash flow compounded at 16.85%, a point below the 18.22% revenue rate.
- ROIC. 9.09% in FY2020 to 13.87% in FY2025 — real improvement, but the slowest-moving of the four lenses, and still below the levels a 68%-gross-margin, net-cash business would be expected to post at scale.
The honest counterweight
Three cells argue for caution before calling the margin print a one-quarter event.
- Technical score 47.9, state MIXED, tier 4. The KPI Scorecard's November 12 edition has Intuitive Surgical at a fundamental composite of 63.7 (quality 60.7, growth 70.9, value 30.6, shareholder 78.9, health 99.5, moat 64.0) but a technical score of 47.9 and a blended total of 59.0, rank 147, verdict unchanged. The fundamentals are solid rather than exceptional; the trend reading is in the middle of the pack.
- The stock already trades above the one published fair value. At the November 12 close of 442.40 against a Morningstar fair value of 378.00, the margin of safety is −18.92% — the market is not pricing in a margin problem, which is itself worth noting against a quarter that just posted one.
- The next comparison is a tougher one. The same quarter a year from this print (Q4 FY2025) ran a 30.15% operating margin; if the January quarter does not move back toward the 25%–30% range the business ran for two years, the single-quarter explanation gets harder to sustain.
The Key Issue
Whether the 48.93% operating-expense ratio that produced a 19.44% operating margin is a one-quarter item — a timing shift in spend, a filed classification — or the new cost of running the business at its current scale. The transcript, not in this dataset, would say; the January 28, 2027 print will show it directly, against this quarter's 19.44% and the FY2025 full-year figure of 29.27%.
Thesis verdict: Strained Grade A
Revenue +21.70%, free cash flow +708 bp of margin, a net-cash balance sheet — the franchise and the cash line held. Operating margin fell 1,417 basis points in one quarter and GAAP net income fell 25.78% year over year despite the revenue growth; that is more than a single counterweight cell, which is why the verdict sits at Strained rather than Intact despite an eighth straight headline beat.
Sources
- FMP /stable/earnings (actuals vs consensus, eight quarters), /historical/earning_calendar/ISRG (report timing), /historical-price-full/ISRG (daily closes; moving averages, ranges and the close-to-close reaction computed from them) — pulled November 12, 2026.
- FMP /income-statement, /cash-flow-statement, /balance-sheet-statement (quarterly, nine quarters; the Q3 FY2026 statements filed October 21, 2026) and the annual statements plus /key-metrics for FY2020–FY2025 — pulled November 12, 2026.
- FMP /analyst-estimates and /key-metrics-ttm — pulled November 12, 2026.
- Altamira KPI Scorecard, edition 2026-11-12 (kpi-scorecard-2026-11-12.json): composite, pillar and technical scores, tier, state and fair-value cells as published.
- Guidance, segment detail and management commentary: NOT STATED — the earnings-call transcript is not in the dataset for this edition.
Research for information only — not investment advice; see Disclosures.
On the data pages
- ISRG company page — the filed figures, margins, cash flow and the print history, from SEC EDGAR.
- ISRG vs RMD, head to head — the two on the same scorecard cells (top composite in Healthcare (kpi-scorecard-2026-11-12.json)).
- Verdict ledger — every public call, on the record.
- Earnings schedule — who reports next, and how every print this season graded.