KLA: The Moat Printed — the Proof Didn't
KLA printed the kind of quarter that is supposed to settle an argument. Revenue accelerated to $4,136.0M, up 28.9% year over year after a long run of single-digit sequential steps, gross margin widened to 61.85%, and operating margin reached 45.01%.

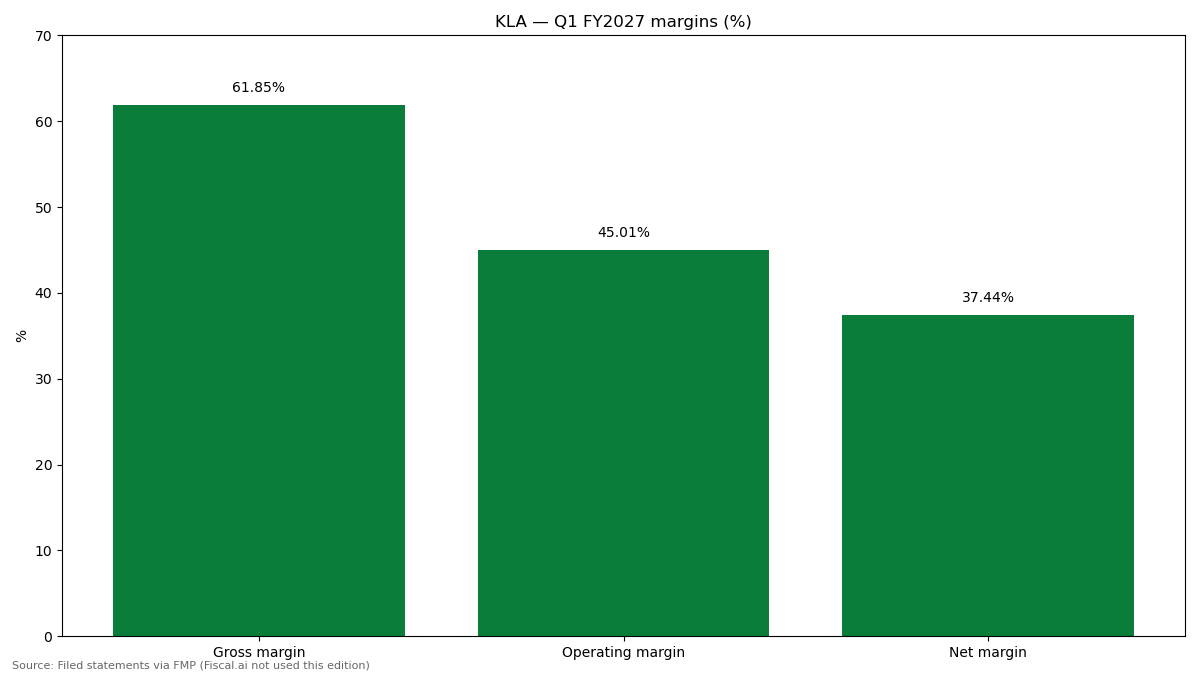
Revenue +28.9% YoY to $4,136M · operating margin 45.0%, +335bp YoY · after-hours +6.7% even as the call transcript on file belongs to another quarter
Company Insights · KLA Corporation (NASDAQ: KLAC) · Q1 FY2027 (quarter ended September 30, 2026), reported Tuesday, October 28, 2026 after the close
The story in 30 seconds
- KLA beat on both lines — revenue $4,136.0M (+28.86% YoY), adjusted EPS $1.22 — with gross margin of 61.85% and operating margin of 45.01%.
- Guidance is classified as maintained, and free cash flow of $1,336.2M converted 86.28% of net income.
- The open question is verification: the earnings-call transcript on file belongs to another quarter, so current-quarter commentary on inspection share and China cannot be checked from the materials available.
KLA printed the kind of quarter that is supposed to settle an argument. Revenue accelerated to $4,136.0M, up 28.9% year over year after a long run of single-digit sequential steps, gross margin widened to 61.85%, and operating margin reached 45.01%. Those are not the margins of a commodity equipment vendor. They are the margins of a company whose inspection and metrology tools sit so deep in the wafer fab that customers pay for yield, not for hardware.
The market agreed, up to a point: the stock rose 6.72% after hours to $169.445 from a $158.77 previous close, a move larger than its eight-quarter average absolute move of ±5.03%. Investors paid for the filed numbers. What they could not verify — at least from the materials on file — is the narrative that is supposed to carry the next year: inspection share gains, China de-risking, and the durability of elevated memory and leading-edge demand.
The reason is specific. The transcript supplied for this quarter is the wrong quarter: a March-quarter 2026 call served for the September quarter. This post therefore presents no verbatim current-quarter management quotes and treats its management section as filing-only. The numbers are strong enough to stand without borrowed words.
In this post: 1. The print in one picture — where the revenue went. 2. What to make of it — seven readings of the quarter. 3. The long view — compounding, margins, cash and returns over five years. 4. The Key Issue — whether inspection share gains and China de-risking can be verified, and what the current valuation already assumes.
At a glance — Q1 FY2027
| Revenue | $4,136.0M vs $4,042.6M est · +2.31% surprise · +28.86% YoY · +13.08% QoQ |
| EPS (adjusted) | $1.22 vs $1.19 est · +2.52% surprise · GAAP diluted EPS $1.18 · estimate range $1.17–$1.24 (15 analysts) |
| Margins | Gross 61.85% (+58 bp YoY) · Operating 45.01% (+335 bp YoY) · Net 37.44% (+251 bp YoY) |
| Cash generation | Operating cash flow $1,530.9M · Free cash flow $1,336.2M · 86.28% of net income |
| Balance sheet | Cash $1,532.0M · Cash + short-term investments $6,273.1M · Total debt $5,723.3M · Net debt $4,191.3M |
| Capital return | Repurchases $935.8M · Dividends $305.1M · Total returned $1,240.9M |
| Guidance | Maintained (no raise or cut flagged; current-quarter commentary unverified — see below) |
| Reaction | +6.72% after hours to $169.445 (8Q average move ±5.03%) |
The quarter in one line: a modest consensus beat on the top and bottom lines, powered by an acceleration in filed revenue and a 335-basis-point jump in operating margin — with the management proof for the next leg still unverified.
Where the dollar went — Q1 FY2027
| Flow | $M | % of revenue |
|---|---|---|
| Revenue | 4,136.0 | 100.0% |
| Cost of revenue | 1,577.8 | 38.1% |
| Gross profit | 2,558.2 | 61.9% |
| Operating expenses | 696.6 | 16.8% |
| Operating income | 1,861.7 | 45.0% |
| Other expenses, net | 37.6 | 0.9% |
| Income tax | 275.5 | 6.7% |
| Net income | 1,548.6 | 37.4% |
Exact filed figures, quarterly income statement for the period ending September 30, 2026. Operating expenses: research and development $395.1M + SG&A $301.5M. The effective tax rate was 15.1%.
What to make of this print
- The acceleration is the story, not the beat size. A +2.31% revenue surprise looks ordinary until it is placed in sequence: quarterly revenue stepped from $3,209.7M in September 2025 to $3,297.1M, $3,415.1M and $3,657.6M, then jumped to $4,136.0M. The year-over-year growth rate, +28.86%, is a regime change from the prior year's pace — and it arrived with margin expansion.
- Quality of earnings — operational, with repurchase support at the margin. Adjusted EPS growth is +39.3% YoY, while the diluted share count fell only 0.47% quarter over quarter. A count move that small cannot explain EPS growth of that size against +28.9% revenue growth; the growth is primarily operational.
- Margins are the moat's signature — this quarter. Gross margin of 61.85% and operating margin of 45.01% at this revenue scale mean pricing and mix, not just volume leverage. Process control is paid on yield outcomes; when complexity rises, inspection intensity rises with it. The print is consistent with that story — it does not, by itself, prove share gains within it.
- Cash conversion is strong, capital return is heavy. Free cash flow of $1,336.2M converted 86.28% of net income, and KLA returned $1,240.9M in the quarter — $935.8M of repurchases plus $305.1M of dividends — close to the entire free cash flow.
- Guidance is classified maintained — and commentary is unverifiable. No raise or cut was flagged. Ordinarily the call would explain the guide; here the transcript on file belongs to another quarter, so the reasoning and the segment colour cannot be checked. That is a genuine information gap, flagged rather than papered over.
- The balance sheet is not the constraint. Net debt of $4,191.3M stands against $6,273.1M of cash and short-term investments, with interest cover of 19.90x on the long-window figures. If equipment spending pauses, KLA faces an earnings cycle, not a solvency question.
- The debate has moved from execution to price. The shares trade on a trailing price/earnings multiple of 42.11x and a free-cash-flow yield of 1.83% on the reported dashboard basis, and the chart remains weak: the shares stand 48.38% below their 52-week high on the long-window series. A great quarter at a full multiple raises the bar for what comes next.
Takeaway: operationally this is the strongest KLA print in this sequence — acceleration, margin and cash at once. The restraint in the market's longer-term pricing conversation comes from everything around the print: valuation, the chart, and an unverified management narrative.
How KLA makes money
Wafer-fab equipment is the machinery that makes chips; process control is the inspection and metrology layer inside it that finds defects, measures dimensions and protects yield as geometries shrink and packaging stacks. Economics turn on capital intensity per wafer, inspection steps per layer, and service attach: as nodes and advanced packaging grow more complex, the number of inspection and measurement steps rises even if unit wafer starts grow slowly. Peers covered in this universe: Applied Materials, Lam Research, ASML, KLA and Cadence.
KLA is a semiconductor process-control company: inspection and metrology for wafer fabrication. Its business is described qualitatively here — process-control systems plus services — because no verified segment dollar split is on file for this edition; none is invented. The economic logic that the filed margins support is narrower and safer: customers pay for yield. When a fab's cost per wafer rises, a defect missed early is more expensive, and the vendor whose tools catch it earns system sales and recurring service. That logic is visible in a 61.85% gross margin this quarter and a 61.30% gross margin over the long window — the level is structural, not a one-quarter artefact.
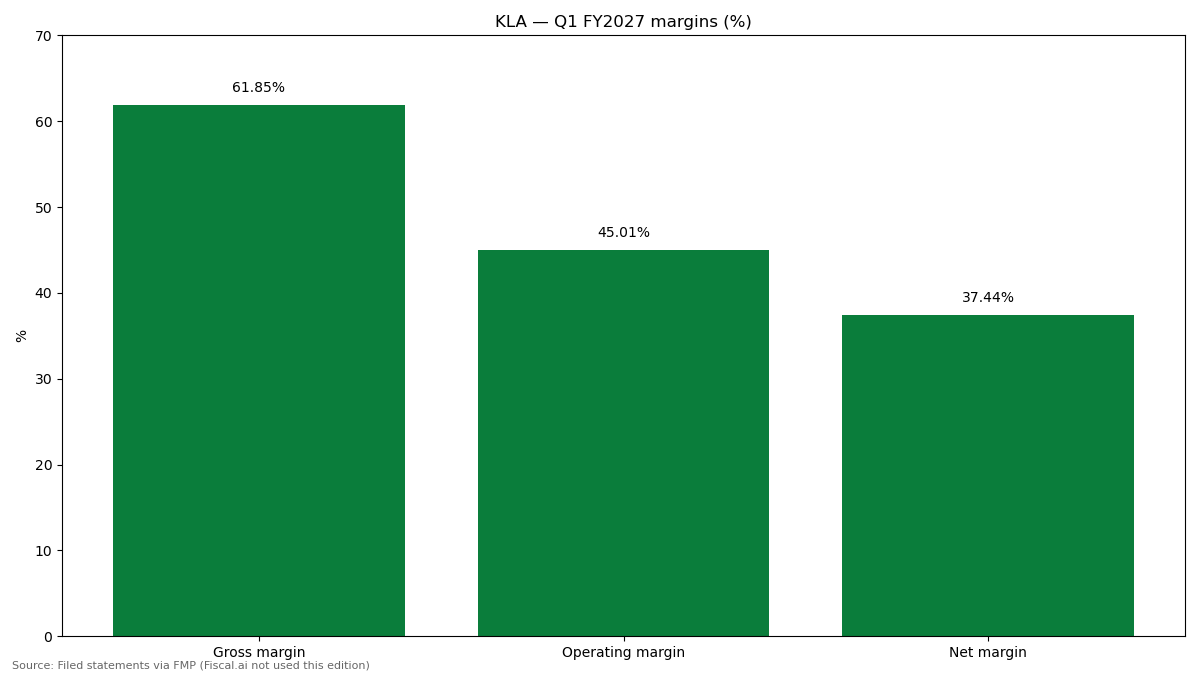
Q1 FY2027 margins, filed figures. Source: Filed statements via FMP (Fiscal.ai not used this edition).
The long view
One quarter is weather; five years are climate. Four lenses, the same ones every time, on the filed record.
Revenue growth. Growth is the first quality test for an equipment name, because wafer-fab equipment is cyclical. Revenue compounded at 14.44% a year over five years; the three-year pace is 8.96%, so the check says the long record slowed before it re-accelerated — the filed quarterly series shows growth stepping up through September 2025 to September 2026, culminating in +28.86% YoY. Judgment: the long record is a compounder that slowed, then re-accelerated — the debate is whether the new pace is a cycle peak or a higher inspection-intensity plateau.
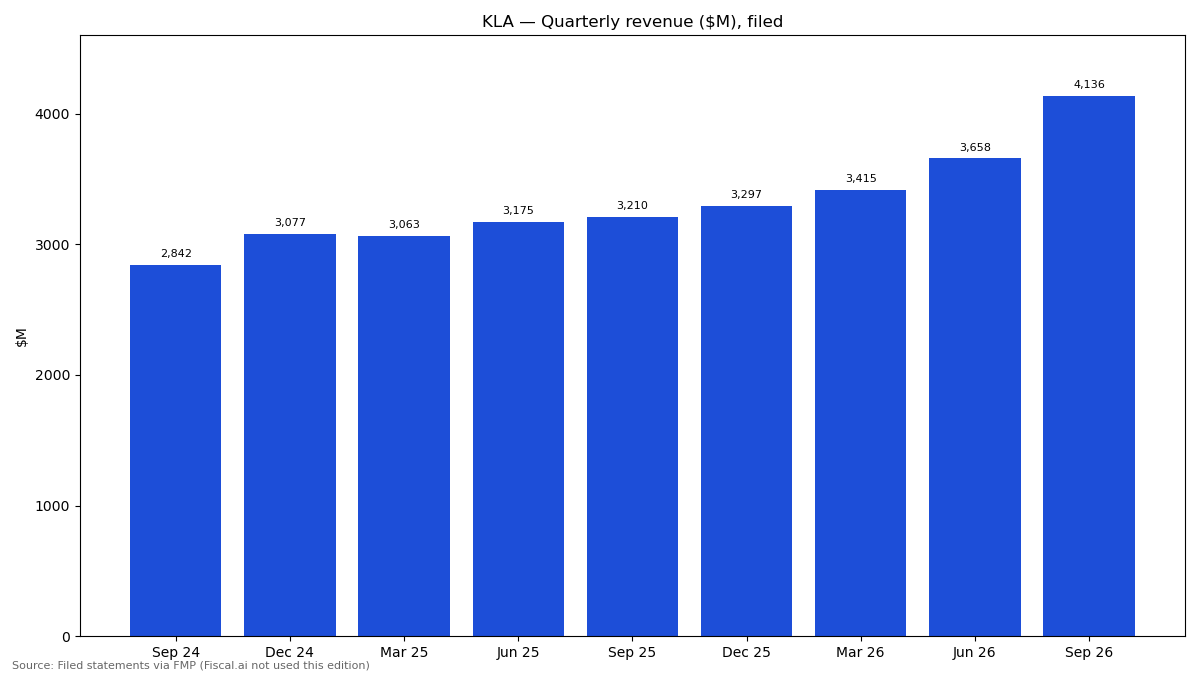
Quarterly revenue, September 2024–September 2026, filed figures. Source: Filed statements via FMP (Fiscal.ai not used this edition).
Operating margin. Margin tells you whether growth is being earned on pricing power or on volume alone. The long-window gross margin is 61.30% and net margin 35.57%; this quarter printed above both, at 61.85% gross, 45.01% operating and 37.44% net, with operating margin up 335 basis points year over year. Judgment: sustained 60%-plus gross margin through an equipment cycle is the strongest single evidence for KLA's pricing power.
Cash. Cash is where equipment earnings can flatter. Five-year free cash flow compounded at 14.04% a year — 4.22% over three years — and free cash flow per share at 17.77% over five years, while five-year operating cash flow stands at 100.83% of net income. This quarter converted 86.28%. Judgment: cash quality is good — conversion near 100% over five years supports the earnings.
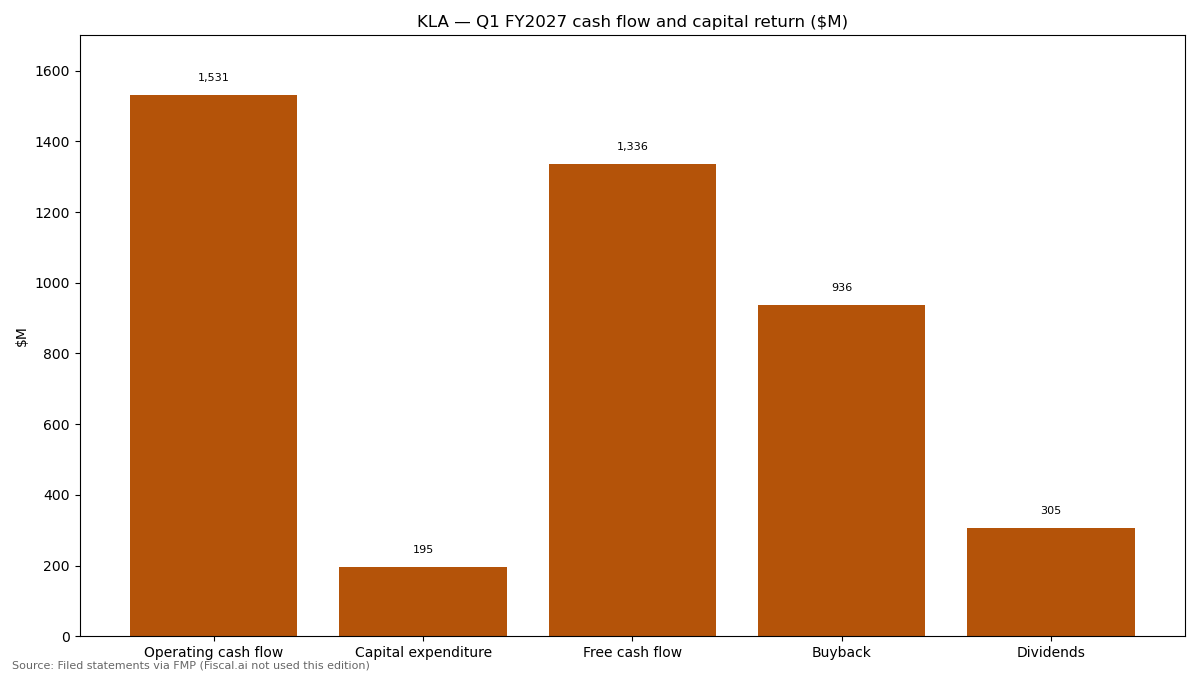
Q1 FY2027 cash flow and capital return, filed figures. Source: Filed statements via FMP (Fiscal.ai not used this edition).
Return on invested capital. ROIC asks what the installed base earns on everything invested in it. KLA's five-year ROIC is 33.88%, with return on capital employed at 38.66% — elite by any industrial standard — and earnings per share compounded at 22.31% over five years. Judgment: returns are the reason this business commands attention through a cycle at all — a 34% five-year ROIC with a 61% gross margin is a competitive advantage in arithmetic. The argument is never about whether the business is good; it is about what the current price already assumes.
Beyond the print — the business this quarter
The earnings release is the scoreboard. Sourcing in this section is deliberately thin and flagged: it rests on the print itself and on the wider equipment-spending picture, not on a verified current-quarter call.
Revenue acceleration is itself a business development (quarter, per the filed print). A sequential jump from $3,657.6M to $4,136.0M, after four quarters of gradual steps, says end-demand for process control stepped up in the September quarter rather than merely staying firm. In an equipment cycle, KLA's print is a read-across in both directions: it corroborates equipment strength, and it will be tested by peers.
The next external datapoint is already scheduled: Applied Materials in mid-November. If Applied Materials confirms equipment demand and packaging strength, KLA's acceleration gains an external witness; if it softens, KLA's quarter looks more company-specific — or more like demand pulled forward. Either outcome is informative.
What is not in this section, and why: a line about elevated memory pricing appears in the materials supplied for this quarter, but it comes from the wrong-quarter transcript on file. It is excluded here rather than presented as a current-quarter development. Developments that cannot be traced to the correct quarter do not belong in a section that claims to report the quarter.
What management said — Q1 FY2027 (filing-only; transcript gap)
This section normally reports what management guided and claimed, in their own words. This edition cannot do that honestly, and says so instead of substituting another quarter's words.
The transcript on file for KLA is a March-quarter 2026 call served for the September quarter. No verbatim current-quarter quotes are presented here. One guidance-style line in the materials — about elevated memory pricing persisting through at least calendar 2026 — originates in that wrong-quarter transcript and is not presented as current-quarter commentary anywhere in this post; the mismatch itself is the reported fact.
From the filings and the reported classification: guidance is maintained, with no raise or cut flagged; margins are gross 61.85%, operating 45.01% and net 37.44%; capital return in the quarter was repurchases of $935.8M and dividends of $305.1M; operating cash flow was $1,530.9M and free cash flow $1,336.2M.
The Key Issue — can inspection share gains and China de-risking be verified — and does it matter at the current valuation?
Thesis: KLA's filed quarter proves profitability and acceleration. The two claims that would justify the next leg — that KLA is gaining inspection share, and that its China exposure is de-risking — are precisely the claims that cannot be verified from the materials on file, because the current-quarter call is not among them. The question is how much proof an investor needs now, at this price, and how much can arrive later.
Evidence for — "the moat is enough"
Margins of 61.85% gross and 45.01% operating are not explained by a rising equipment tide alone — they require pricing power inside the fab. Revenue rose 28.86% YoY with free-cash-flow conversion of 86.28%, a five-year ROIC of 33.88%, and equipment spending marked as strengthening in the research followed for this series, with leading-edge inspection intensity and advanced packaging demand as named drivers. On this view, verification arrives soon enough — starting with peer results in mid-November — and business quality carries the case.
Evidence against — "proof and price are both missing"
The transcript is unverifiable, so share and China mix are assertions without a current-quarter source; China export exposure remains unquantified here. Valuation is full: a trailing multiple of 42.11x and a free-cash-flow yield of only 1.83%, with the shares still 48.38% below their 52-week high and 14.47% below their 200-day average on the long-window series. Equipment cyclicality, if AI capital spending pauses, is the standing downside: KLA's own quarterly series shows how quickly growth can step down to the $2,841.5M–$3,209.7M range seen from September 2024 to September 2025.
What to watch
(1) The correct current-quarter call, or the next print, for share and China mix — the verification channel this edition lacked. (2) External datapoint: Applied Materials' mid-November print as an independent check on equipment demand. (3) Whether revenue stays at the new $4B-plus level or reverts toward the prior $3.2–3.7B quarterly range. (4) Historical analogy (the company's own precedent, labelled as such): KLA's prior equipment cycle as visible in the filed quarterly series — a long, flat $2.84–3.21B stretch from September 2024 to September 2025, followed by acceleration — proves both that this business can tread water for a year and that inspection demand can step up sharply when complexity spending returns. (5) The chart: a move back above the 200-day average at $182.09 would change the timing picture. The forward question: when verifiable management evidence on share and China finally arrives, will it confirm a higher inspection-intensity plateau — and will the price still leave room to act on it?
Sources: KLA's filed Q1 FY2027 financial statements via FMP (scoreboard, income statement, margins, cash flow and balance sheet, reaction and consensus estimates); the quarterly revenue history and next-quarter consensus from the same estimates data (consensus price target unavailable and therefore omitted). Management commentary is filing-only in this edition: the earnings-call transcript on file belongs to another quarter, as flagged in the text.
Disclosure: This post is general information and analysis, not financial advice and not a recommendation to any person.