Meta Platforms: The Headline Beat Was Real — Free Cash Flow Went Negative for the First Time
Meta Platforms beat on both lines on October 21 — EPS 7.40 vs 6.54 expected (+13.15%), revenue $64.60B (+1.99% vs estimate, +26.07% YoY) — then posted a 20.10% operating margin, down 1,997 basis points year over year, and its first negative free cash flow quarter in this nine-quarter series, -$1,156

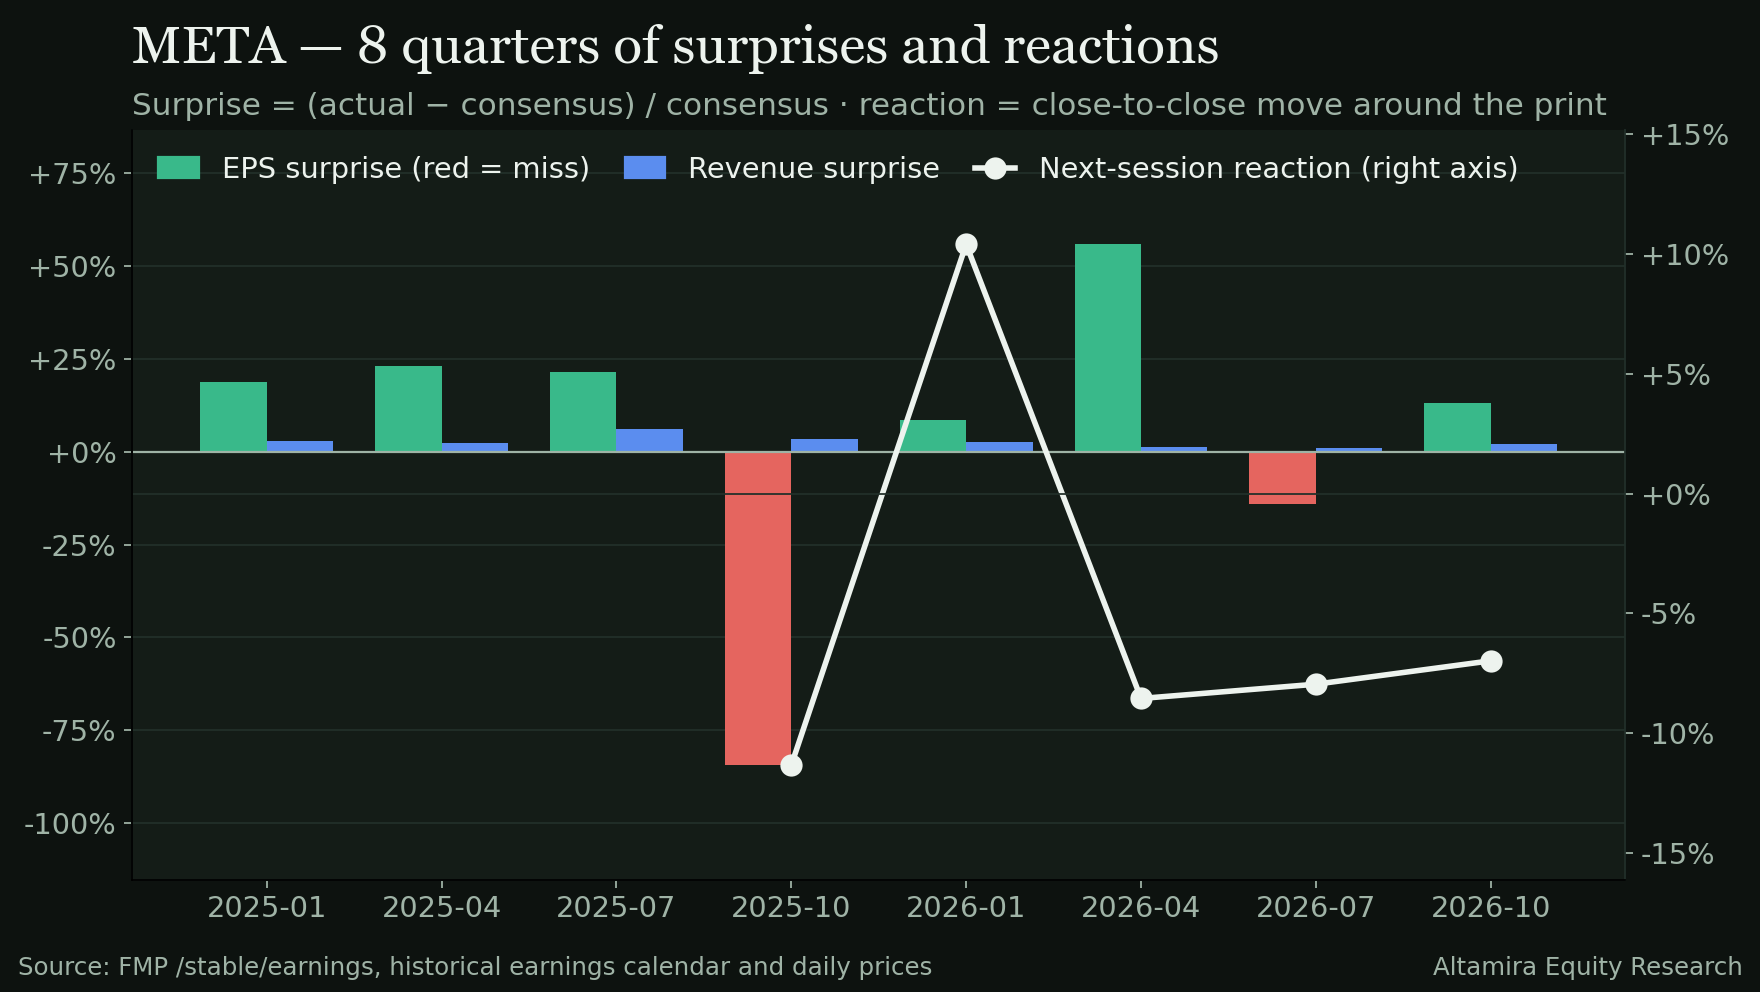
Revenue $64.60B, +1.99% vs estimate and +26.07% YoY · EPS 7.40 vs 6.54 expected (+13.15%) · operating margin 20.10%, −1,997 bp YoY · free cash flow −$1,156.0M, the first negative quarter in this series · stock −6.98% on the print, −3.89% since
The story in 30 seconds
- Meta Platforms cleared both bars on its October 21 print: EPS of 7.40 beat the estimate by 13.15% and revenue of $64.60B beat by 1.99% and grew 26.07% year over year, a grade B on our rubric.
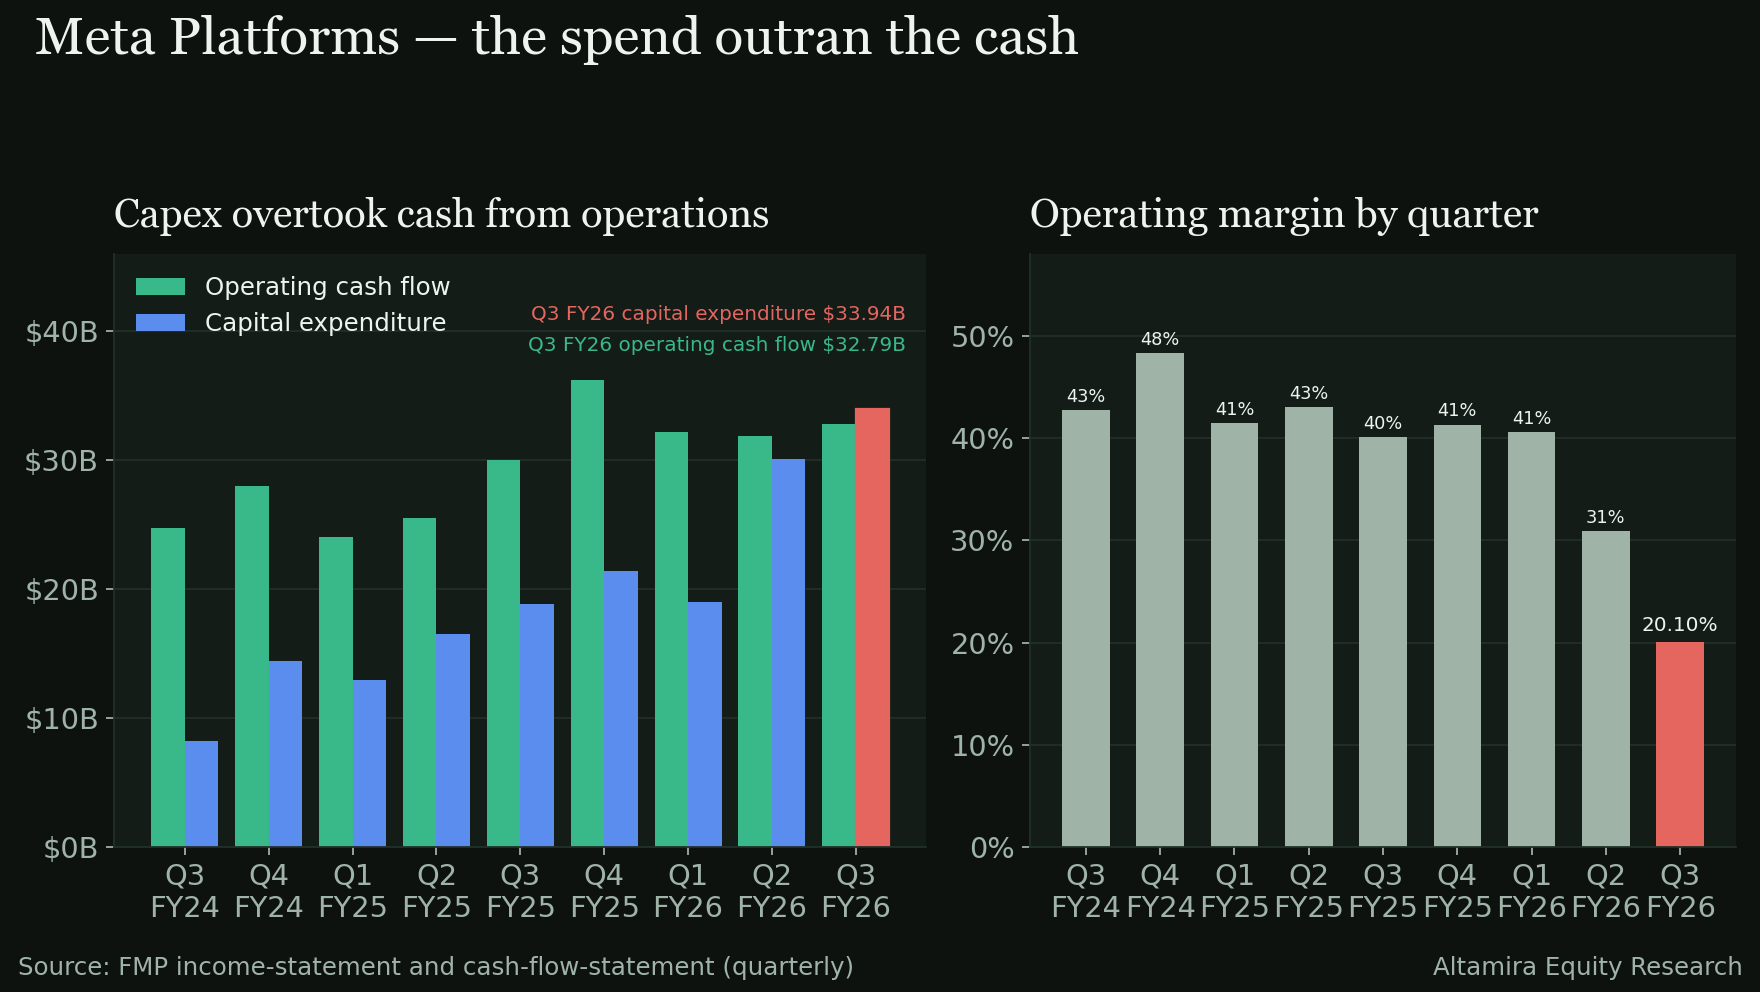
- The quarter underneath moved the other way. Operating margin fell to 20.10%, down 1,997 basis points year over year, and free cash flow turned negative — -$1,156.0M, the first negative quarter in the nine quarters of filed data in this pack — as capital expenditure of $33.94B outran operating cash flow of $32.79B.
- The open question is whether the negative free-cash-flow quarter is a one-quarter infrastructure build-out or the new cost base; the January 27, 2027 print is the first place it will show.
Meta Platforms reported its third fiscal quarter on October 21, 2026. Read quickly, this is a company that beat on revenue and earnings per share again and grew the top line above 26% — a reader skimming the headline would expect a muted-to-positive reaction. The stock fell 6.98% close to close instead, and has fallen a further 3.89% since. The reason sits one layer down: operating margin, which has run between 34% and 42% every full year since FY2020, printed 20.10% for the quarter, and free cash flow — positive in every one of the eight quarters before this one in the filed record — went negative.
Meta's net income for the quarter, $9,860.0M, was up 263.97% year over year, a figure that on its own would read as an acceleration. It is not: the year-ago quarter (Q3 FY2025) itself missed EPS estimates by 84.38%, one of the two worst quarters in this eight-quarter surprise history, which depresses the base the current quarter is compared against. Operating income, which does not share that distortion, fell 36.75% year over year — the cleaner read on where the quarter actually moved.
In this post: (1) the quarter against the beat and the market's larger-than-average reaction; (2) where the revenue dollar went, in one chart; (3) what to make of the net-income distortion and the first negative free-cash-flow quarter on record here; (4) the five-year record against this one quarter; (5) the honest counterweight and the Key Issue for January.
At a glance — Q3 FY2026
- Revenue: $64.60B vs $63.34B expected · +1.99% surprise · +26.07% YoY
- EPS: 7.40 vs 6.54 expected · +13.15% surprise (earnings-calendar basis). GAAP diluted EPS from the filed income statement was 3.83, +264.76% YoY — a different basis than the figure above; the pack does not reconcile the two series for this quarter, and this note states both rather than picking one.
- Guidance: NOT STATED — the earnings-call transcript is not in the dataset; no guidance class is assigned and none is invented here.
- Reaction: −6.98% close to close, from 697.52 (2026-10-21) to 648.85 (2026-10-22) · 0.8× the 8-quarter average absolute move of 9.04%
- Margins: gross 79.31% (−273 bp YoY, −206 bp QoQ) · operating 20.10% (−1,997 bp YoY, −1,077 bp QoQ) · net 15.26% (+998 bp YoY, −1,080 bp QoQ)
- Cash generation: operating cash flow $32.79B · capital expenditure −$33.94B · free cash flow −$1,156.0M, −1.79% of revenue (−2,359 bp YoY, −466 bp QoQ) · free cash flow to net income −11.72%
- Share count and capital return: diluted shares 2,573,000,000, +0.04% YoY and +0.27% QoQ · dividends paid −$1,361.0M · buybacks $0.0M
- Balance sheet: cash & short-term investments $82.45B · total debt $112.09B · net debt $100.87B · shareholders' equity $272.39B · goodwill and intangibles $23.42B
Since the print: the stock closed at 648.85 the session after the print (2026-10-22) and has traded down to 623.61 as of November 12 — a decline of roughly 3.89% that extended the post-print move rather than reversing it, even as the shares sit only 1.21% below their 200-day average and remain 2.40% above where they traded twelve months ago.
The quarter in one line: the beat on the numbers the street watches was real; the cash and margin lines moved sharply the other way in the same quarter, and the market's larger-than-usual decline, extended in the three weeks since, read that correctly.
Q3 FY2026 flow — where the revenue dollar went
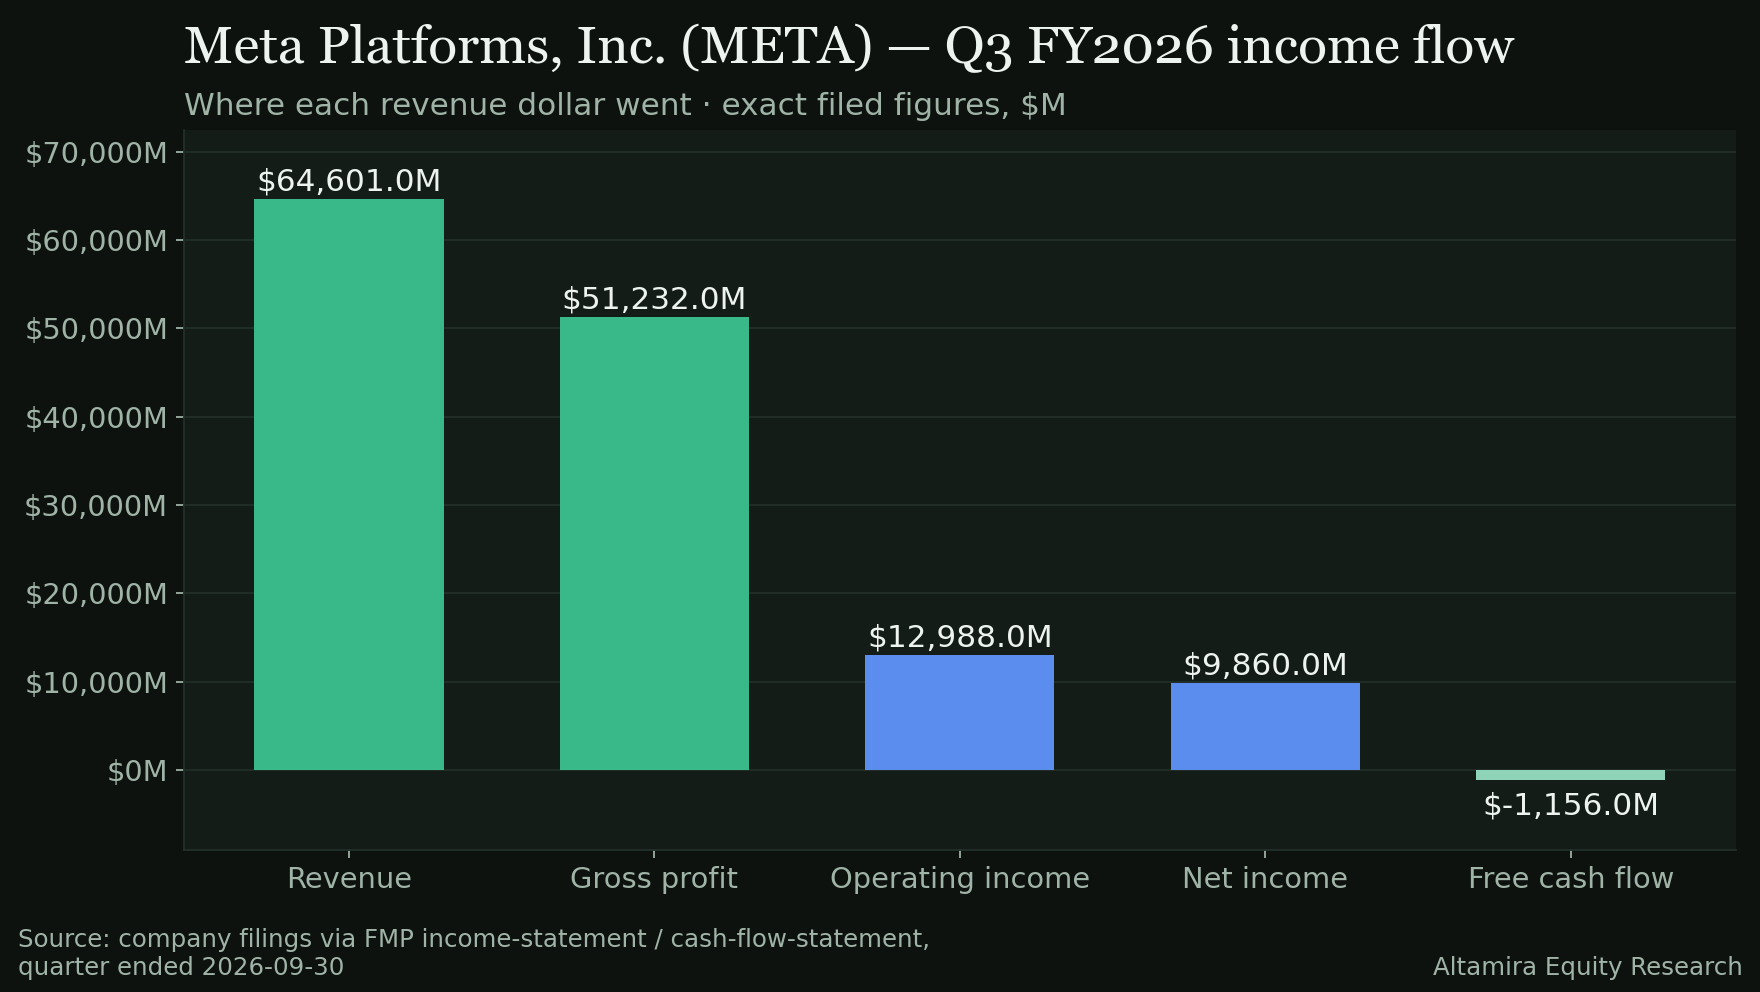
- Revenue: $64.60B (100.00%)
- Cost of revenue: $13.37B (20.69%)
- Gross profit: $51.23B (79.31%)
- Operating expenses: $38.24B (59.20%) — R&D $20.05B (31.04%), SG&A $18.19B (28.16%)
- Operating income: $12.99B (20.10%), −36.75% YoY
- Pre-tax income: $13.00B (20.13%)
- Income tax: $3,141.0M (4.86%)
- Net income: $9,860.0M (15.26%)
- Free cash flow: −$1,156.0M (−1.79%)
The swing item is capital expenditure: $33.94B against operating cash flow of $32.79B is the direct arithmetic reason free cash flow went negative, even as the 79.31% gross margin barely moved (−273 bp year over year) and the income statement above the operating line stayed intact.
What to make of this print
Six readings, each a finding plus what it means.
- Revenue growth held above 26% for a third straight quarter, though the pace has slowed from two quarters ago. $64.60B grew 26.07% year over year, down from 27.96% last quarter and 33.08% the quarter before that. The deceleration is two data points, not yet a trend call.
- Operating margin compressed sharply. 20.10%, down 1,997 basis points year over year and 1,077 basis points from the quarter before, as R&D (31.04% of revenue) and SG&A (28.16%) together consumed 59.20% of revenue against a gross margin that was essentially flat.
- Quality of earnings: the net-income YoY figure is the wrong number to anchor on. Net income of $9,860.0M, up 263.97% year over year, is being compared against a quarter (Q3 FY2025) that itself missed EPS estimates by 84.38% — one of the two weakest prints in the eight-quarter history here. Operating income, unaffected by that prior-year item, fell 36.75% year over year and is the more honest read on the quarter's direction.
- Free cash flow turned negative for the first time in this series. −$1,156.0M, −1.79% of revenue, down 2,359 basis points year over year and 466 basis points sequentially, as capital expenditure of $33.94B exceeded the quarter's $32.79B of operating cash flow.
- Share count was essentially flat. Diluted shares of 2,573,000,000 were up 0.04% year over year and 0.27% sequentially — unlike the margin and cash lines, this one did not move.
- The balance sheet still carries room. Cash and short-term investments of $82.45B against net debt of $100.87B and shareholders' equity of $272.39B, with a trailing net debt/EBITDA of 0.95, leave headroom to run a negative-free-cash-flow quarter without financing pressure.
Takeaway: the business grew revenue above 26% and beat on both headline lines again; the spending behind that growth — R&D, SG&A and, most directly, capital expenditure — pushed free cash flow negative for the first time in the nine quarters on record here, and the market's reaction, extended in the weeks since, is reading the spending line more than the beat.
The long view — FY2020 to FY2025
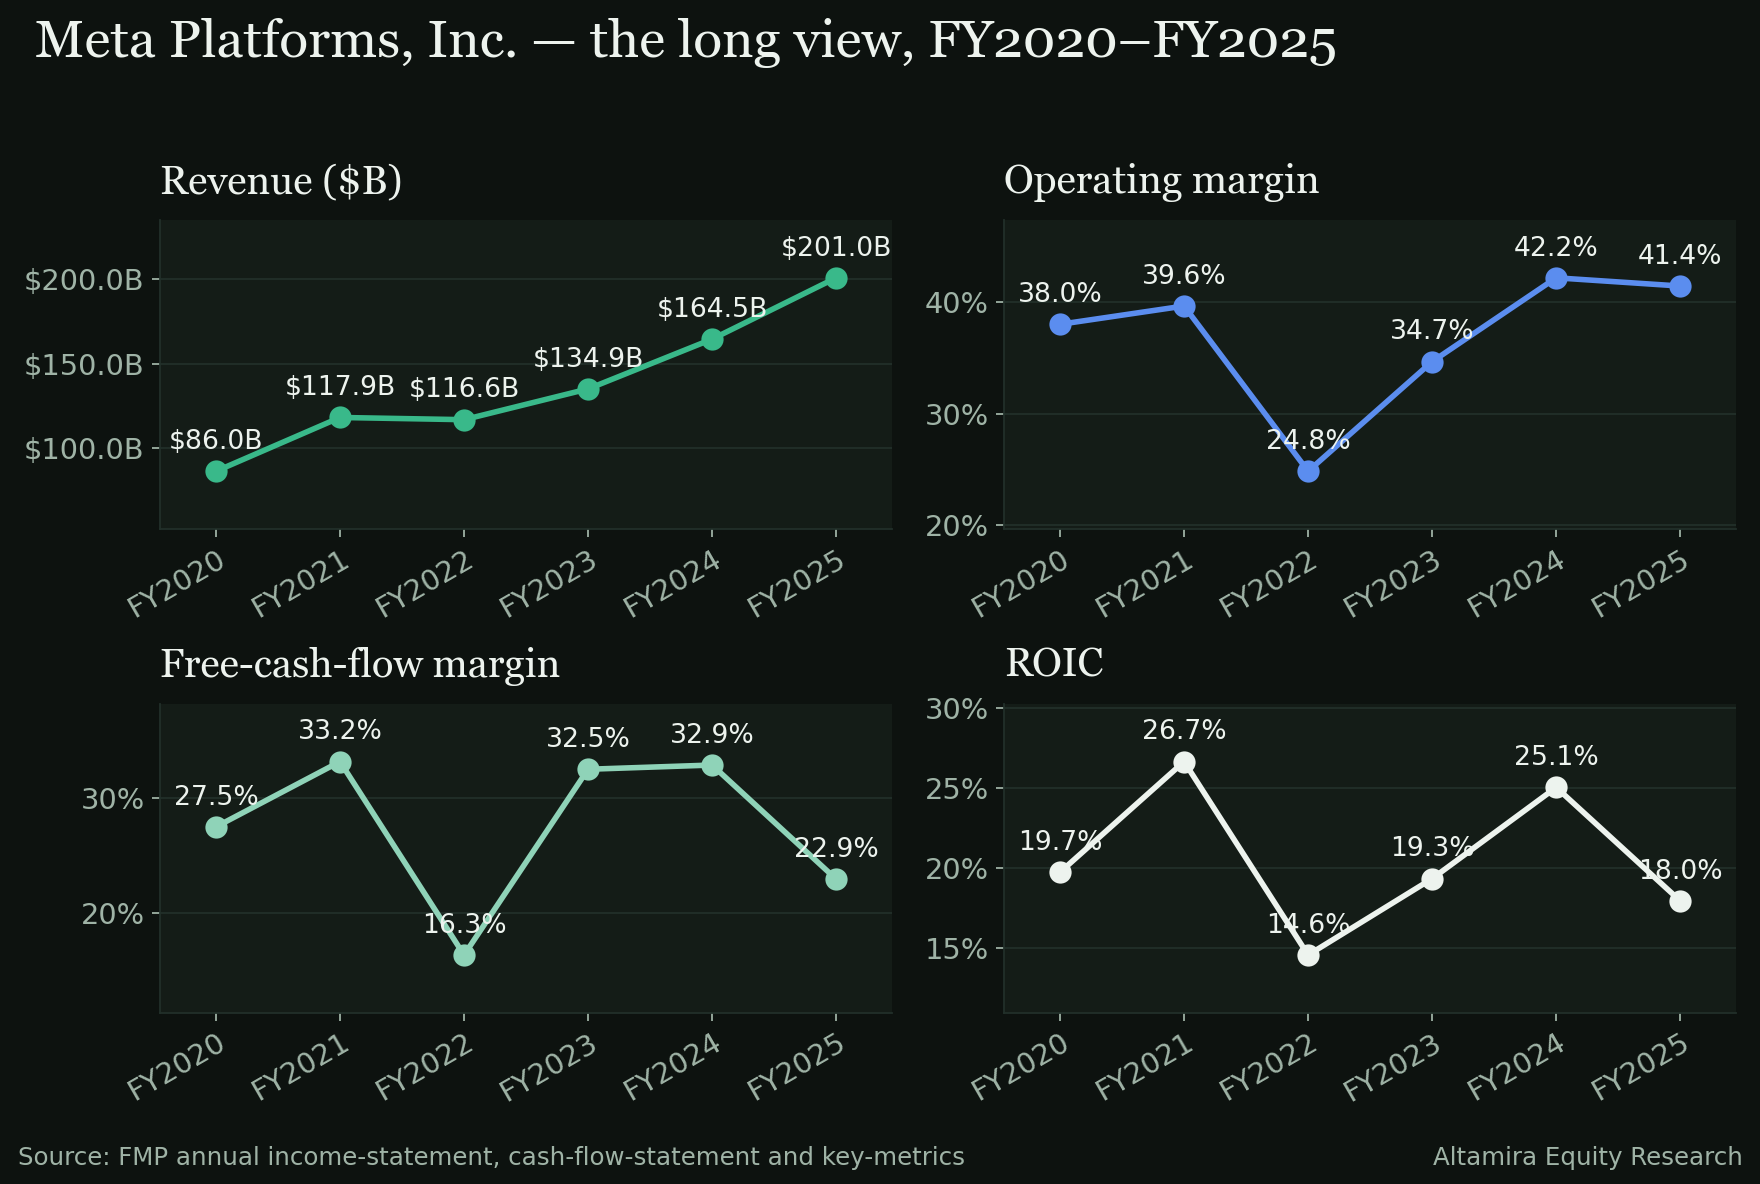
- Revenue growth. $85.97B in FY2020 to $200.97B in FY2025, an 18.51% compound rate — more than doubling in five years.
- Operating margin. 38.01% in FY2020 to 41.44% in FY2025, a net 343 basis points of expansion reached unevenly: a trough of 24.82% in FY2022, then 34.66% in FY2023 and a peak of 42.18% in FY2024. The third quarter's 20.10% sits below every one of those five annual figures.
- Cash. Free-cash-flow margin moved from 27.49% in FY2020 to 22.94% in FY2025, with free cash flow compounding at 14.30% a year — slower than the 18.51% revenue rate even before this quarter's negative print.
- Returns on capital. ROIC of 19.74% in FY2020 rose to a peak of 26.67% in FY2021, fell to 14.56% in FY2022, and recovered to 25.05% in FY2024 before easing to 17.95% in FY2025 — the most volatile of the four lenses, and already moving down again before this quarter.
The honest counterweight
Three cells argue against reading this quarter as simply a spending choice that will reverse on its own.
- Technical score 42.2, state MIXED, tier 3. The Altamira KPI Scorecard's November 12 edition has Meta at a fundamental composite of 70.1 (quality 82.0, moat 82.5, health 89.1) but a shareholder pillar of just 39.7 and a technical score of 42.2, producing a blended total of 61.7, rank 113, delta −1.5. The fundamentals are strong; the shareholder-return and trend cells are not.
- Revenue growth has slowed for two straight quarters. 33.08% to 27.96% to 26.07% year over year is a short run, but it is a direction, and it is the same two quarters in which operating margin and free cash flow both weakened.
- The stock already trades well below the one published fair value. At the November 12 close of 623.61 against a Morningstar fair value of 850.00, the margin of safety is 26.03% — the market is not pricing a structural break even after a nearly 7% post-print decline, which cuts against treating this quarter as more than a spending-driven air pocket.
The Key Issue
Whether the capital-expenditure-driven negative free-cash-flow quarter is a one-quarter infrastructure build-out or a new spending pattern. The January 27, 2027 print — consensus revenue of $75.04B (+25.28% YoY implied) and EPS of 8.38 — and the FY2025 full-year free-cash-flow margin of 22.94% are the benchmarks the next quarter will be read against.
Thesis verdict: Strained Grade B
Revenue grew 26.07% and both headline lines beat the street again — the growth franchise held. Operating margin fell 1,997 basis points year over year and free cash flow turned negative for the first time in this series, and the market's reaction has extended rather than reversed in the three weeks since; that combination is more than a single counterweight cell, which is why the verdict sits at Strained rather than Intact.
Sources
- FMP /stable/earnings (actuals vs consensus, eight quarters), /historical/earning_calendar/META (report timing), /historical-price-full/META (daily closes; moving averages, ranges and the close-to-close reaction computed from them) — pulled November 13, 2026.
- FMP /income-statement, /cash-flow-statement, /balance-sheet-statement (quarterly, nine quarters; the Q3 FY2026 statements filed October 22, 2026) and the annual statements plus /key-metrics for FY2020–FY2025 — pulled November 13, 2026.
- FMP /analyst-estimates and /key-metrics-ttm — pulled November 13, 2026.
- Altamira KPI Scorecard, edition 2026-11-12 (kpi-scorecard-2026-11-12.json): composite, pillar and technical scores, tier, state and fair-value cells as published. Fair value is stated as published in the dataset.
- Guidance, segment detail and management commentary: NOT STATED — the earnings-call transcript is not in the dataset for this edition.
Research for information only — not investment advice; see Disclosures.
On the data pages
- META company page — the filed figures, margins, cash flow and the print history, from SEC EDGAR.
- META vs NFLX, head to head — the two on the same scorecard cells (top composite in Communication Services (kpi-scorecard-2026-11-12.json)).
- Verdict ledger — every public call, on the record.
- Earnings schedule — who reports next, and how every print this season graded.