Microsoft: Azure Finally Has a Price Tag — $33 Billion, and Accelerating
Microsoft did the thing the market had stopped expecting: it made Azure bigger and faster at the same time. For the first time, Azure has a dollar figure — $33,170M in the quarter, up 48.2% year over year, after +42% in the June quarter on the restated basis.

Azure revenue +48% to $33,170M in its first-ever dollar disclosure · total capex $45,200M with more than $50,000M guided for next quarter · free cash flow −27% to $18,633M as the build-out absorbs the beat
Company Insights · Microsoft (NASDAQ: MSFT) · Q1 FY2027 (quarter ended September 30, 2026), reported Wednesday, October 28, 2026 after the close
The story in 30 seconds
- Microsoft beat on both lines — revenue $92,279M (+18.8% YoY), adjusted EPS $4.89 — and Azure grew 48% to $33,170M in its first dollar disclosure, with next quarter guided higher still.
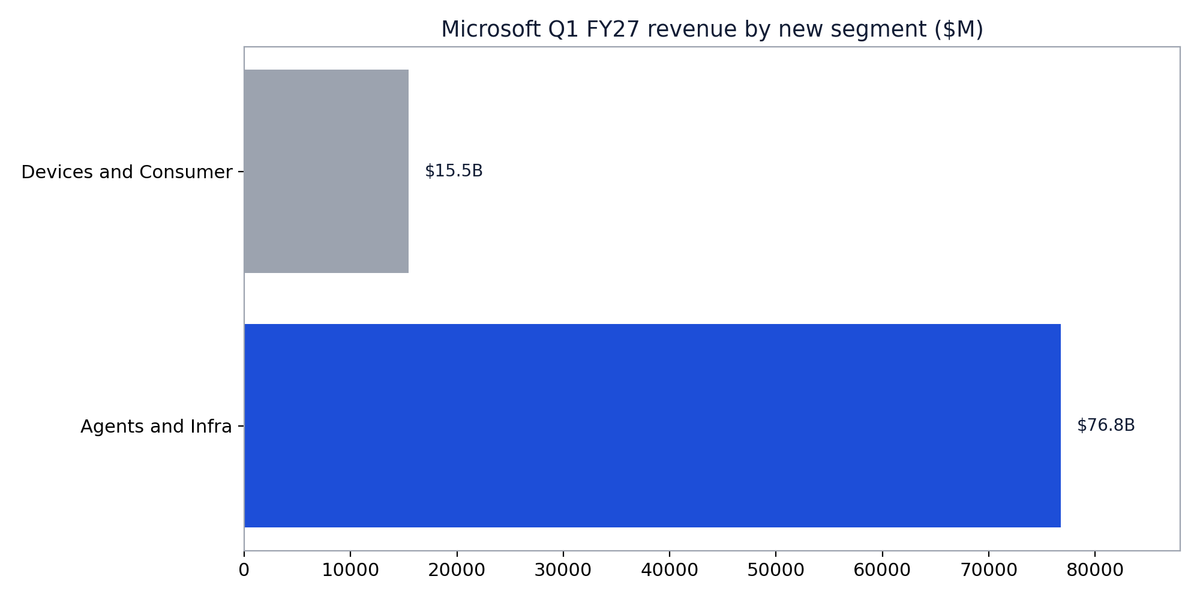
- The new reporting structure makes the strategy explicit: "Agents and Infra" is now 83.2% of the company, at a 52.8% operating margin.
- The cost sits in the cash flow statement: capex doubled year over year and free cash flow fell 27%. How long that trough lasts is the whole investment question.
Microsoft did the thing the market had stopped expecting: it made Azure bigger and faster at the same time. For the first time, Azure has a dollar figure — $33,170M in the quarter, up 48.2% year over year, after +42% in the June quarter on the restated basis. The new segment built around it, Agents and Infra, is now 83.2% of the company. The structure itself, set on September 2, 2026, is a statement: Microsoft now reports itself as an AI infrastructure and agents business with a consumer business attached, not the other way round.
The market's response was a shrug with a negative sign: −1.3% after hours, against a ±7.0% average absolute move over eight quarters. That is not disbelief — revenue beat consensus by $1,662M and the Q2 outlook came in above expectations — it is the bill. Cash capex of $39,367M was 103% higher than a year ago; total capex including finance leases was $45,200M, with more than $50,000M guided for next quarter. Free cash flow fell 27% even as net income rose 32%.
So the question this print raises is precise: is the free-cash-flow trough the purchase price of a re-accelerating Azure — in which case it ends — or the new run-rate of competing in AI infrastructure, in which case the valuation framework has to change?
In this post: 1. The print in one picture — where the revenue went. 2. What to make of it — seven readings of the quarter. 3. The long view — five years of growth, margin, cash and returns. 4. The Key Issue — whether Azure's re-acceleration is worth the cash trough.
At a glance — Q1 FY2027
| Revenue | $92,279M vs $90,617M est · +1.83% surprise · +18.8% YoY · +2.5% QoQ |
| EPS (adjusted) | $4.89 vs $4.72 est · +3.60% surprise · GAAP diluted EPS $4.92 |
| Margins | Gross 67.8% (−125 bp YoY) · Operating 49.8% (+88 bp) · Net 39.7% (+397 bp) |
| Cash generation | Operating cash flow $58,000M · Free cash flow $18,633M · 50.9% of net income |
| Capital return | Buybacks $4,379M + dividends $6,757M = $11,136M in the quarter |
| Balance sheet | Cash + short-term investments $64,643M · Total debt $133,931M |
| Backlog | Commercial RPO $677,000M, +73% YoY |
| Reaction | −1.3% after hours to $524.20 (8Q average move ±7.0%) |
The quarter in one line: the eighth consecutive double beat — and the first in which the growth engine was disclosed in dollars: Azure is a $33B-a-quarter business growing at 48%.
Where the dollar went — Q1 FY2027
| Flow | $M | % of revenue |
|---|---|---|
| Revenue | 92,279 | 100.0% |
| Cost of revenue | 29,720 | 32.2% |
| Gross profit | 62,559 | 67.8% |
| Operating expenses | 16,644 | 18.0% |
| Operating income | 45,915 | 49.8% |
| Net other income | 38 | 0.0% |
| Income tax | 9,324 | 10.1% |
| Net income | 36,629 | 39.7% |
Exact filed figures, quarterly income statement for the period ending September 30, 2026. Operating expenses: R&D $9,047M + selling & marketing $5,716M + G&A $1,881M. The effective tax rate was 20.3%.
Half of every revenue dollar reaches operating income — the software annuity is what funds the infrastructure build.
What to make of this print
- Azure re-accelerated, and it is now measurable. Azure revenue of $33,170M (+48.2%) is the fastest growth in at least two years, up from +42% in the June quarter, with Q2 guided to +49–50% in constant currency. The capacity added through 2025–26 is converting into billable demand faster than the market's ~45% expectation — demand is not the problem in the capex debate.
- Quality of earnings — operational, not buyback-driven. GAAP diluted EPS rose 32.3% year over year ($4.92 vs $3.72) while the diluted share count fell only 0.27% (7,446M vs 7,466M). Buybacks of $4,379M roughly offset stock compensation of $3,134M and added about a quarter-point to EPS growth; the rest is operating leverage.
- Operating leverage absorbed the gross-margin slip. Gross margin fell 125 bp YoY to 67.8% — the expected cost of Azure mix — yet operating margin expanded 88 bp to 49.8%, because operating expenses grew just 6% (per the 10-Q) against 18.8% revenue growth.
- The cash trough deepened anyway. Free cash flow fell 27.4% to $18,633M; conversion was 50.9% of net income against a 75.2% five-year average, and cash capex was 42.7% of revenue. Earnings quality and cash quality have decoupled — excellent on the first, strained on the second.
- The backlog says demand is contracted, not hoped for. Commercial RPO of $677,000M is up 73% YoY. The caveat is concentration: revenue from OpenAI alone was $10,000M (10.8% of revenue), and OpenAI was roughly 45% of RPO at December 2025.
- The consumer business is shrinking quietly. Devices and Consumer fell 3.2% to $15,480M — Windows OEM & devices −22.0% and Xbox −2.3%, partly offset by search & advertising +10.3% — while its operating margin rose to 34.6%.
- Copilot monetisation moved to usage — and the seat count went quiet. No Q1 seat count was disclosed; the last figure is 30M+ paid Microsoft 365 Copilot seats in FY2026, with daily users up nearly 50% sequentially (as reported from the call). September's redesign added usage-based Copilot Credits billing on top of seats.
Takeaway: operationally this is the strongest Microsoft print of the AI cycle — the question it leaves is purely financial: how long the cash trough lasts, and who funds it. Shareholders are funding it, through forgone free cash flow.
How Microsoft makes money
The hyperscalers sell computing by the unit on infrastructure whose fixed costs are enormous and whose marginal costs fall with scale, so share and utilisation drive returns. Enterprise software rides on the same installed base: per-seat subscriptions at high gross margins, where AI features are the first credible per-seat price rise in a decade — and usage-based AI billing the first pricing layer on top of the seat. Peers: Amazon (AWS), Alphabet (Google Cloud), Salesforce, CrowdStrike, Palo Alto Networks, Cadence, Autodesk, Intuit and Accenture.
From this quarter Microsoft reports two segments (structure set September 2, 2026; prior periods restated). Agents and Infra — Azure, Microsoft 365 cloud, productivity & server licensing, industry solutions, frontier & support services — is $76,800M (83.2% of revenue, from 79.4% a year ago) at a 52.8% operating margin. Inside it, Azure ($33,170M, +48.2%) is 35.9% of total revenue, from 28.8% a year ago; Microsoft 365 cloud ($27,780M, +17.2%, on commercial seats +5%) is the annuity. Devices and Consumer — search & advertising including LinkedIn Marketing Solutions, Xbox, Windows OEM & devices — is $15,480M (−3.2%) at a 34.6% margin: smaller, slower, still highly profitable. Headquarters: Redmond, Washington; 223,000 employees, with headcount down 2% year over year at September 30 (10-Q); CEO Satya Nadella.
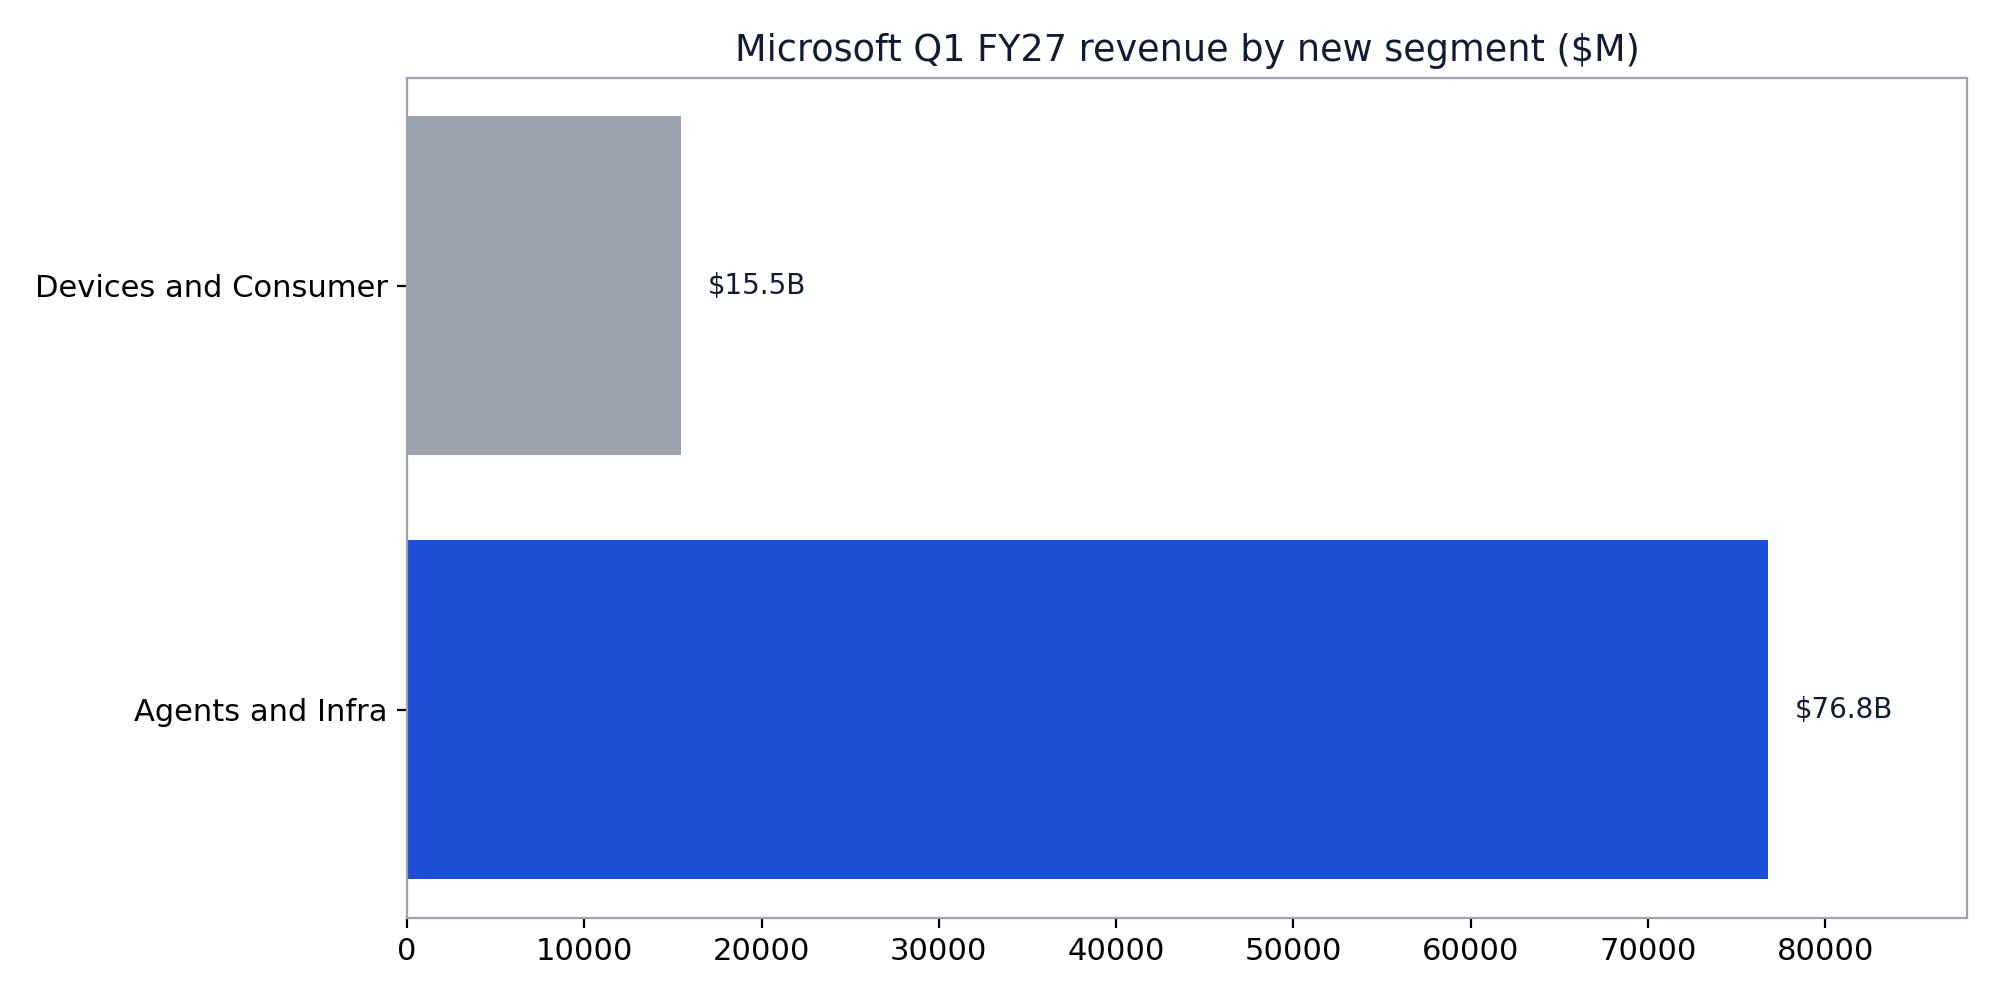
Segment revenue, Q1 FY2027, from the filed 10-Q. Chart rendered from filed figures.
The long view
One quarter is weather; five years are climate. Four lenses, the same ones every time, on the filed record.
Revenue growth. Growth is the first quality test — a platform multiple is only defensible while the platform keeps compounding. Revenue compounded at 14.6% a year over five years (FY2021 $168,088M → FY2026 $331,839M); the two-year pace is 16.4%, so the check says accelerating, and FY2026 itself grew 17.8%. This quarter: +18.8% YoY. Judgment: growth is re-accelerating into the AI cycle, not maturing out of it.
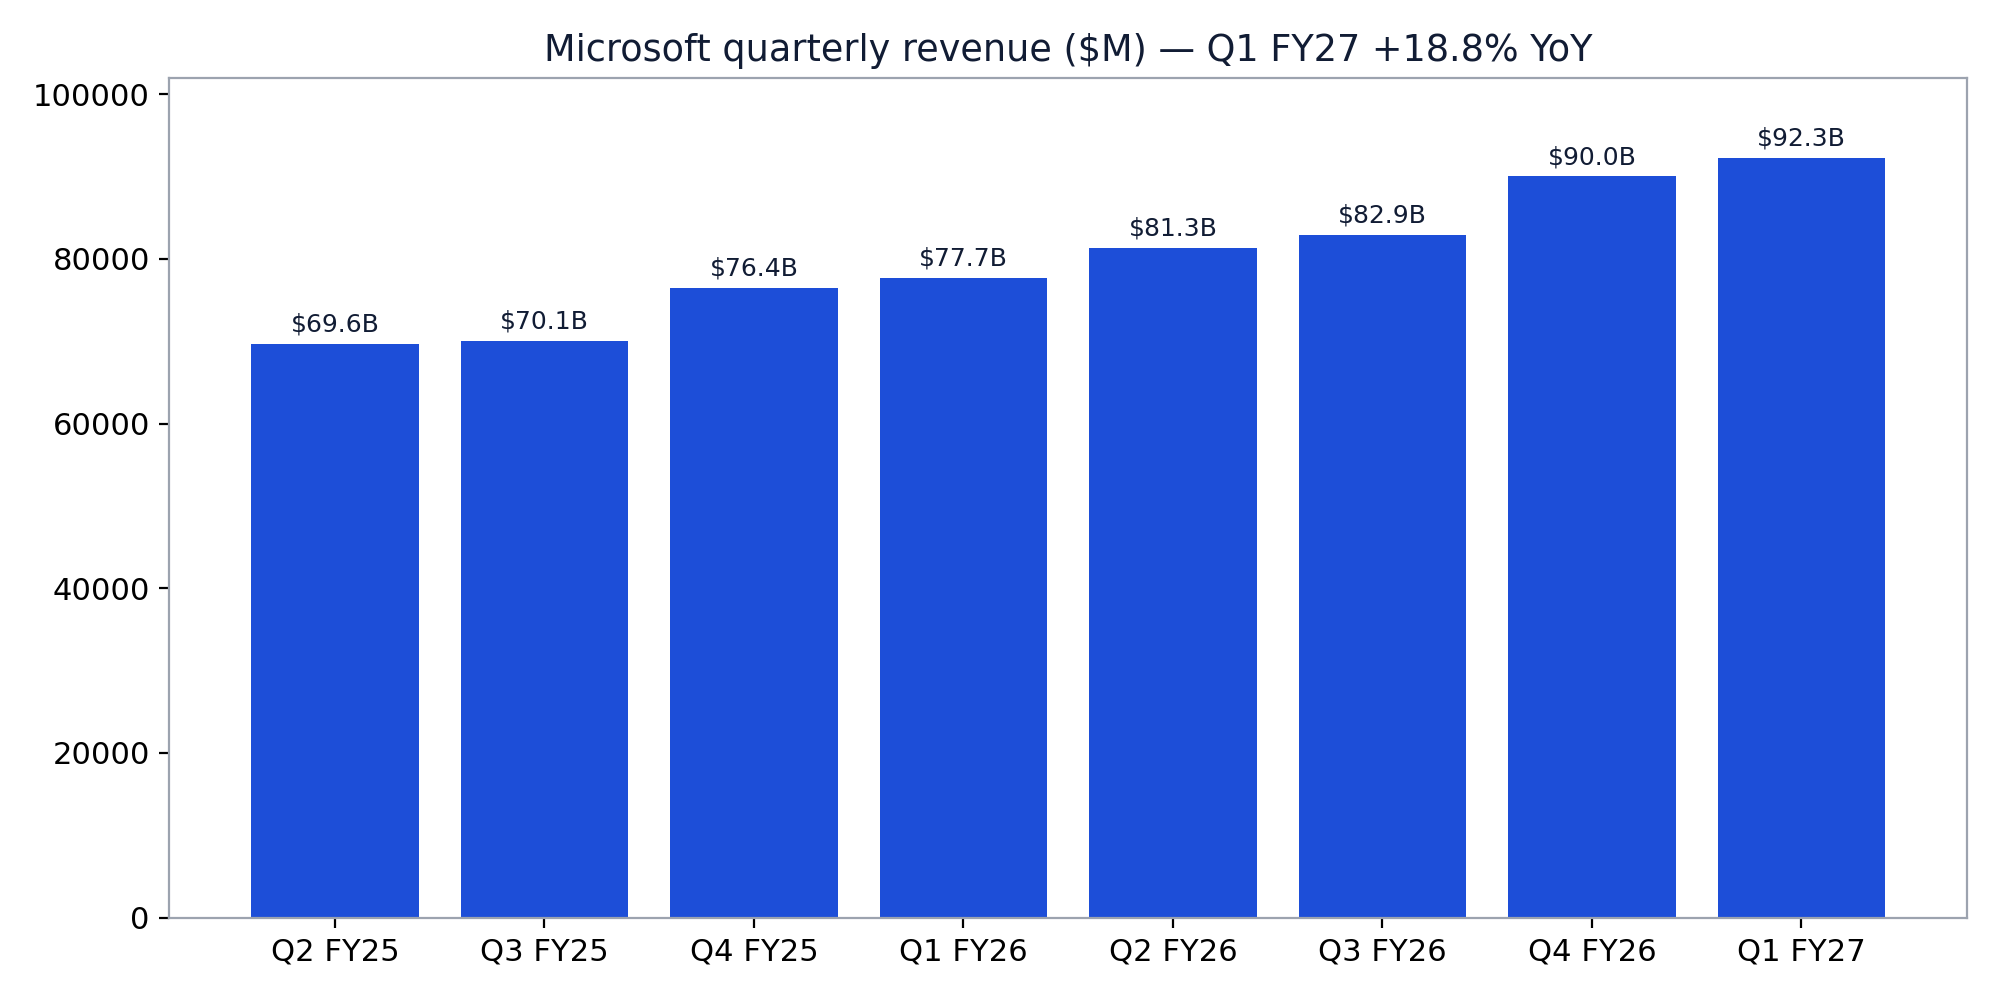
Quarterly revenue, last eight quarters — the step-up through FY2026 into Q1 FY2027. Rendered from filed figures.
Operating margin. Margin tells you whether growth is being earned or bought. Operating margin averaged 44.2% over FY2022–26 and rose through the build-out (42.1% → 41.8% → 44.6% → 45.6% → 46.8%), because the software annuity carries the infrastructure P&L. This quarter: 49.8%, +88 bp YoY. Judgment: the margin structure is expanding — the build-out has so far been funded by mix and cost discipline, not margin sacrifice.
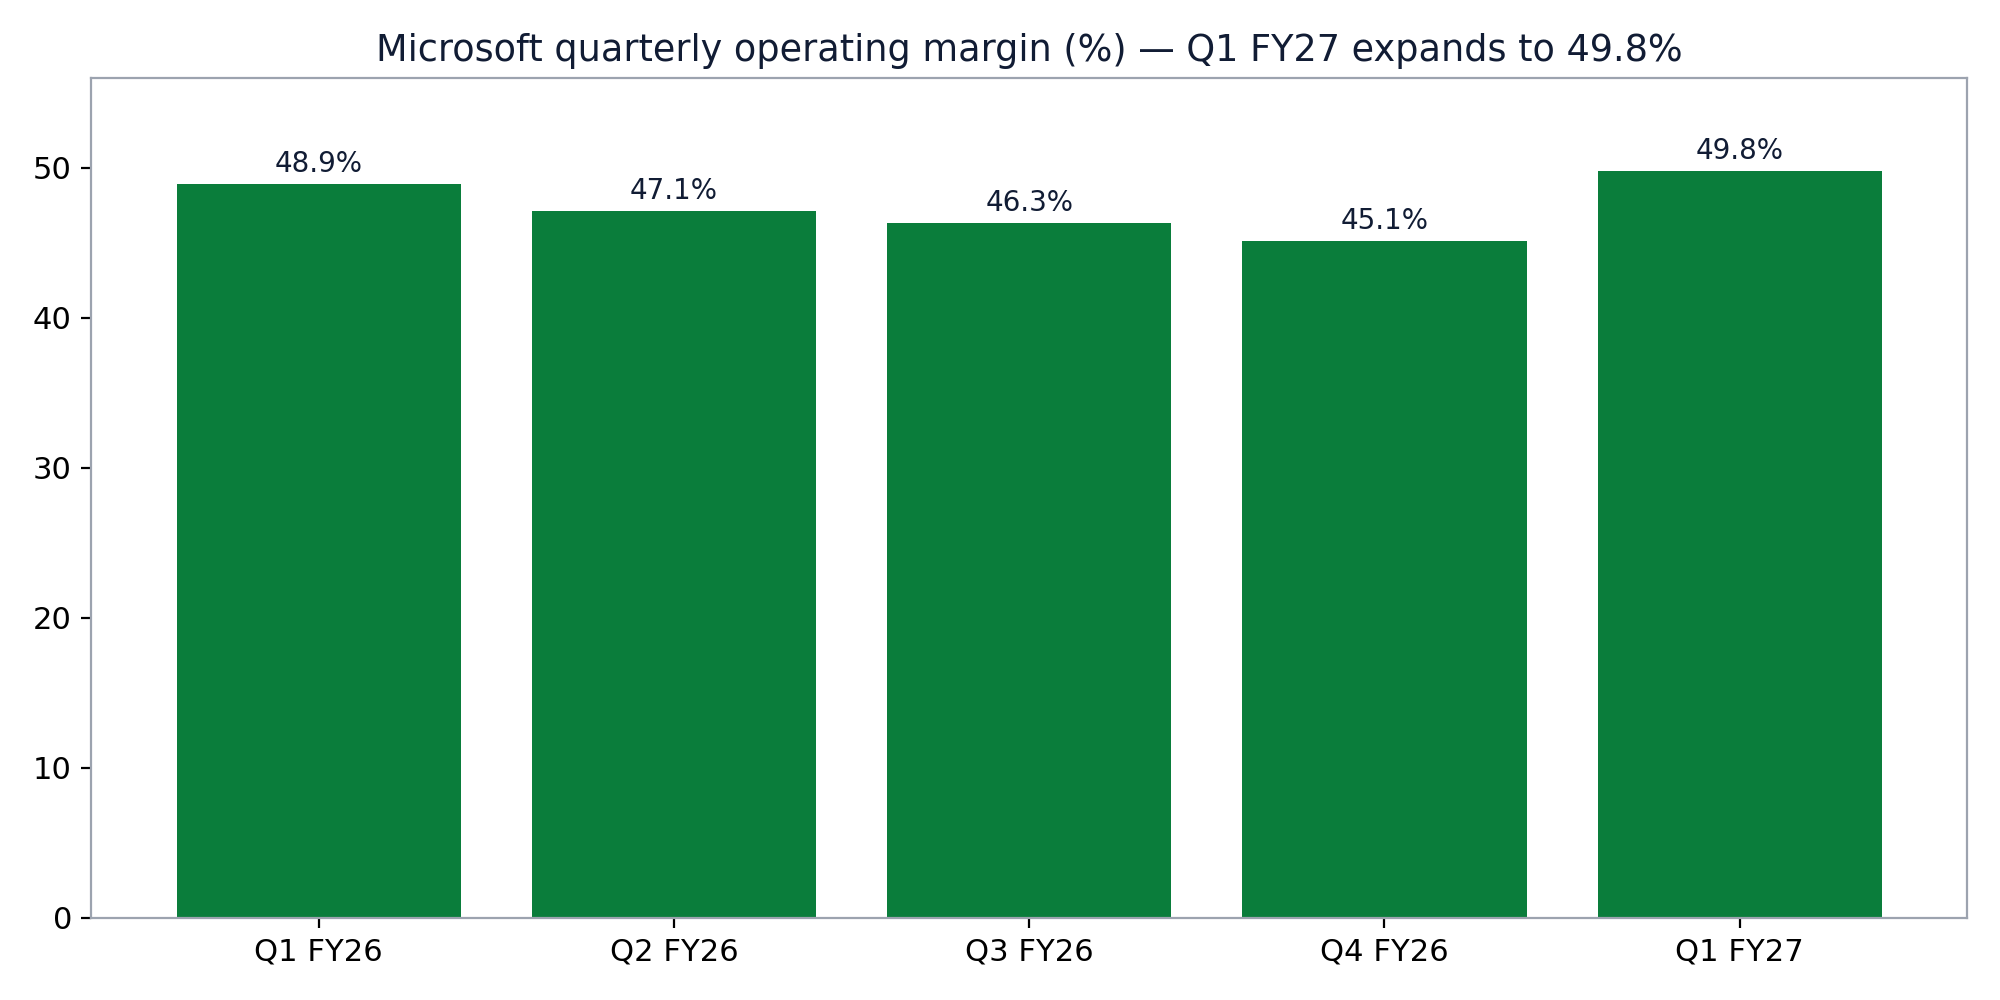
Quarterly operating margin, last five quarters. Rendered from filed figures.
Cash. Cash is where the capex cycle shows up. Microsoft converted an average of 75.2% of net income into free cash flow over five years, but the trend is one-way: free-cash-flow margin fell from 32.9% (FY2022) to 20.2% (FY2026) and conversion from 89.6% to 50.1%. This quarter converted 50.9%, with free cash flow down 27.4% YoY. Judgment: cash is the one deteriorating lens — still enormous in dollars, but the conversion halving is the factual core of the bear case.
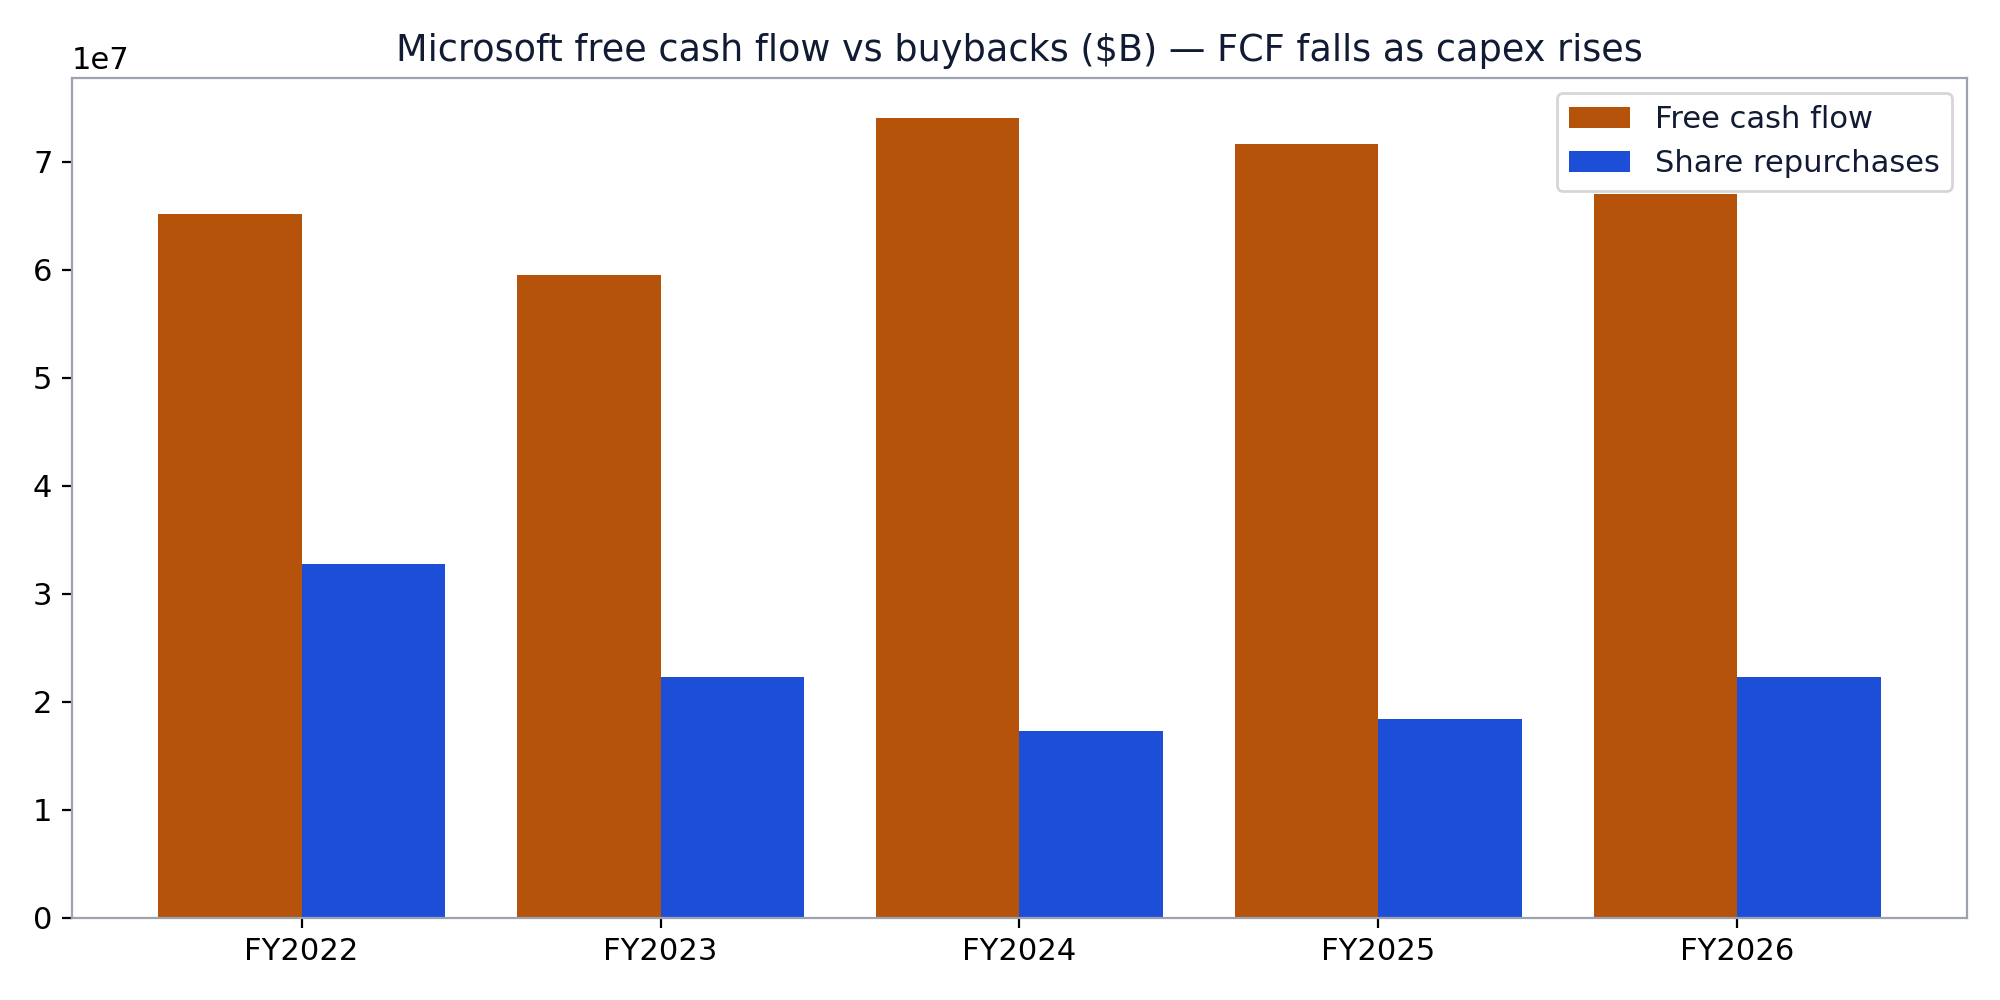
Free cash flow vs share repurchases, FY2022–FY2026. Rendered from filed figures.
Return on invested capital. ROIC asks what the installed base earns on everything invested in it — the test the new capex must ultimately pass. The five-year average ROIC is 22.7%, with return on capital employed at 28.2%. This quarter, operating income grew 21.0% on revenue up 18.8% — returns on the existing base still expand while the new base ($364,600M of data-centre leases signed but not yet commenced) is untested. Judgment: the moat is proven; whether the next $100B+ earns the same 22%+ is the Key Issue, not a settled fact.
Beyond the print — the business this quarter
The earnings release is the scoreboard. The quarter's business story is a company reorganising itself — reporting lines, product and pricing — around agents.
The company re-segmented itself around agents (September 2, 2026). Microsoft retired the three-segment structure for two — Agents and Infra, and Devices and Consumer — restated history, and disclosed Azure revenue in dollars for the first time. Renaming the core segment after agents is a strategy statement with accounting attached: the 83% of revenue that is cloud, software and AI is now presented as one compounding engine.
Copilot was rebuilt around delegated work — and repriced by usage (September 25, 2026). The redesigned Copilot is built on Home (a unified workspace for chat and delegated work), Code (apps and automations in natural language) and Autopilot (a persistent agent for long-running tasks), rolling out through the Frontier programme; Copilot in SharePoint reached general availability September 30. Advanced workloads moved to consumption billing through Copilot Credits, set to become the default for new Copilot Business purchases from December 1, 2026. The seat is becoming the floor of the AI price, not the ceiling.
Capacity slipped, not demand. Total capex of $45,200M came in below the company's "over $50,000M" outlook because some third-party data-centre capacity was delayed out of the quarter; roughly three-quarters went to short-lived assets (CPUs and GPUs). Microsoft opened 24 new data centres across five continents in the quarter, and the 10-Q carries $364,600M of leases signed but not yet commenced — the pipeline behind the Q2 guide.
Costs were addressed the other way too (October 26, 2026 — after quarter-end, before the print). Microsoft announced a voluntary exit offer days before reporting; Q2 cost guidance includes an estimate for it, and filed headcount was already down 2% YoY at September 30. Record infrastructure spend on one line, workforce cost action on another — the pairing is deliberate.
What management said — Q1 FY2027 call (October 28, 2026)
A sourcing note first, because it changes what can be quoted: the transcript supplied by our data provider for this quarter is Microsoft's fiscal Q3 2026 call (April 2026), not the September-quarter call. This post therefore prints no verbatim quotes from the call — quoting April's call as October's would be fabrication. What follows is the October 28 call's substance as carried in contemporaneous reporting and filing analysis, labelled as reported, not quoted.
- Guidance — Q2 FY2027 (as reported): revenue $96,000–97,100M (+18–19%); Azure +49–50% in constant currency, with demand still exceeding supply; total capex above $50,000M including finance leases; Windows OEM & devices down in the mid-30s %. The outlook sat above consensus (Azure ~45% expected).
- Demand (as reported): Microsoft Cloud revenue $63,900M (+30%) at a 66% gross margin; Foundry at over 120,000 customers with revenue more than tripled; Copilot daily users up nearly 50% sequentially — but no updated paid seat count beyond FY2026's 30M+.
- Costs (as reported): Q2 operating expenses guided to $18,500–18,600M (+9% YoY) including an estimate for the October 26 voluntary exit offer; Q1 gross-margin pressure attributed to Azure mix, partly offset by Azure efficiency.
The Key Issue — is Azure's re-acceleration worth a free-cash-flow trough?
Thesis: Microsoft is spending like an infrastructure company to defend a software company's margins — and this quarter, for the first time, the trade is measurable in dollars on both sides: Azure +48% and re-accelerating, against free cash flow −27% and conversion halved. The case turns on duration: if the trough is a bridge (capacity installed → contracted demand → conversion recovers), the current valuation framework holds; if ~$45–50B a quarter is the permanent cost of staying in the AI race, earnings are worth less per dollar than the framework assumes.
Evidence for — "it is a bridge"
Azure growth accelerated to 48.2% while capex undershot guidance on third-party delays — the installed base is sweating harder, not idling. Demand is contracted (RPO +73% to $677,000M), operating margin expanded to 49.8% through the build, and the five-year record (ROIC 22.7%; operating cash flow at 131% of net income) says this management converts infrastructure into returns. Q2 guidance was raised in substance, not trimmed to protect cash.
Evidence against — "it is a regime"
Commitments compound faster than cash: $364,600M of leases not yet commenced sit atop $39,367M of quarterly cash capex, with Q2 guided above $50,000M all-in. Free-cash-flow conversion has fallen four straight fiscal years (89.6% → 82.2% → 84.0% → 70.3% → 50.1%) — a trend, not a blip. Concentration rises with the backlog (OpenAI: 10.8% of revenue; ~45% of RPO at December 2025). And the cash record is the weak line in the five-year file: free cash flow has compounded at just 3.6% a year against revenue at 14.6%.
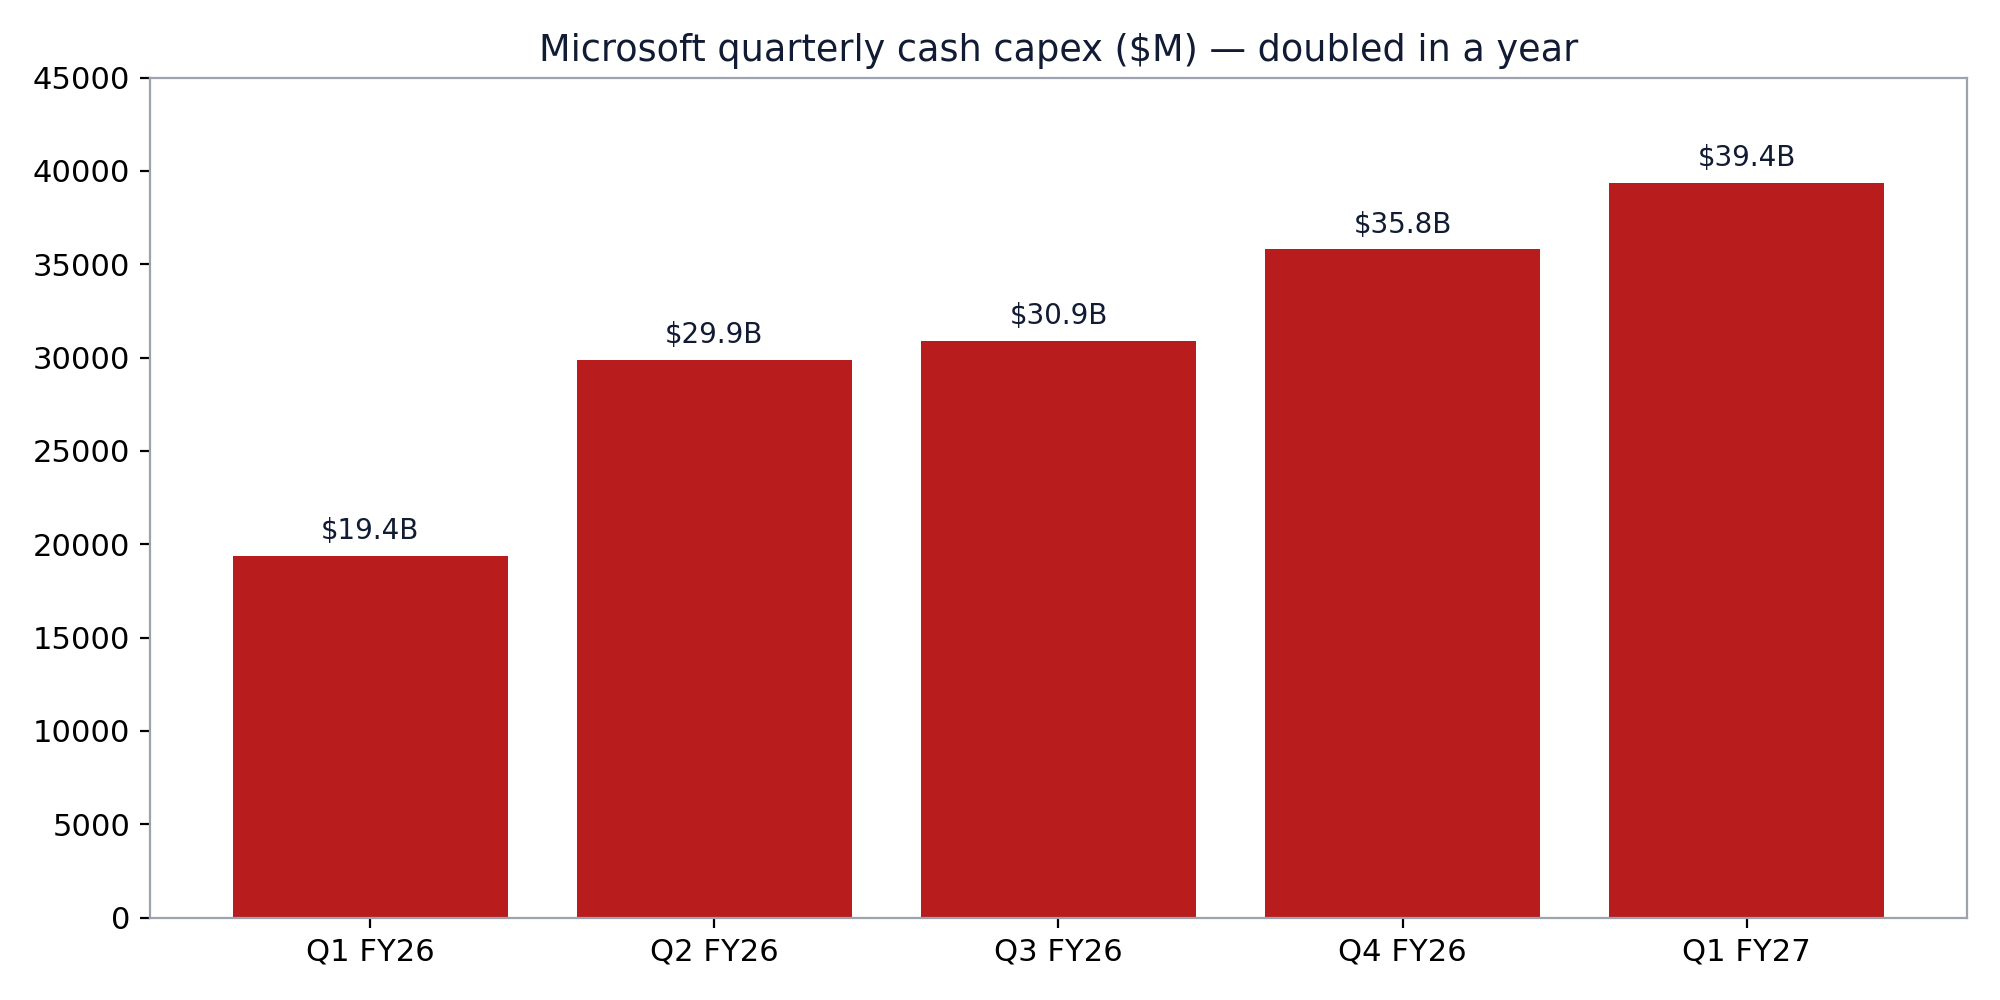
Cash capex by quarter — the doubling in five quarters is the Key Issue in one chart. Rendered from filed figures.
What to watch
(1) Q2 conversion — free cash flow holding near this quarter's level while capex crosses $50B all-in marks the trough; another leg down extends it. (2) Azure holding at or above the 49–50% guide as comparisons harden. (3) External datapoint: the same week, Google Cloud grew +102.6% to $30,710M with a $561B backlog (filed figures) and AWS grew +39.3% — demand is industry-wide, which validates the build and means everyone is adding capacity at once; the 2027–28 supply wave is the shared risk. (4) Historical analogy: in the mid-2010s cloud transition, Microsoft's capex rose ahead of Azure revenue for roughly two years and sceptics capitalised the trough; the investors who were right watched utilisation and contracted backlog, not the free-cash-flow line alone. The analogy supports patience — at an order of magnitude smaller scale. (5) Any Copilot seat update, and the first Copilot Credits signal after December 1. The forward question: when Q2 prints, does free cash flow stabilise at trough level while Azure holds near 50% — the bridge signature — or does the spend step up again with conversion still falling?
Sources: Microsoft's filed Q1 FY2027 financial statements and 10-Q disclosure (segment and product-line detail, RPO, leases, related-party revenue) via FMP and filing analysis; consensus estimates via FMP; contemporaneous reporting of the October 28, 2026 earnings call and the quarter's business developments, each item as labelled in the text. The earnings-call transcript supplied by our data provider for this quarter is the prior-quarter call; no quotes in this post are drawn from it.
Disclosure: This post is general information and analysis, not financial advice and not a recommendation to any person. The author may hold positions in companies discussed.