Netflix: YouTube Pulls Away — Q3 FY26
Four takeaways: Growth keeps slowing at the top line — revenue grew 11.85% YoY, solid but no longer spectacular. Margins did the heavy lifting — operating margin expanded 641 bps YoY. The cash machine is real — $2.88B of free cash flow funded a $4.797B buyback in a single quarter.

At a Glance — Q3 FY26 Scoreboard BEAT
| Actual | Estimate | Surprise | QoQ | YoY | |
|---|---|---|---|---|---|
| Revenue | $12.874B | $12.869B | +0.04% | +2.50% | +11.85% |
| EPS (diluted) | $0.87 | $0.82 | +6.10% | +8.75% | +47.46% |
Analyst EPS range for the quarter was $0.81–$0.83 across 24 analysts. Source: FMP via Earnings Recap, Oct 20, 2026.
Gross margin 52.8% +634 bps YoY
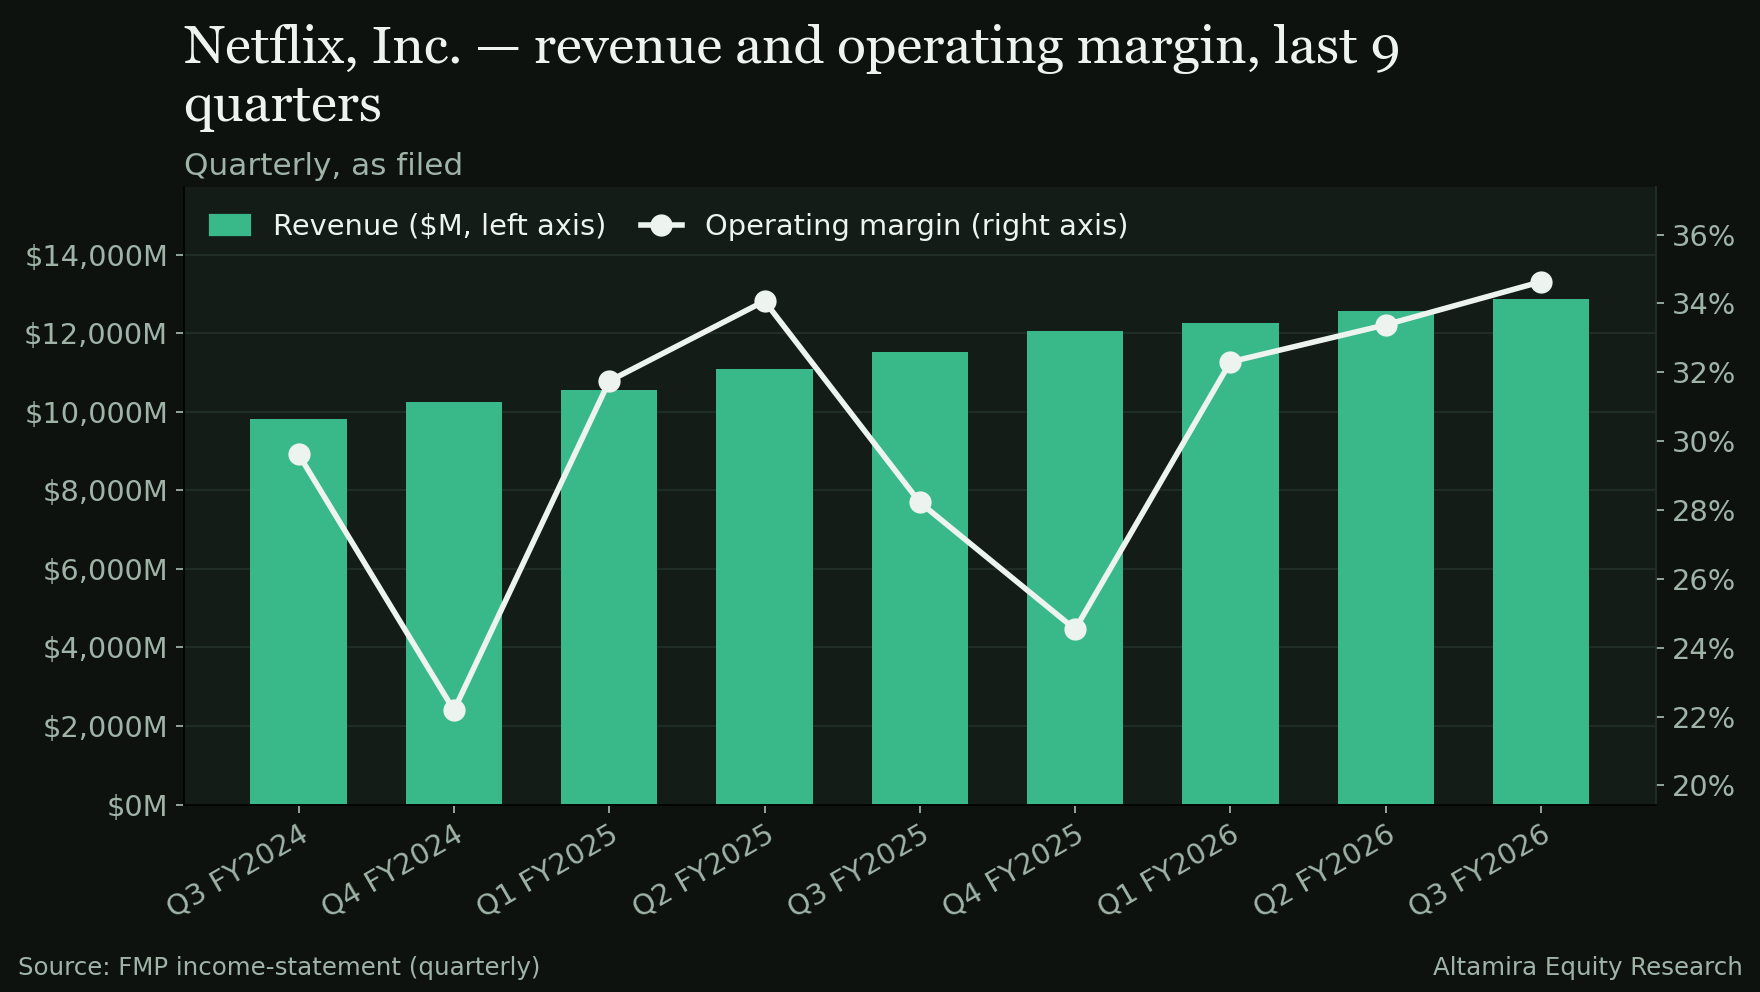
Operating margin 34.6% +641 bps YoY
Net margin 28.5% +633 bps YoY
After-hours move −8.2% to $64.16, vs ±7.1% 8-quarter average move
Free cash flow $2.88B 78.7% of net income
Buyback in quarter $4.797B Diluted shares −1.3% QoQ · no dividend
Cash & ST investments $8.22B Cash alone $8.19B
Total debt $15.13B Net debt $6.94B · 0.19× EBITDA
Guidance: MAINTAINED. Management confirmed it plans to deliver its full-year guidance, kept its financial objectives unchanged — sustain double-digit revenue growth, expand margins, and increase free cash flow — and gave no 2027 guidance, saying full-year 2027 guidance, including margin guidance, will come on the Q4 call in January. Q4 guidance includes about 120 basis points of cost tied to the recent headcount reductions. Source: earnings call via FMP transcript, summarised in the Earnings Recap.
Four takeaways: Growth keeps slowing at the top line — revenue grew 11.85% YoY, solid but no longer spectacular. Margins did the heavy lifting — operating margin expanded 641 bps YoY. The cash machine is real — $2.88B of free cash flow funded a $4.797B buyback in a single quarter. The market still sold it — the stock fell 8.2% after hours, more than its ±7.1% eight-quarter average post-earnings move, because the debate is no longer about this quarter at all. It is about time — who owns the viewer's hours. That is the Key Issue, below.
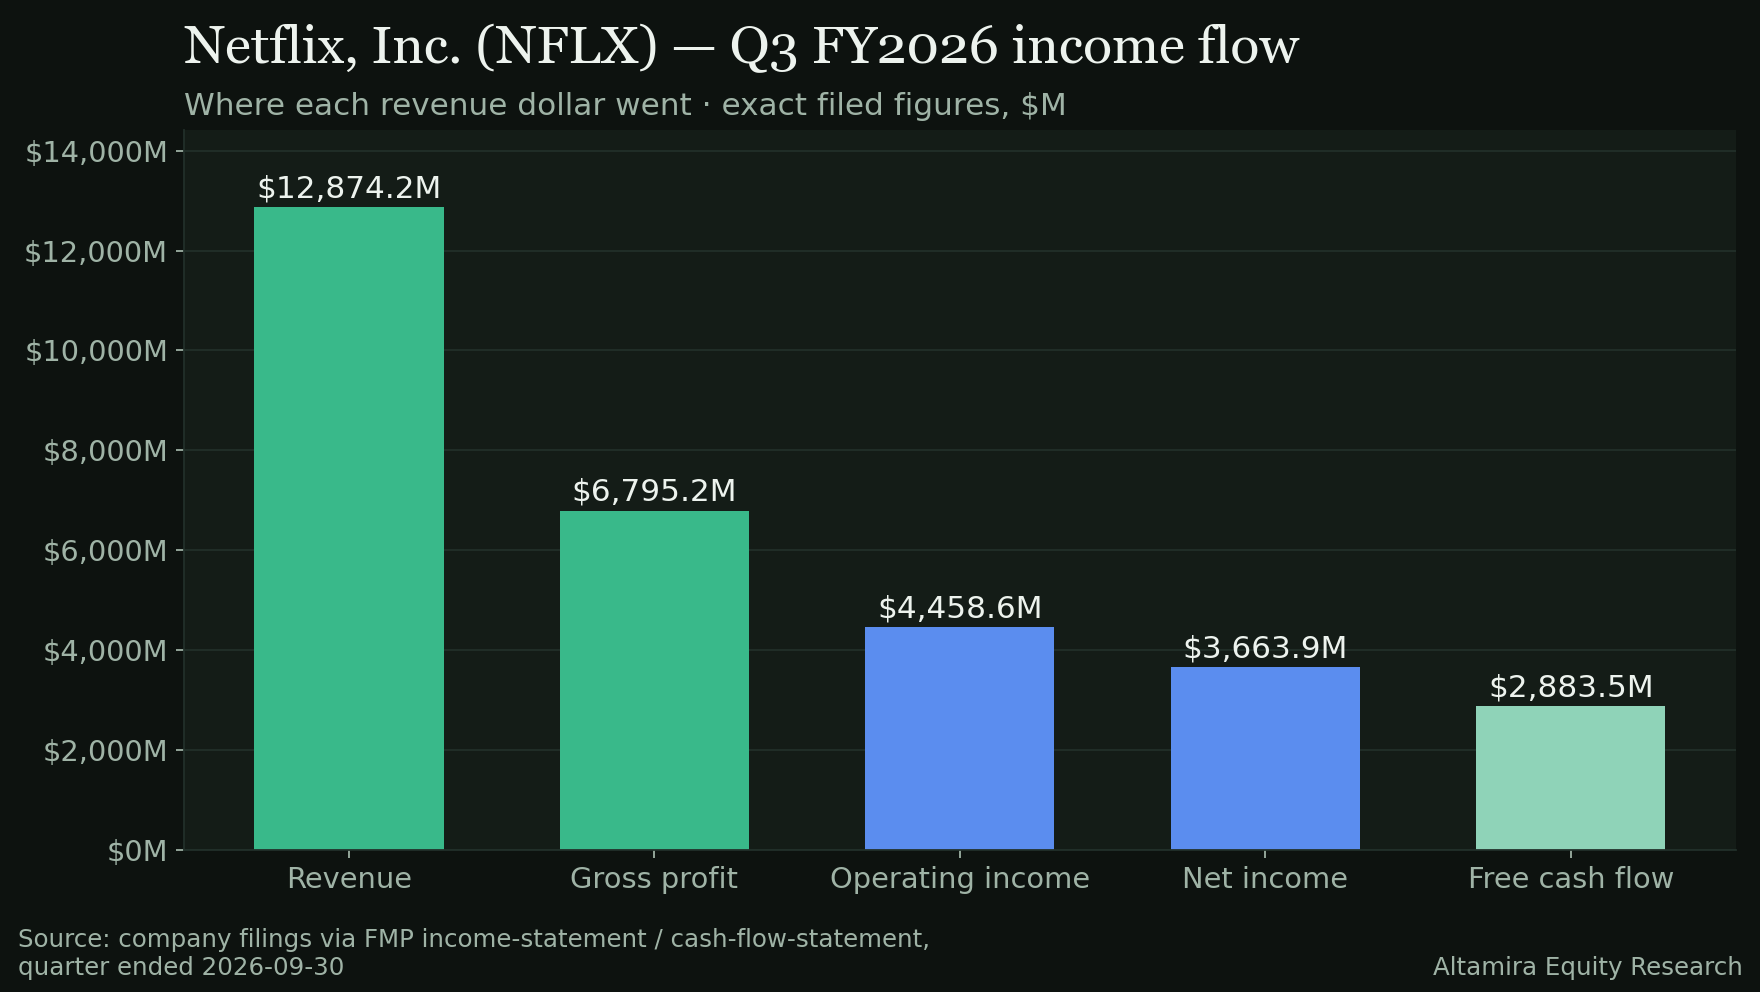
Financial Sankey — Where the Q3 Revenue Went
Revenue · $12.87B · 100.0%
Cost of Revenue · $6.08B · 47.2%
Gross Profit · $6.80B · 52.8%
R&D · $1.03B · 8.0%
SG&A · $1.30B · 10.1%
Operating Income · $4.46B · 34.6%
Interest & Other · $142M · 1.1%
Tax · $653M · 5.1%
Net Income · $3.66B · 28.5%
Gross margin 52.8% (QoQ +85 bps · YoY +634 bps) · Operating margin 34.6% (QoQ +125 bps · YoY +641 bps) · Net margin 28.5% (QoQ +138 bps · YoY +633 bps).
The Sankey is exact to the filed income statement: revenue of $12,874M became $6,795M of gross profit after $6,079M of cost of revenue; operating expenses of $2,337M (research & development $1,033M, selling, general & administrative $1,303M) left operating income of $4,459M; after net other expense and $653M of income tax, net income was $3,664M. In plain terms, Netflix kept about 53 cents of every revenue dollar after content and delivery costs, and about 28 cents as final profit — the most profitable version of this business model it has ever run, on the numbers in front of us.
In charts
The numbers behind this note, drawn from the same filed figures.
Source: FMP quarterly income statement via Earnings Recap, Oct 20, 2026. Sankey rendered with the Earnings Recap pipeline.
How They Make Money
Netflix sells one product in almost every country on earth: a paid streaming membership, priced in local currency, in a small number of tiers — including a lower-priced tier supported by advertising. The legacy DVD-by-mail business still exists in the data, but the business today is streaming. Revenue is reported by region, and the mix matters: the mature US and Canada market is still the largest single pool, while most of the geography outside it is where membership growth has historically come from.
Revenue by region — last twelve months
UCAN (US & Canada) $21.6B · 43%
EMEA (Europe, Middle East & Africa) $16B · 32%
LATAM (Latin America) $6.1B · 12%
APAC (Asia-Pacific) $6B · 12%
Source: Fiscal.ai, pulled Oct 24, 2026 (Segments & KPIs, LTM). Shares are calculated from those four regional figures, which sum to $49.7B — the same $49.73B LTM revenue Fiscal.ai shows for the company. Streaming revenue was $49.7B LTM on the same page; the DVD figure was not available in the verified Fiscal.ai summary, so it is not quantified here.
Fiscal.ai also tracks the operating engine behind those dollars — paid memberships at period end, paid net membership additions, average paying memberships, and average revenue per membership, each broken out by the same four regions. That is the right way to read this business: revenue is memberships multiplied by what each member pays, so any slowdown has to be one of those two things giving way — fewer net additions, or pricing that stops sticking. In Q3, on management's own commentary, neither gave way: churn improved, and recent price increases behaved the way past cycles have. The pressure the market is pricing is not in these tables yet. It is in the competition for viewing time, addressed in the Key Issue.
The Quarter in Charts
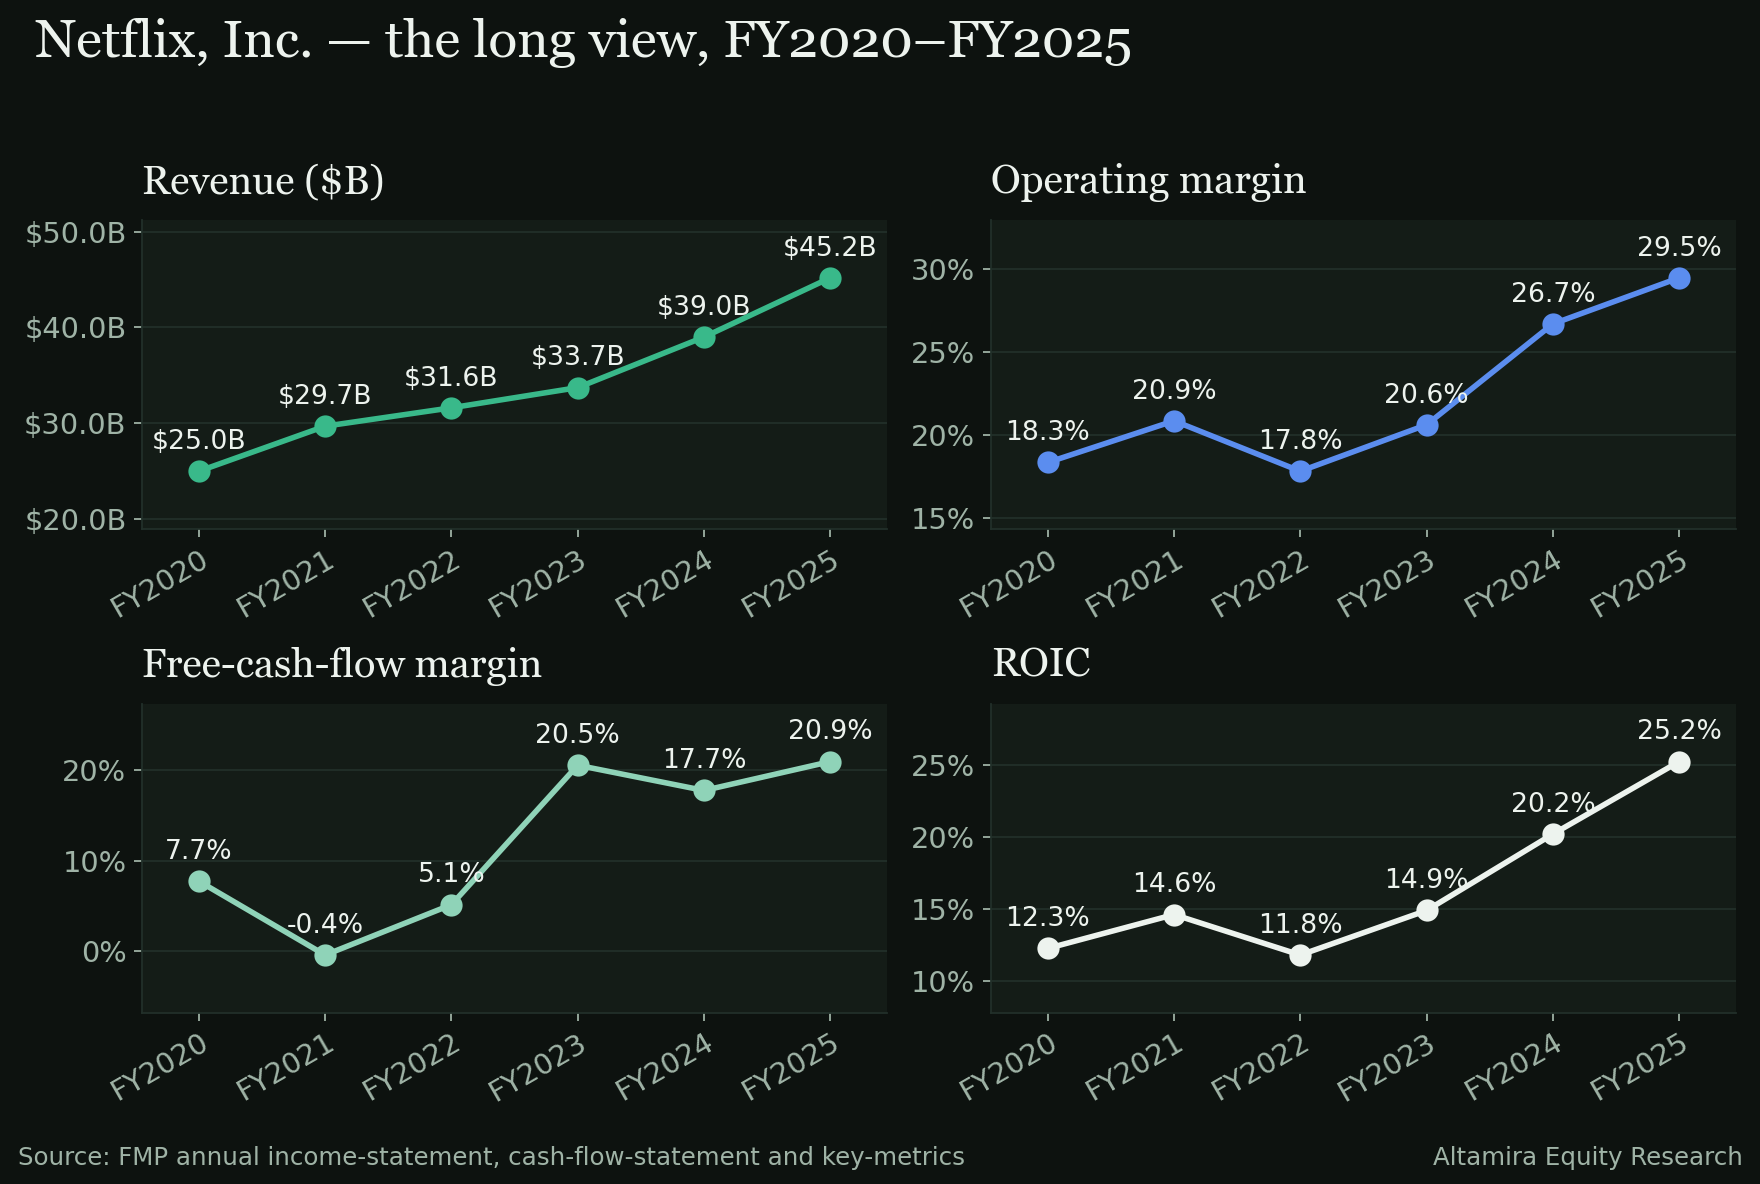
1 · Revenue keeps compounding — $33.7B to $49.7B
$33.7B Dec ’23
$39B Dec ’24
$45.2B Dec ’25
$49.7B LTM
Insight: Annual revenue rose from $33.7B (Dec ’23) to $39B (Dec ’24) to $45.2B (Dec ’25), and $49.7B over the last twelve months. The business is still getting bigger every year — the argument is about the rate, not the direction.
Source: Fiscal.ai, pulled Oct 24, 2026.
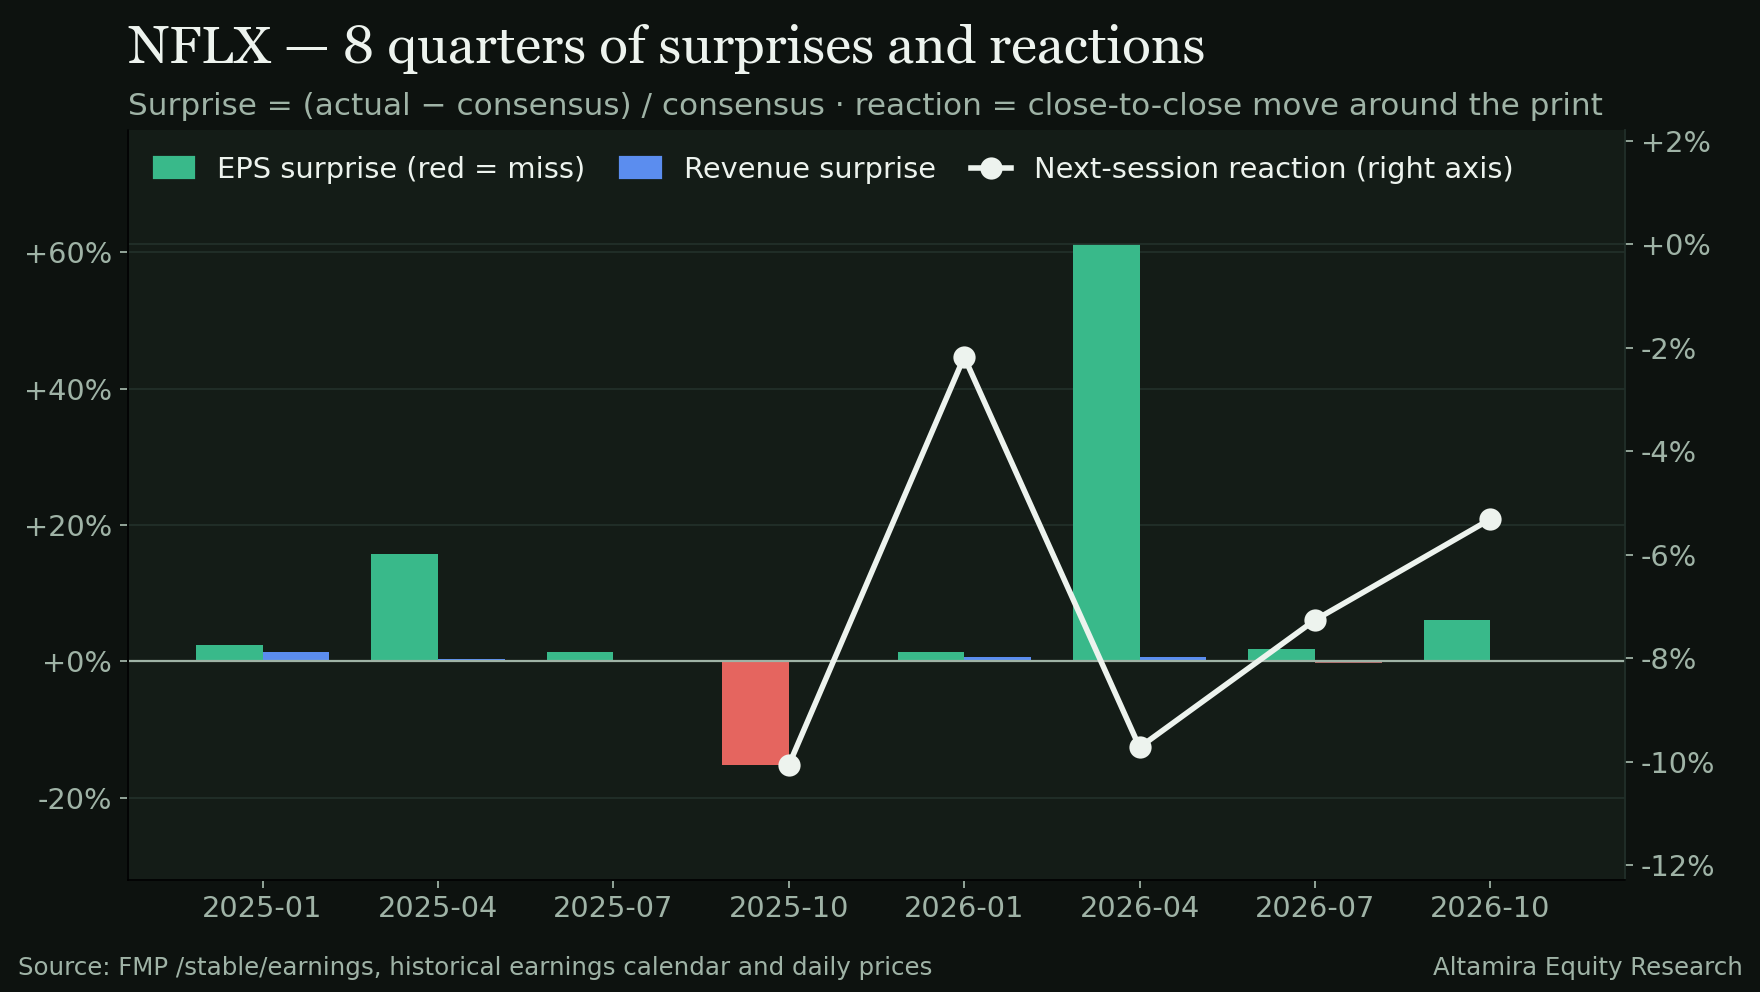
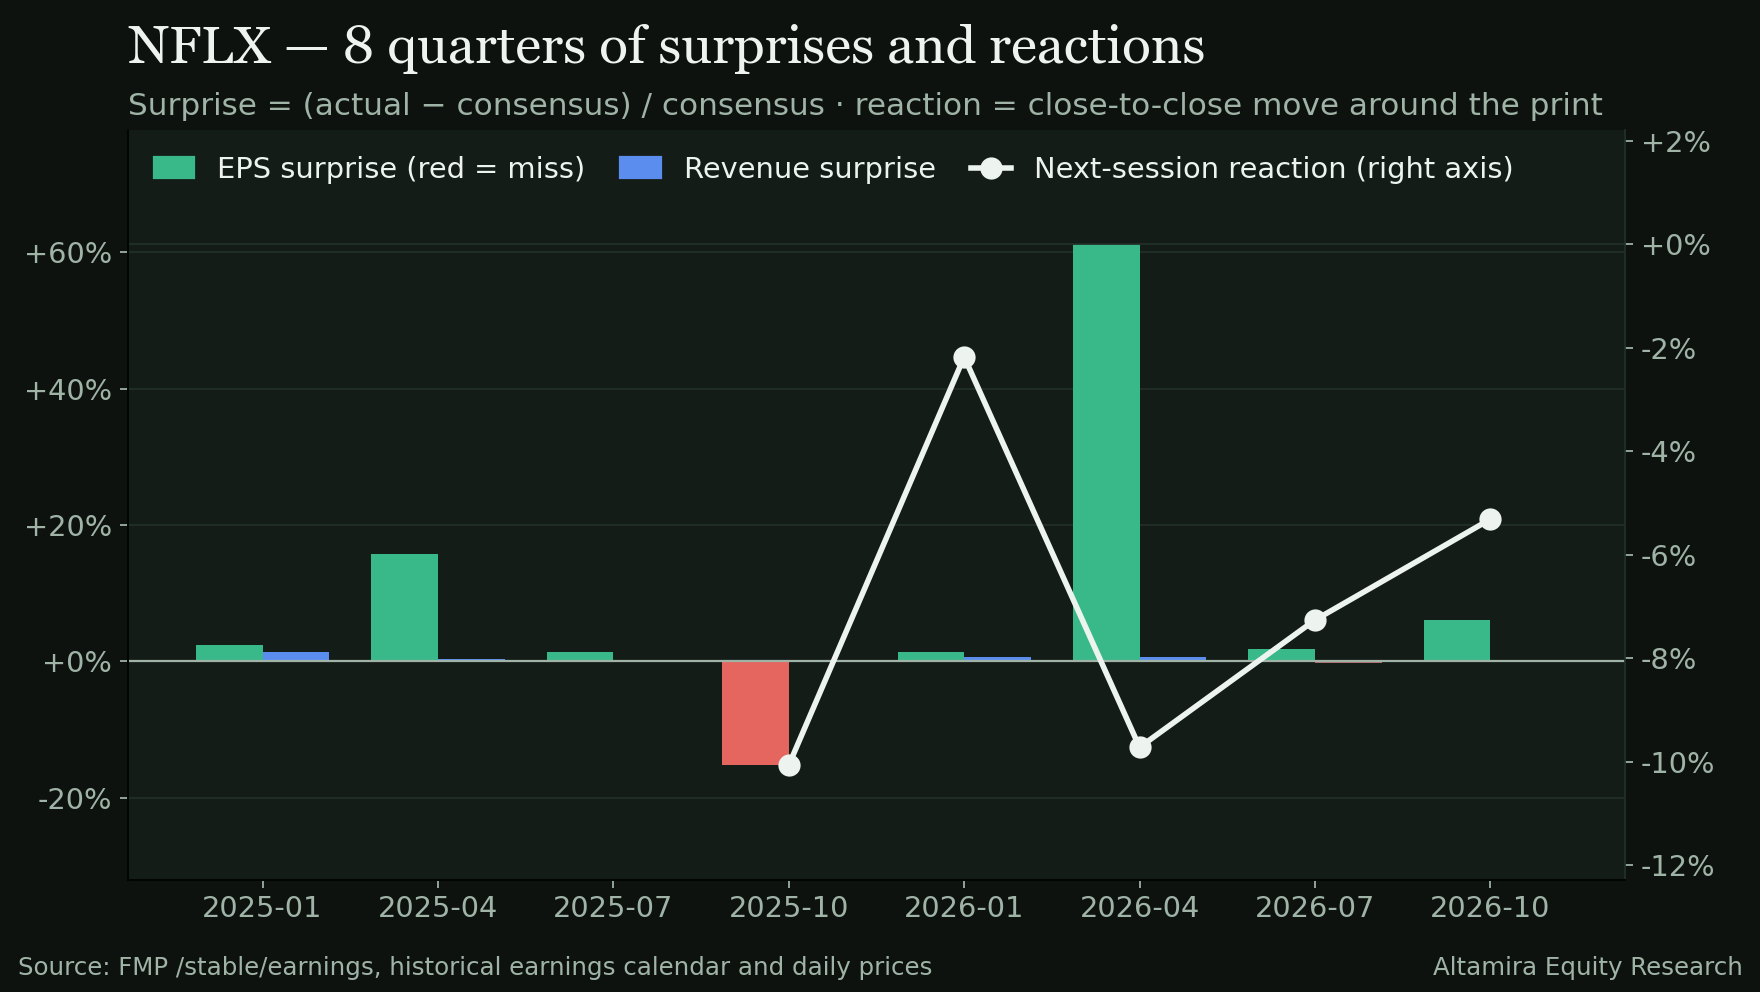
2 · EPS surprise history — beats are the habit, not the exception
Oct ’24 +5.9%
Jan ’25 +2.4%
Apr ’25 +15.8%
Jul ’25 +1.4%
Oct ’25 -15.2%
Jan ’26 +1.4%
Apr ’26 +61.2%
Jul ’26 +1.8%
Insight: Across the last eight reported quarters in the Recap's history, EPS surprises were positive in seven — the one clear miss was Oct ’25 at −15.2% — and Q3 FY26 added another beat at +6.10% on EPS (not shown above; the chart ends at the Jul ’26 report). One caution: the Apr ’26 reading of +61.2% is what FMP's calendar recorded for that quarter and is far outside the usual pattern, so treat that single bar as a data outlier, not a performance claim.
Source: FMP earnings calendar history via Earnings Recap (recap-data.json), Oct 20, 2026.
3 · Margins — Q3 FY26 vs a year ago
Gross margin — Q3 FY26 52.8%
Gross margin — year ago (implied) 46.4%
Operating margin — Q3 FY26 34.6%
Operating margin — year ago (implied) 28.2%
Net margin — Q3 FY26 28.5%
Net margin — year ago (implied) 22.1%
Insight: Every margin line expanded by more than 630 basis points year over year. Whatever the growth debate, the profitability step-change in this quarter is not in dispute.
Source: FMP via Earnings Recap — current margins are reported; year-ago bars are implied by subtracting the reported YoY basis-point changes (+634 / +641 / +633 bps) from the current margins.
What Management Said — the Call in Five Points
1 · Guidance — MAINTAINED. Peters confirmed Netflix plans to deliver its full-year guidance. There is no 2027 guidance yet: Neumann said it is premature, and full-year 2027 guidance, including margin guidance, comes on the Q4 call in January. The stated financial objectives are unchanged — sustain double-digit revenue growth, expand margins, and increase free cash flow. Q4 guidance includes about 120 basis points of cost tied to the recent headcount reductions.
2 · Margins. Reported margins expanded sharply — gross 52.8%, operating 34.6%, net 28.5%, each up more than 630 bps year over year. Neumann restated the philosophy of steadily growing margin each year while investing aggressively in the highest-impact areas, and declined to quantify the 2027 run-rate savings from the headcount reductions or how they split between reinvestment and margin support.
3 · Demand. Engagement was described as healthy in every region. Q3 churn, globally and in the U.S., improved year over year and came in better than forecast, and recent price increases performed in line with past cycles. India was the showcase — view hours up 24% and revenue up nearly 20% year over year on a strong local slate — with APAC, LATAM and EMEA strong, and U.S. engagement called solid but improvable. Advertising revenue is still growing over 80% this year, but it is running a bit behind the aggressive full-year target because of delays in partner integrations for new ad products; the ad-tier ARM gap versus standard plans is narrowing.
4 · Capital return. Capital return was not addressed on the call. From the quarter's financials: free cash flow was $2.88B (78.7% FCF conversion), share repurchases were $4.80B, diluted share count fell 1.3% quarter over quarter, and Netflix ended the quarter with $8.19B of cash against $15.13B of total debt (net debt $6.94B). No dividend.
5 · Notable analyst questions. David Joyce (Seaport Research Partners) pressed on strategy — live events, aggregation, short-form/UGC — and Sarandos answered directly: strategy is unchanged, roughly 95% of spend stays on the core originals business. Eric Sheridan (Goldman Sachs) asked about U.S. vs. international engagement divergence; Peters answered with churn and India detail but conceded the U.S. slate must go from “very good to great.” Doug Anmuth (JPMorgan) asked whether double-digit revenue growth is achievable in 2027; Neumann pointed to member growth, pricing and ads all working, but deferred formal guidance. Michael Morris (Guggenheim) asked for the annual savings from the headcount cuts — Neumann deflected, refusing to quantify the 2027 expense impact. Vikram Kesavabhotla (Baird) drew the candid ads admission that the business is behind its aggressive target on integration delays.
Guidance classification: MAINTAINED (Earnings Recap, from the call transcript). The strategy line management returned to on the call:
“Our strategy is unchanged and it has always been and it continues to be, to combine best-in-class entertainment with industry-leading discovery, global distribution, and the best possible monetization.”
Source: FMP earnings-call transcript (Q3 2026 call, Oct 20, 2026), five-bullet summary as polished in the Earnings Recap, Oct 20, 2026.
The Key Issue — YouTube Pulls Away
Thesis
Netflix has won the streaming business it set out to build — and this quarter proves it again: double-digit revenue growth, record-level margins, billions returned to shareholders. The risk is that the contest has quietly changed. The scarce resource is no longer the subscription dollar; it is the hour. On the measure that tracks hours on the biggest screen in the house — US television — a free, creator-fed competitor is taking a larger and larger share, and Netflix's share has stalled. If hours go first, the argument runs, members and pricing power eventually follow.
Evidence for
- According to the Nielsen figures cited in App Economy Insights' Oct 23 edition, streaming reached a record 49.0% of US TV viewing in July. Within that, YouTube reached a record 14.2% of US TV time, while Netflix captured 7.8%, down from 8.8% a year earlier — the gap between them widened from 4.6 to 6.4 percentage points in twelve months. August figures cited elsewhere put YouTube at 15.8% and Netflix at 7.7%. Either way, Americans now spend close to twice as much TV time on YouTube as on Netflix.
- Management itself acknowledged the engagement challenge on the call, conceding US engagement is “solid but improvable” and that the US slate has to go from very good to great.
- The stock's reaction is its own evidence: a clean beat on EPS and margins was met with an 8.2% after-hours fall, larger than the stock's typical post-earnings move — investors are paying for the time-share story, not the quarter.
- On the same call, the growth engine that was supposed to widen the funnel — advertising — was described as running behind its aggressive full-year target, albeit still growing over 80%, because new ad-product integrations are delayed.
Evidence against
- Netflix's own engagement picture is more nuanced than the US TV share chart: worldwide viewing hours rose 2% in the first half of 2026, up from 1.5% growth in 2025, per the App Economy summary of the company's disclosures — engagement is still growing globally even as its share of US television time slips.
- Churn — the metric that turns lost hours into lost revenue — improved year over year, globally and in the US, and came in better than the company forecast. Members are not leaving; they are, so far, just also watching something else.
- Not all hours are equal. Live programming is only about 5% of content spending and roughly 1% of viewing hours, yet live events drove six of the ten biggest sign-up days of the past five years (per the App Economy summary). A single event can be worth more to the business than weeks of ordinary viewing.
- The financials still describe a compounding business: revenue up 11.85% YoY, margins up more than 630 bps, $2.88B of quarterly free cash flow, and $4.797B returned via buybacks in one quarter.
What to watch
- The Q4 call in January — 2027 guidance arrives there, including margin guidance. Whether double-digit revenue growth is guided, and at what margin cost, will settle much of this argument.
- US engagement commentary — whether “solid but improvable” improves, and whether the new content leadership changes the hit rate of the US slate.
- Ads execution — whether the integration delays clear and the ad tier closes more of its revenue-per-member gap to the standard plans.
- Churn first, hours second — the bear case only becomes a financial case when the hours leak shows up in churn or pricing. Until then it is a valuation argument, not an income-statement one.
Sources & methodology. Earnings scoreboard, income statement, Sankey, margins, dashboard, reaction and surprise history: Financial Modeling Prep (FMP) data as compiled in the Earnings Recap, Oct 20, 2026 (recap-data.json / recap-full.html, ~/workspace/earnings-recap/out/2026-10-20/). Call content: FMP earnings-call transcript, Q3 2026 call held Oct 20, 2026, as summarised in the Recap's five bullets (LLM-polished). Business model / segments & KPIs and annual revenue history: Fiscal.ai (account: Plus (Legacy)), NFLX page and Segments & KPIs pulled Oct 24, 2026, as verified in the Company Insights SPEC §9. Morningstar fields (star rating, fair value, Price/FV, moat, uncertainty, capital allocation, analyst name/date): Morningstar Investor, pulled Oct 24, 2026, verified in SPEC §10 — fields and a high-level summary only; no Morningstar text reproduced. Key Issue market-share figures: Nielsen data as cited in App Economy Insights, “Netflix: YouTube Pulls Away,” Oct 23, 2026 (free edition). Full per-figure tracing: sources.md in this folder.
Research for information only — not investment advice; see Disclosures.