Perfect on Quality, Waiting on the Trend: TSM's 13-for-13 Problem
TSM is one of only three names in 515 to pass the scorecard's 13-criterion QC gate perfectly — with a fundamental score of 79.7. A technical score of 39.9 is the whole reason it still sits in Tier 3.

Altamira Equity Research — Scorecard Notes. Source: External 516 KPI Scorecard, edition dated 7 November 2026 (prices as of the 6 November 2026 close; 515 of 516 names scored). All scores, pillars and KPI values below are taken directly from that edition's dataset.
The headline
The scorecard's quality-control gate is deliberately hard to clear: 13 criteria, and only 13 of 515 names in this edition carry a QUALIFIED verdict at all. Just three names pass all 13 — ResMed, ASML, and Taiwan Semiconductor (TSM).
TSM is the interesting one, because the dataset cannot decide what to do with it. It rose +5.3 points to 67.8 in this edition — the joint second-largest gain in the universe — on the back of a fundamental score of 79.7, the kind of number that normally lives near the top of the table. Yet it sits at rank 40, in Tier 3, because the other half of its profile points the other way: a technical score of 39.9. The dataset's own formula makes the tension explicit — the total is 0.70 × fundamental 79.7 + 0.30 × technical 39.9. TSM needs +2.2 points to cross into Tier 2, and almost all of the gap is the trend, not the business.
The fundamental case — the named KPIs
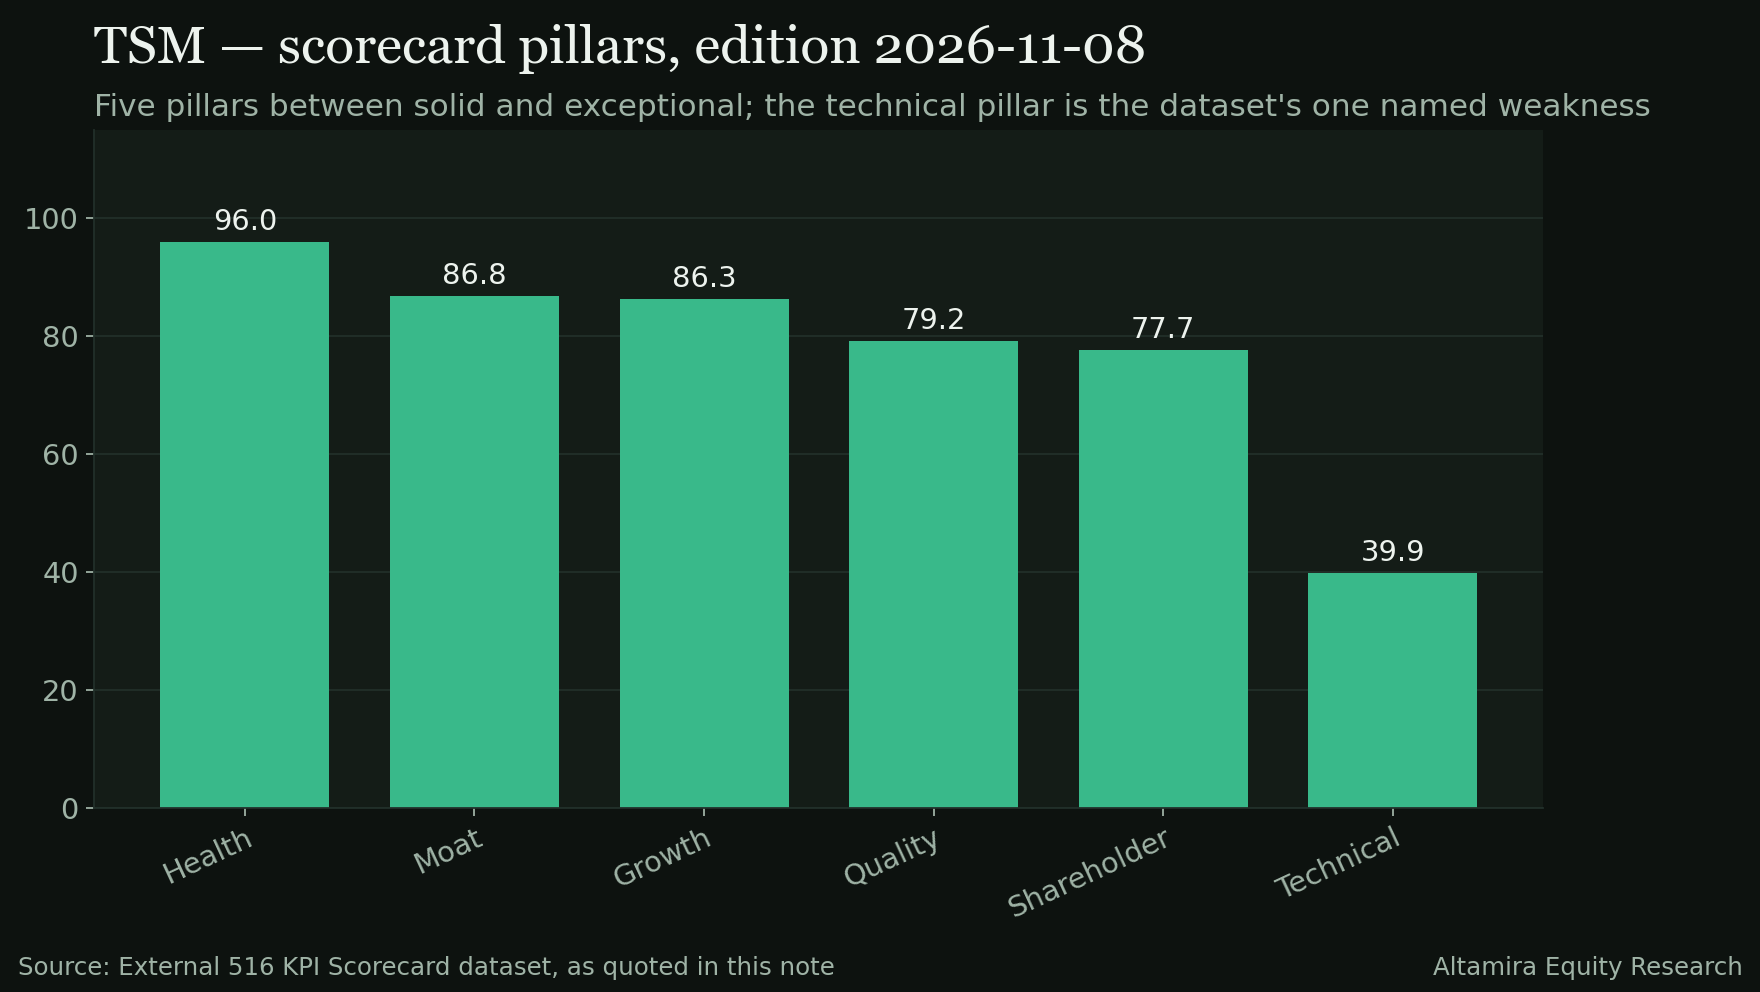
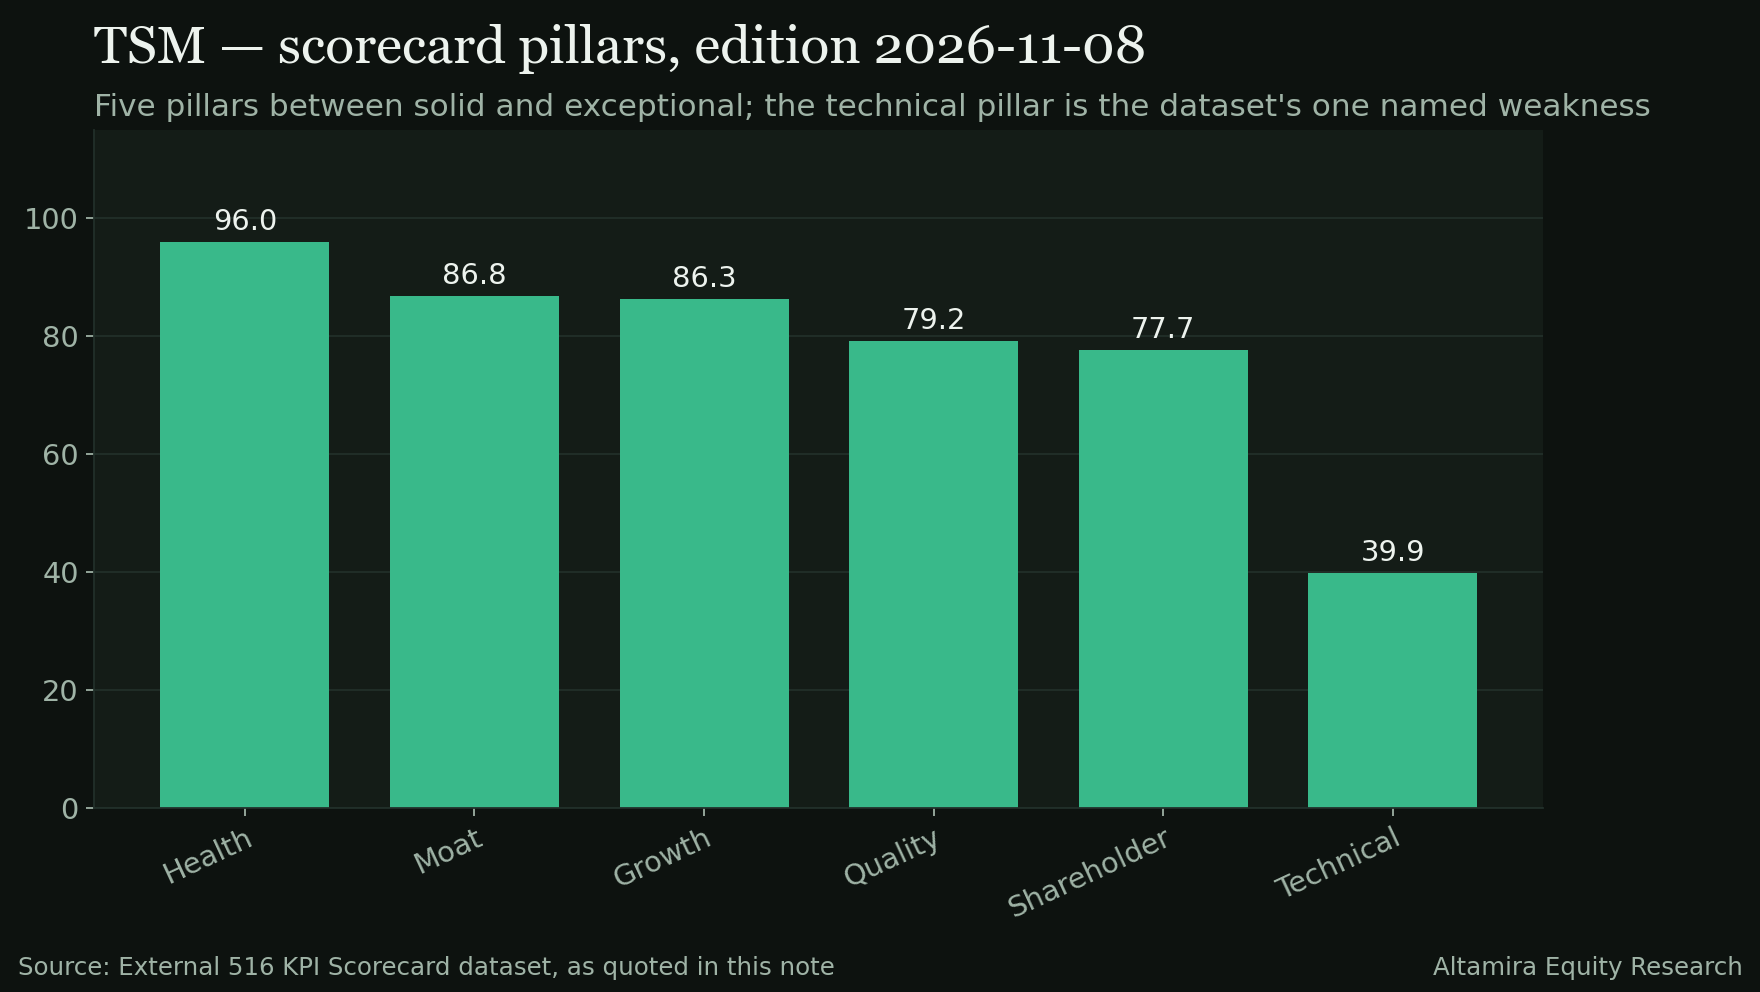
Every pillar except one scores between solid and exceptional:
- Health pillar: 96.0. Net debt to EBITDA of 0.0, debt to equity of 0.20, and interest coverage of 156.5×. The balance sheet is, on these cells, close to unassailable.
- Growth pillar: 86.3. Revenue compounded at 23.3% over five years and 18.9% over three; diluted EPS at 28.3% over five years; free cash flow at 26.9% over five years and 24.0% over three.
- Moat pillar: 86.8 — rated Wide and Widening, sourced to pricing power.
- Quality pillar: 79.2, anchored by a five-year average return on invested capital of 21.0%, a gross margin of 59.9%, a net margin of 45.1%, and cash conversion of 152.4%.
- Shareholder pillar: 77.7. Dividend per share compounded at 15.3% over five years and 24.4% over three, on a payout ratio of 22.4% and a dividend yield of 1.12% — capital return that is growing fast from a conservative base.
- Valuation: at a price of $375.44 against fair value of $534.00, the margin-of-safety cell reads +29.7%.
Two honest limits belong in the record. The free-cash-flow yield is a modest 2.71% — the cash machine is real, but the market already charges for it. And the dataset's P/E (next twelve months) cell for TSM is empty, so this note quotes no forward multiple for the name rather than filling the gap from elsewhere.
The counterweight — a trend that has not agreed
The dataset names exactly one weakness for TSM: technical. The cells behind that label:
- Relative-strength rank (6-month): 24 — near the bottom of the universe — against a 12-month rank of 77. The long trend and the short trend are telling different stories: the shares are up 29.8% over twelve months but down 10.3% over three.
- RSI-14: 36.3, price −6.5% versus its 200-day average and −13.0% versus its 50-day average, and −23.0% below the 52-week high.
- Trend state: MIXED.
The nuance inside the technical block matters. TSM still meets 5 of 6 Minervini trend-template criteria, and its trend-template cell scores 83.3 (green). The drag is concentrated in the momentum cells — relative strength, RSI, and a MACD histogram of −1.67% — not in a broken long-term structure. In plain terms: the dataset says the business passed every quality test it was given, while the market's recent vote went the other way.
The perfect-QC trio, side by side
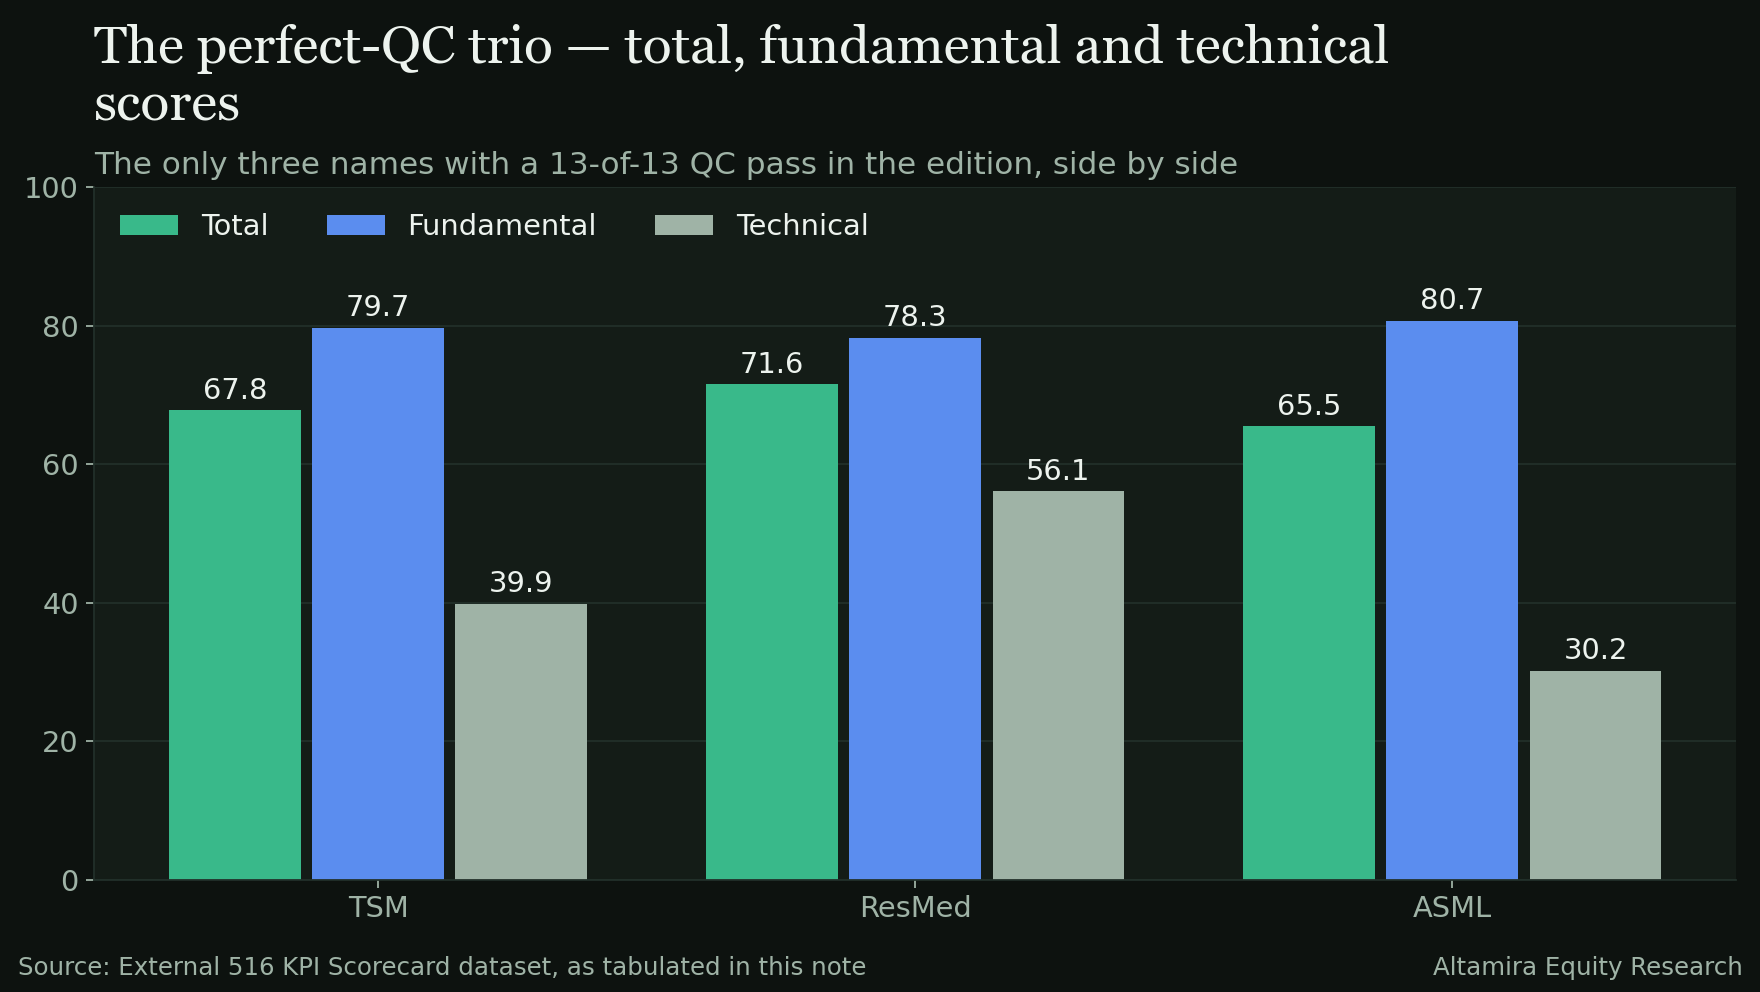
The three 13-for-13 names make a clean study in how the same quality verdict can sit on very different totals:
| TSM | ResMed (RMD) | ASML | |
|---|---|---|---|
| Total score | 67.8 | 71.6 | 65.5 |
| Tier | 3 | 2 | 3 |
| Fundamental / technical | 79.7 / 39.9 | 78.3 / 56.1 | 80.7 / 30.2 |
| Strongest pillar | Health 96.0 | Value 93.8 | Quality 93.5 |
| Margin of safety | +29.7% | +56.7% | +30.5% |
| Trend state | MIXED | MIXED | DRIFTING |
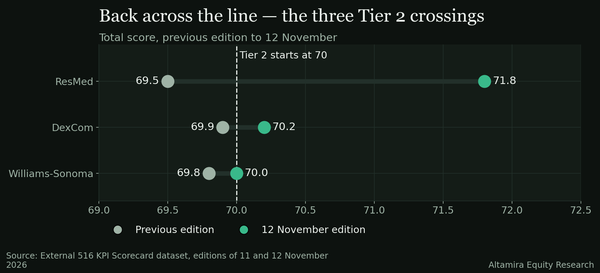
ResMed is what TSM's profile looks like with a merely average technical score instead of a poor one: through the Tier 2 line, with the trio's deepest margin of safety (+56.7%, price $235.30 against fair value of $543.15) and an 8.61% free-cash-flow yield. ASML is the mirror image of TSM at greater amplitude — the trio's highest fundamental score (80.7) and its lowest technical score (30.2). The pattern across all three is the edition's quiet theme: in this dataset, at this moment, quality is not the scarce input. Trend confirmation is.
What to watch next
- The +2.2 gap. TSM crosses into Tier 2 if its technical cells repair even partway — the relative-strength rank and the distance versus the 200-day average are the cells to watch first; the fundamental side has little left to prove at 79.7 with a 13/13 QC pass.
- Whether the QC pass holds. A perfect gate score is a snapshot, not a status; the next edition re-tests all 13 criteria.
- The trio's spread. ResMed defends the only Tier 2 seat; ASML needs the same technical repair as TSM, from further back.
Sources: External 516 KPI Scorecard dataset, edition 2026-11-07 (kpi-full-2026-11-07.json) — total and pillar scores, tier assignments, QC gate verdicts (13/13 for TSM, ResMed and ASML; 13 QUALIFIED names in the edition), named KPI cells (ROIC, margins, cash conversion, revenue/EPS/FCF/DPS CAGRs, payout, leverage and coverage ratios, margin of safety, FCF yield, RS ranks, RSI-14, distances versus moving averages and the 52-week high, Minervini criteria count), trend-state classifications, and the dataset's total-score formula. Fair value is stated as published in the dataset; the P/E NTM gap for TSM is the dataset's own empty cell. This note is research commentary on a published scorecard, not investment advice.