Visa: A Clean Beat the Market Wouldn't Pay For
Visa beat on both lines — revenue $12,139M vs $12,091M expected (+0.4%), adjusted EPS $3.48 vs $3.44 expected (+1.2%) — expanded every margin, converted 114.8% of net income into free cash flow and returned $5,281M to shareholders in a single quarter.

Download PDF — the full public report (PDF)
Fiscal Q4 2026 — revenue +13.2%, margins expanded on every line, $5.3B returned in one quarter. The stock fell anyway. The second engine is now the whole question.
Company Insights · Thursday, October 29, 2026 · Visa (NYSE: V) · Fiscal Q4 2026 (year ended September 30, 2026), reported Tuesday, October 27, 2026 after the close
Visa beat on both lines — revenue $12,139M vs $12,091M expected (+0.4%), adjusted EPS $3.48 vs $3.44 expected (+1.2%) — expanded every margin, converted 114.8% of net income into free cash flow and returned $5,281M to shareholders in a single quarter. The stock still fell 2.0% after hours: at 32.6× trailing earnings, a merely clean quarter is no longer enough.
At a glance — fiscal Q4 2026
| Revenue | $12,139M vs $12,091M est · +0.40% surprise · +13.2% YoY · +4.3% QoQ |
| EPS (adjusted) | $3.48 vs $3.44 est · +1.16% surprise · GAAP diluted EPS $3.19 |
| Margins | Gross 82.2% (+65 bp YoY) · Operating 59.8% (+249 bp) · Net 49.4% (+198 bp) |
| Cash generation | Operating cash flow $7,386M · Free cash flow $6,893M · 114.8% of net income |
| Capital return | Buybacks $4,021M + dividends $1,260M = $5,281M in the quarter |
| Balance sheet | Cash $12,938M · Cash + short-term investments $14,083M · Total debt $22,071M |
| Full fiscal year | FY2026 revenue $45,903M (+14.8% YoY) · Operating income $28,110M · Net income $23,504M |
| Reaction | −2.0% after hours to $395.99 (the dip had fully reversed by October 29) |
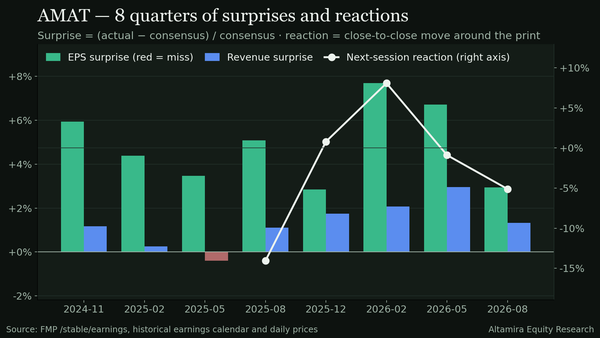
This is a machine that beats by a little, every time: across the last eight quarters, revenue surprises have always been positive but never larger than +4.5%, and EPS surprises always positive (+0.3% to +6.8%). That consistency is exactly why the market prices the multiple, not the surprise.
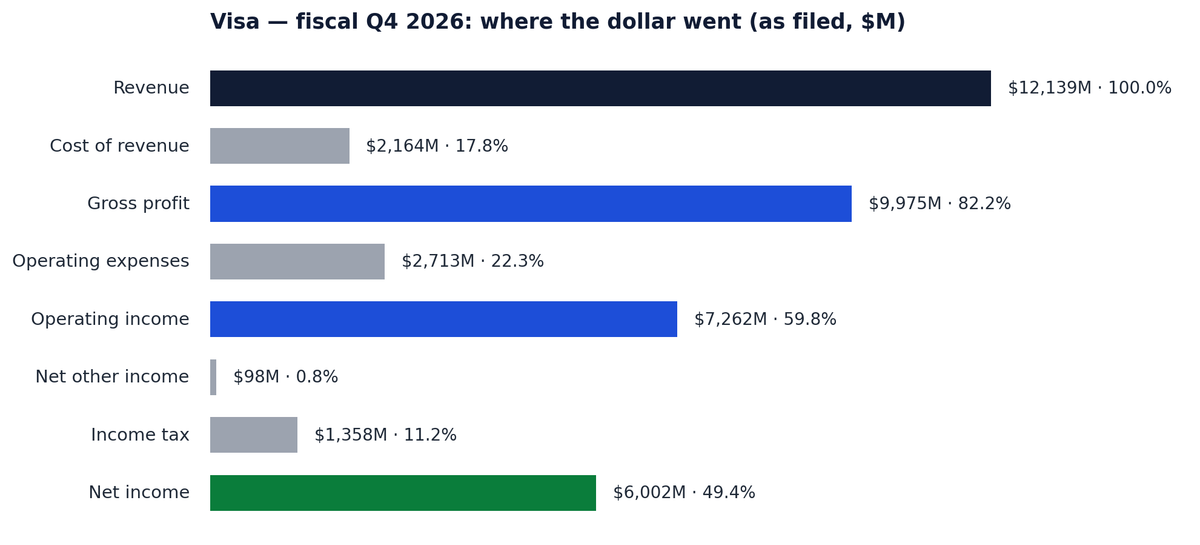
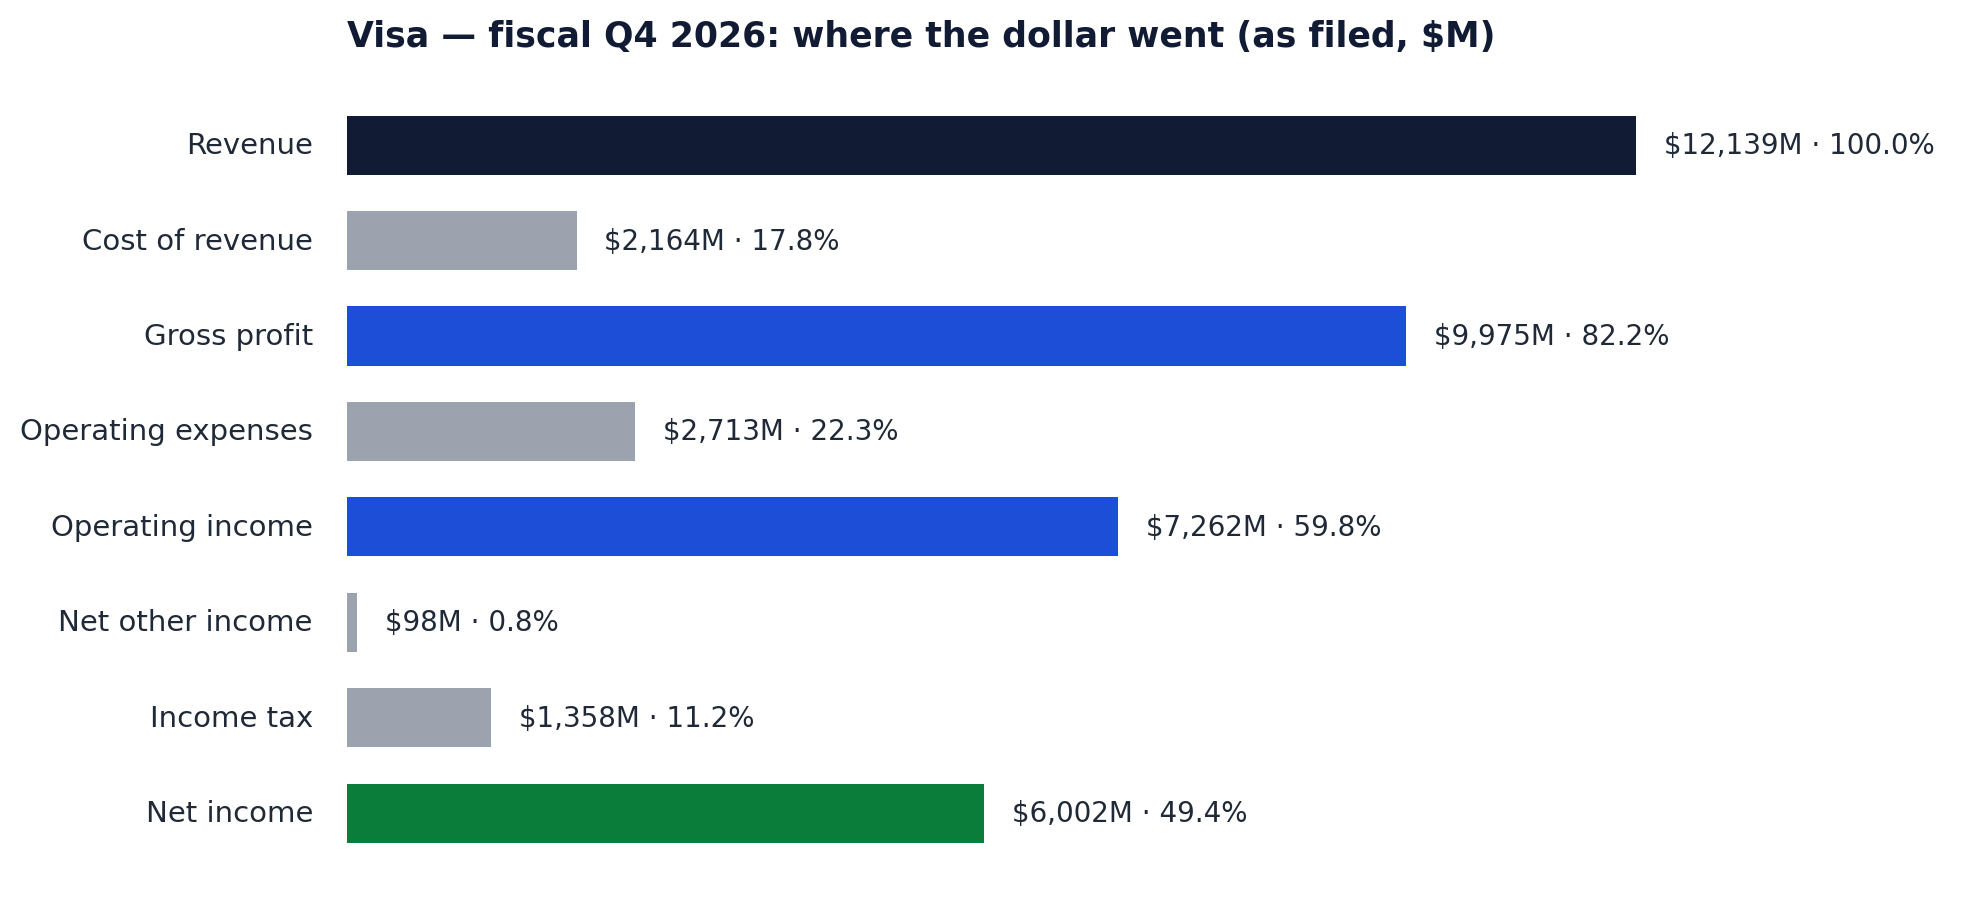
Where the dollar went — fiscal Q4 2026 Sankey
| Flow | $M | % of revenue |
|---|---|---|
| Revenue | 12,139 | 100.0% |
| Cost of revenue | 2,164 | 17.8% |
| Gross profit | 9,975 | 82.2% |
| Operating expenses | 2,713 | 22.3% |
| Operating income | 7,262 | 59.8% |
| Net other income | 98 | 0.8% |
| Income tax | 1,358 | 11.2% |
| Net income | 6,002 | 49.4% |
Exact filed figures, quarterly income statement for the period ending September 30, 2026. Pre-tax income was $7,360M (operating income plus $98M of net other income, after $192M of interest expense); the effective tax rate was 18.5%.
This is the toll-booth shape in one picture: 82 cents of every revenue dollar survives the network's running costs, and 49 cents reaches the bottom line.
How Visa makes money
Visa is a payments technology network, not a lender. It connects consumers, merchants, banks, businesses, partners and governments through VisaNet — its authorisation, clearing and settlement network — and sells card products, digital platforms and value-added services under the Visa, Visa Electron, Interlink, VPAY and PLUS brands. It takes no credit risk on the cards that carry its logo; it earns fees on the volume, transactions and services that run over other institutions' balance sheets. Headquarters: San Francisco; 34,100 employees.
The filed economics show what that model is worth: FY2026 gross margin 80.4%, operating margin 61.2%, net margin 51.2%. Annual revenue has compounded steadily — FY2023 $32,653M · FY2024 $35,926M · FY2025 $40,000M · FY2026 $45,903M.
The operating colour below is from the most recent earnings call on file (fiscal Q3 2026, July 28, 2026 — see the call note in the next sections) and is labelled as that quarter wherever it appears: global payments volume grew +10% in constant dollars, crossing $4 trillion for the first time; processed transactions +10% to 72 billion; cross-border volume excluding intra-Europe +12%; U.S. payments volume +10%; commercial payments volume +13%; Visa Direct transactions +21%; and value-added services revenue +34% in constant dollars to $3.8B.
The quarter in charts
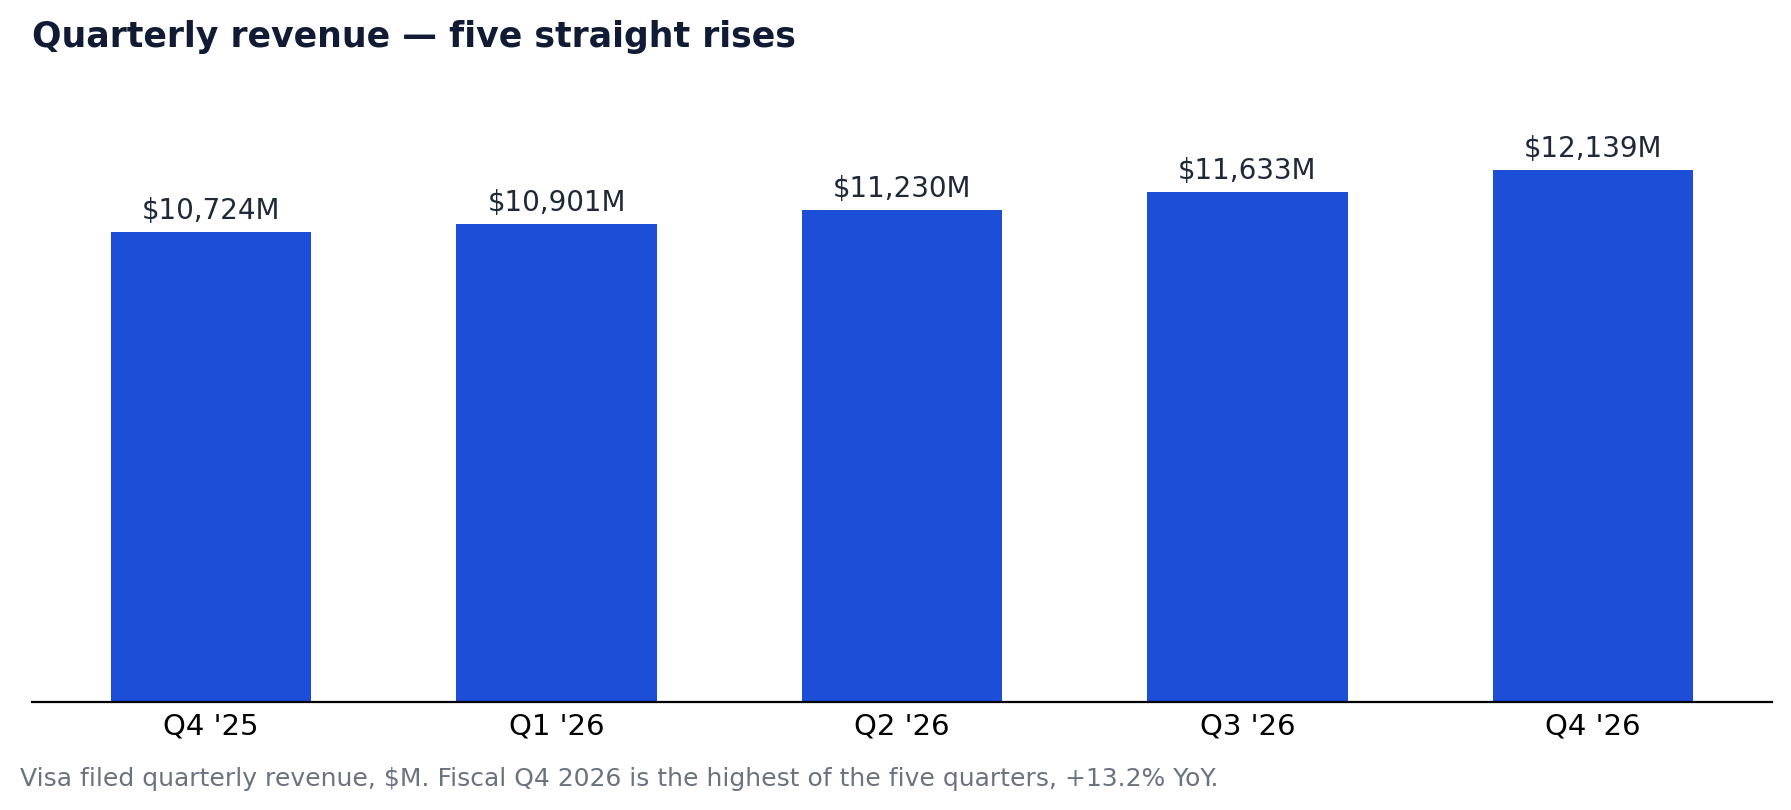
Revenue of $12,139M is the highest of the five quarters shown. The beat itself was small (+0.40%) — in line with Visa's eight-quarter history of modest, always-positive surprises.
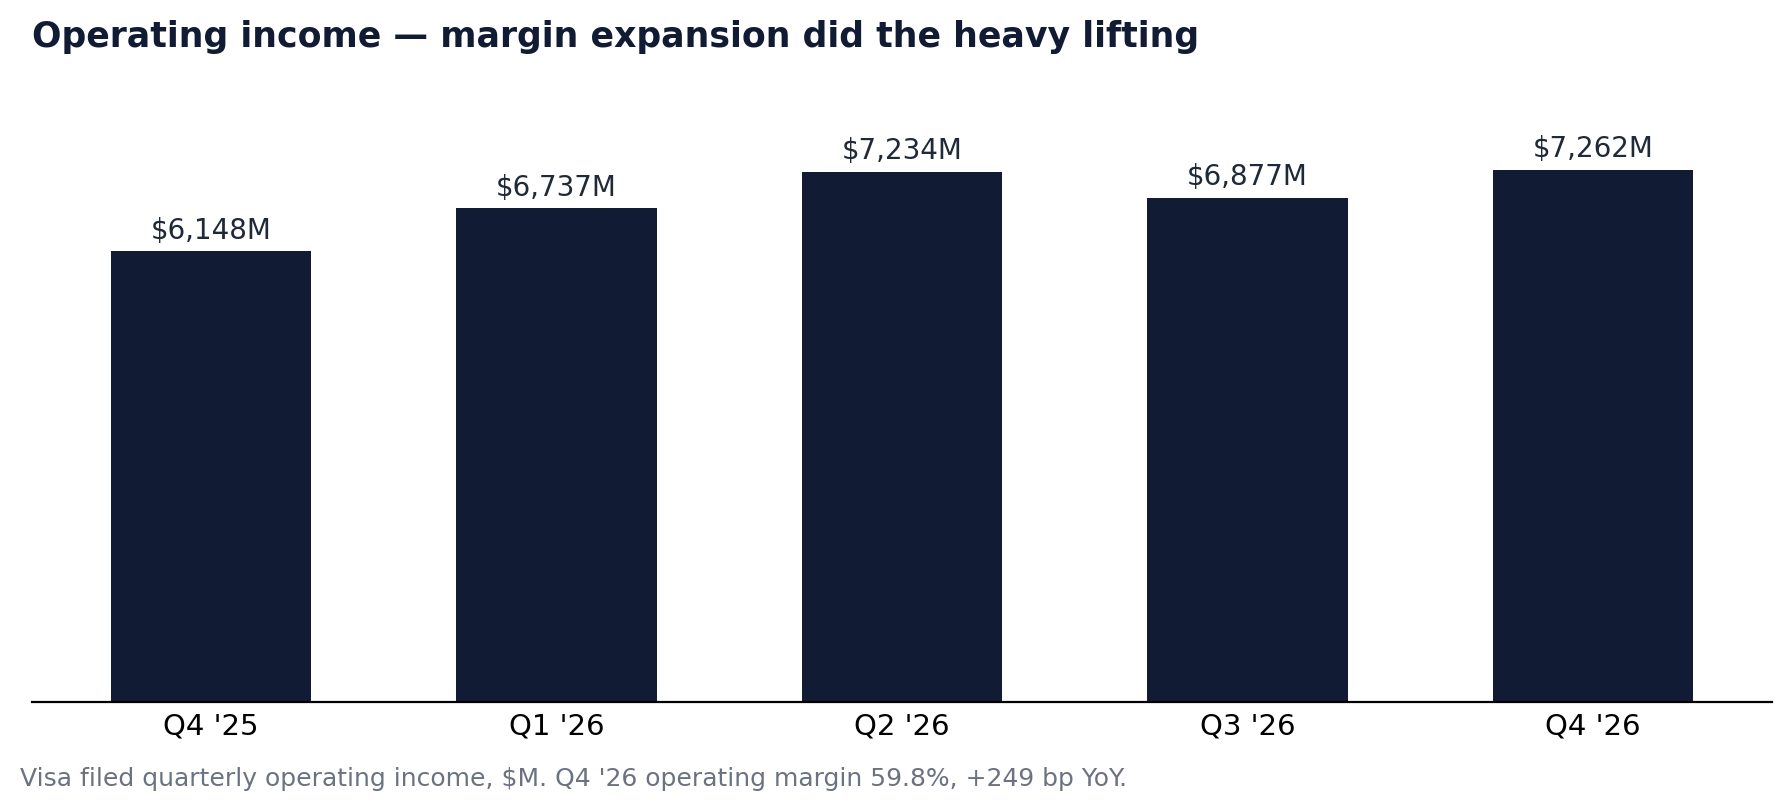
Operating income rose to $7,262M. Adjusted EPS grew +21.8% YoY, helped by a diluted share count down 3.2% YoY to 1,882M after $4,021M of buybacks in the quarter.
What management said — the most recent call on file (fiscal Q3, July 28, 2026)
Call note — read before quoting any "guidance" for this quarter. The earnings-call transcript available when this was written is Visa's fiscal Q3 2026 call, not the fiscal Q4 call. The guidance framing below is therefore what management guided for this quarter on the Q3 call — and the print met that frame. What management said on the fiscal Q4 call, including any fiscal 2027 guidance, was not yet available and is not summarised here.
Guidance (for the quarter just reported). On the fiscal Q3 call, CFO Chris Suh guided fiscal Q4 net revenue growth to the high end of low double digits, operating expense growth in the low double digits, a ~19% Q4 tax rate and Q4 EPS growth in the low end of mid-teens; full-year revenue growth was raised to the low end of low teens and full-year EPS growth to the low end of mid-teens. The fiscal Q4 print met or modestly exceeded that frame: revenue +13.2% YoY against "high end of low double digits" guided, full-year revenue +14.8% against the low end of low teens, and a Q4 tax rate of 18.5% against ~19% guided.
Margins. On the Q3 call, operating expenses had grown 17% YoY — above expectations on marketing, personnel, an FX remeasurement hit and deferred-compensation mark-to-market (described as EPS-neutral) — and GAAP results included $563M of severance tied to workforce changes. Management said efficiency savings are reinvested in the highest-growth opportunities while holding industry-leading margins. The filed fiscal Q4 outcome: operating margin 59.8%, +249 bp YoY — the expansion the Q3 cost spike had obscured.
Demand. Resilient consumer spending, with no signs of the lower-spend consumer weakening; payments volume +10% in constant dollars past $4 trillion for the first time; cross-border excluding intra-Europe +12% (e-commerce +16%, travel +10%); plus a FIFA World Cup lift to U.S. inbound spend in June.
Capital return. On the Q3 call: $4.9B of buybacks and $1.3B of dividends in that quarter, a $250M litigation escrow (described as having the same effect as a buyback) and $28.4B remaining under the buyback authorisation at end-June. The fiscal Q4 filed outcome: buybacks of $4,021M and dividends of $1,260M.
Analyst Q&A. Goldman Sachs pressed on quantifying the World Cup boost to cross-border travel — Suh stressed diversification, with no region above 25% of cross-border volume. Susquehanna asked about the gap between cross-border volume and international revenue (lapping the prior year's volatility peak, plus mix and yield, including lower-yield Visa Direct). UBS pressed the Pismo/DPS strategy — CEO Ryan McInerney said the integrated offer targets small and mid-sized banks and fintechs, while large issuers keep customised platforms. KBW asked whether workforce savings drop to the bottom line — management said they are continually reinvested against strategic priorities. Bernstein closed on agentic commerce — McInerney called it a "when, not an if" tailwind built on trust, and declined to pin down timing.
The Key Issue
Thesis. Visa's core consumer payments volume is a mature, low-double-digit engine. The question is whether the second engine — value-added services, commercial payments and Visa Direct — can keep total growth in the low teens long enough to justify 32.6× trailing earnings, or whether the multiple, not the business, is now the risk.
Evidence for — "the second engine is real"
- The mix is already shifting. On the fiscal Q3 call, value-added services revenue grew +34% in constant dollars to $3.8B — roughly a third of that quarter's revenue base growing at nearly three times the corporate rate — commercial payments volume grew +13% and Visa Direct transactions +21%, both ahead of core payments volume (+10%).
- The print delivered the guide. Fiscal Q4 revenue +13.2% YoY and FY2026 revenue +14.8% YoY to $45,903M, at or above the Q3 call's raised full-year frame. Growth is not decelerating into single digits.
- Cash conversion is the proof of quality. Fiscal Q4 free cash flow of $6,893M at 114.8% of net income, $5,281M returned in one quarter, and margins expanded on every line even after the Q3 cost spike.
- The underlying economics are network economics. Return on invested capital of 24.7% and return on capital employed of 31.1% on five-year averages are not a hot year — they are what a toll booth with no credit risk earns through a cycle.
Evidence against — why the market sold a beat
- Price leaves no slack. P/E TTM 32.6×, EV/Sales 16.5×, EV/EBITDA 25.1× and a free-cash-flow yield of 2.9% mean the stock needs the low-teens growth path to persist. A +1.2% EPS beat bought a −2.0% after-hours move, inside the ±2.3% historical average — the market treated a clean quarter as fully priced.
- The fastest-growing pieces are the lowest-yielding. Management itself attributed part of the Q3 cross-border volume/revenue gap to mix, including lower-yield Visa Direct. Volume growth in new flows does not convert one-for-one into revenue growth.
- Costs are being reinvested, not harvested. Q3 operating expenses grew 17% YoY with $563M of severance, and management's stated policy is to reinvest efficiency savings. Operating leverage depends on a discipline the next call has not yet re-confirmed for fiscal 2027.
- The structural risks sit outside the print. Interchange regulation and litigation in the U.S. and EU, and account-to-account / open-banking rails that bypass cards entirely. No earnings beat offsets those.
- Agentic commerce is unpinned. On management's own Q3 wording it is a "when, not an if" — with timing explicitly not given.
What to watch
- The fiscal Q4 call — fiscal 2027 revenue and EPS guidance first, value-added services growth second.
- Whether value-added services can hold anything near +34% as its base grows.
- Cross-border travel after the World Cup lift annualises.
- Mastercard's print, as the cross-check on whether Visa's mix shift is company-specific or industry-wide.
- Any interchange or litigation development, which no earnings beat can offset.
Sources: Visa's filed quarterly and annual financial statements (fiscal Q4 2026, period ending September 30, 2026) and consensus estimates, via Financial Modeling Prep, pulled October 29, 2026; Visa fiscal Q3 2026 earnings-call transcript (July 28, 2026) for all management commentary, labelled as that quarter throughout.
Disclosure: This post is published for information and education only and is not financial advice, a recommendation, or an offer to buy or sell any security. The author may hold positions in companies discussed. Figures are believed accurate as of October 29, 2026; estimates are consensus figures and may differ by source.