VICI Properties: The EPS Miss Is the Wrong Number — and the Right One Still Hasn't Posted
Every earnings season produces one print that punishes investors for reading the headline number. VICI's third quarter is that print.

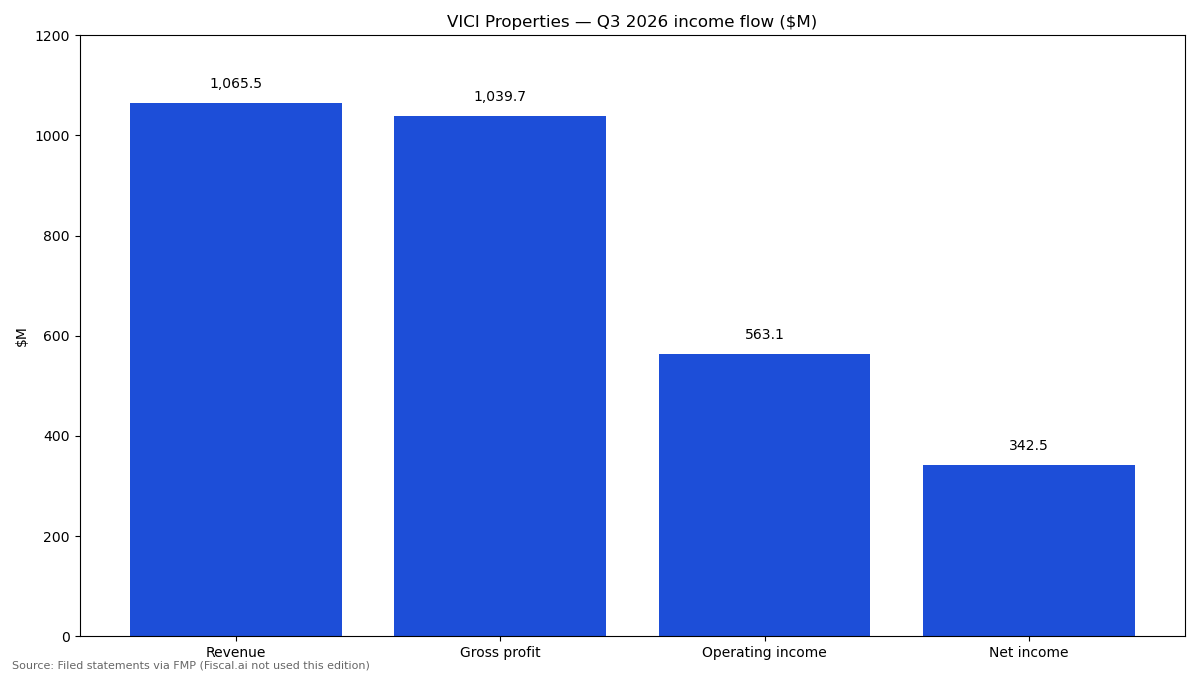
Revenue $1,065.5M, +0.50% vs estimate and +5.76% YoY · GAAP EPS $0.31 vs $0.72 (−56.94%) after $459.1M of other expenses · after-hours +2.70% — the market looked through GAAP to the rent
The story in 30 seconds - VICI's third quarter is a landlord's quarter: rent revenue of $1,065.5M beat estimates by 0.50% and grew 5.76% year over year, with a 97.58% gross margin — the triple-net model working exactly as designed. - The GAAP headline missed badly — EPS of $0.31 versus $0.72 expected — because a single $459.1M other-expenses line, whose cause is not stated in the filed summary, cut operating income. Cash told the opposite story: free cash flow of $649.3M and a $495.2M dividend paid in full. - The open question is verification: the sector's deciding metric, AFFO per share, plus tenant coverage and guidance, all wait on an earnings-call transcript that had not posted when the numbers closed — so this story is about what the rent proved, and what is still unproven.
Every earnings season produces one print that punishes investors for reading the headline number. VICI's third quarter is that print. A reader scanning the scoreboard sees earnings per share of $0.31 against $0.72 expected — a 56.94% miss, the kind that normally takes a stock down hard. The stock went up: +2.70% after hours, a move larger than its own eight-quarter average absolute move of ±1.59%. The market was not being generous. It was reading a different line.
VICI is a net-lease REIT: it owns experiential real estate — casino resorts and entertainment properties — and leases it back to operators on long triple-net terms. Its revenue is rent, its costs are mostly interest and overhead, and its GAAP earnings are routinely swung by non-cash and episodic items that have little to do with whether the rent was paid. This quarter the swing item sits in plain sight in the filed statements: $459.1M of other expenses, against total operating expenses of $476.6M. Strip the headline away and the operating facts are plain: revenue $1,065.5M, up 5.76% year over year; gross profit $1,039.7M, a 97.58% margin; operating cash flow $655.2M; free cash flow $649.3M; and $495.2M of dividends paid in the quarter.
And yet the quarter cannot be closed with confidence, for one honest reason: the metric this sector is actually judged on — AFFO per share, and its growth — is not in the filed summary, and the earnings-call transcript that would disclose it had still not posted when the earnings data closed. Tenant coverage and the deal pipeline are unverified for the same reason. A rent roll that performed, a cash flow that covered the dividend, and a core metric still missing: that is the shape of this story.
In this post: (1) the print in one picture — the flow of a rent dollar; (2) what to make of it — including the quality-of-earnings line; (3) the long view — five years of acquisition-led rent growth against today's debt load; (4) the Key Issue — what must be verified before the rent story can be called proven.
At a glance — Q3 2026
This scoreboard is the quarter on one screen: what was filed, what consensus expected, and how the market reacted.
- Revenue: $1,065.5M vs $1,060.1M expected · +0.50% surprise · +5.76% YoY · +0.66% QoQ
- GAAP EPS: $0.31 vs $0.72 expected · −56.94% surprise · −56.34% YoY · estimate range $0.71–$0.72 (4 analysts) · GAAP EPS is not the AFFO yardstick for a net-lease REIT
- Guidance: NOT STATED — the earnings-call transcript had not posted when the data closed, so no guidance class can be assigned, and none is invented here
- Reaction: +2.70% after-hours, to $24.16 from $23.52 · 8Q average absolute move ±1.59%
- Margins: gross 97.58% (−175 bp YoY) · operating 52.85% (−4,483 bp YoY, after the $459.1M other-expenses line) · net 32.15%
- Cash generation: operating cash flow $655.2M · capital expenditure $5.9M · free cash flow $649.3M · free cash flow was 187.20% of GAAP net income
- Dividend and share count: dividends paid $495.2M in the quarter · diluted shares 1,100.6M, +0.95% QoQ
- Balance sheet: cash $270.3M · total debt $17,825.7M · net debt $17,555.4M
The quarter in one line: the rent arrived on time and grew 5.76% — the GAAP miss lives in one unexplained $459.1M line, and the market, up 2.70%, declined to confuse the two.
Q3 2026 flow — where the rent dollar went
This flow shows how each revenue dollar was split between property costs, overhead and episodic expenses, interest, tax and profit.
- Revenue: $1,065.5M (100%)
- Cost of revenue: $25.8M (2.4%)
- Gross profit: $1,039.7M (97.6%)
- Operating expenses: $476.6M (44.7%) — including other expenses of $459.1M
- Operating income: $563.1M (52.8%)
- Interest expense: $215.0M (20.2%)
- Pre-tax income: $349.4M (32.8%)
- Net income: $342.5M (32.1%)
Exact filed figures. Operating expenses of $476.6M are general and administrative expense of $17.5M plus other expenses of $459.1M, whose cause is not stated in the filed summary — flagged, not explained.
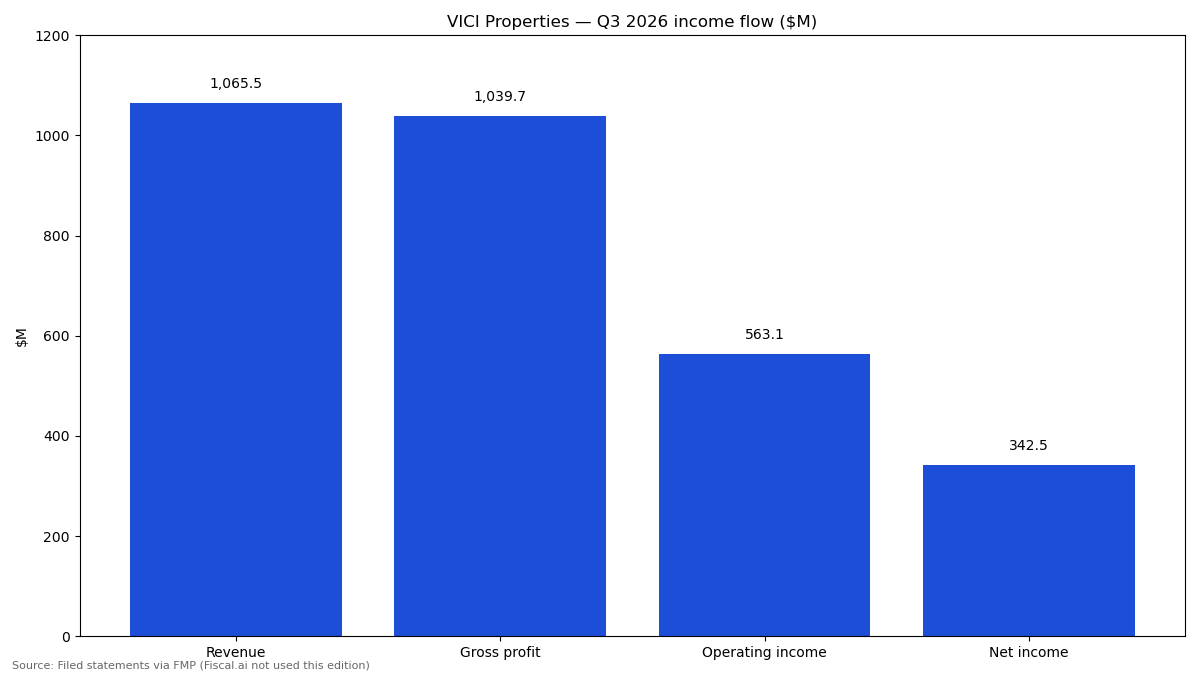
VICI's Q3 2026 income flow: a rent dollar survives almost intact to gross profit — the quarter's story happens below that line. Source: company filings.
What to make of this print
Seven readings of the quarter — each is a finding plus what it means for the story.
- Revenue is the cleanest line in the print — and for a landlord, it is the business. Rent revenue of $1,065.5M beat by 0.50% and grew 5.76% year over year and 0.66% sequentially. Triple-net rent does not surprise much when tenants are paying, and that is the point: the top line says the rent roll — the asset this company actually is — performed. Judge this quarter's health from the rent and the cash, not from a GAAP bottom line that a single expense line can halve.
- Quality of earnings — GAAP-distorted, and not yet AFFO-verified. GAAP EPS fell 56.34% year over year while the diluted share count rose just 0.95% sequentially to 1,100.6M — dilution explains almost none of the drop, and share-count effects flatter nothing here. The drop is the $459.1M other-expenses line flowing through operating income. Meanwhile cash told the opposite story: free cash flow of $649.3M was 187.20% of GAAP net income. The operational cash earnings were strong; the sector's own measure — AFFO per share — is absent from the print and is this story's central gap.
- The $459.1M question is the quarter's real unknown. Other expenses of $459.1M are 43.1% of revenue and 96.3% of all operating expenses in the filed summary, and they cut the operating margin to 52.85% from a long-window level near the high nineties (the long-window gross margin in the filed history is 99.33% and the net margin 69.28%). The filed summary does not state the cause, and this post does not guess one. What can be said: the expense did not touch revenue, gross profit, operating cash flow or the dividend — which is why the market looked through it. What cannot be said, until the transcript and release materials post, is whether it recurs. That single distinction — one-off versus recurring — is worth more than the entire EPS debate.
- The dividend was paid, in cash, at scale. VICI paid $495.2M of dividends in the quarter against $649.3M of free cash flow — the distribution consumed about three-quarters of quarterly free cash flow on those filed figures. For an income REIT this is the product working as designed; it also means the margin for error lives in AFFO growth, because a distribution of that scale leaves little room for a rent or coverage stumble.
- Debt is the honest counterweight, and it is not hidden. Total debt of $17,825.7M against cash of $270.3M, and quarterly interest expense of $215.0M consuming 20.2% of revenue. Net-lease REITs are levered by design — the debt funded the portfolio that pays the rent — but this is why the interest-rate environment is a first-order variable for this business, not background noise: every refinancing moves the spread between what new properties yield and what money costs.
- The price has already started to reconsider — quietly. From the $23.52 pre-print close, the shares rose after hours to $24.16 and stand at $25.63 on the latest bar in the data set (Nov 5) — above the 50-day average of $24.05, yet still 4.69% below the 200-day average of $26.89 and 16.32% below the 52-week high of $30.63, with a 12-month return of −15.27%. That is a market reconsidering, not one that has forgiven: the longer trend has not yet turned.
- There is no in-universe peer to hide behind. VICI is the only pure net-lease REIT in this newsletter's 42-name universe. Its percentages and multiples cannot be cross-checked against a sibling in the same set — one more reason the missing AFFO line matters: for this company, the primary source is the only source.
Takeaway: a landlord's quarter in which the rent, the cash and the dividend all did their jobs, the GAAP headline did not, and the one disclosure that would settle the argument — AFFO per share — has not posted yet.
How VICI Properties makes money
This section shows where revenue actually comes from — the mix decides which growth rates matter.
Sector primer — experiential net-lease REITs. These landlords own mission-critical leisure real estate — casino resorts, entertainment venues and similar destination properties — leased to operators on very long, triple-net terms: the tenant pays taxes, insurance, maintenance and most operating costs, so the landlord's revenue is close to pure rent. Economics turn on rent coverage (the tenant's property-level earnings versus the rent owed), the cap-rate spread (the yield on new sale-leaseback deals versus the landlord's cost of debt and equity), and tenant concentration, because a handful of large operators usually account for most of the rent roll. GAAP earnings are a poor yardstick — depreciation and episodic charges swing them — so the sector is judged on AFFO per share, its growth, and the dividend it funds.
VICI's filed quarter shows the model's shape in numbers. Of $1,065.5M of revenue, only $25.8M was consumed by cost of revenue — a 97.58% gross margin that no operating business can match, because the tenants carry the properties' operating costs. General and administrative expense was just $17.5M. The P&L's real costs sit below the rent line: interest expense of $215.0M on the debt that funded the portfolio, and this quarter's $459.1M of other expenses. Cash generation is correspondingly direct: $655.2M of operating cash flow on $1,065.5M of revenue, and capital expenditure of only $5.9M — the landlord does not fund the properties' upkeep. Tenant-by-tenant rent splits are not in the filed summary used here, so none are invented; the exposures to watch — tenant concentration among top operators and gaming demand, including Las Vegas visitation — are named without unverified percentages attached.
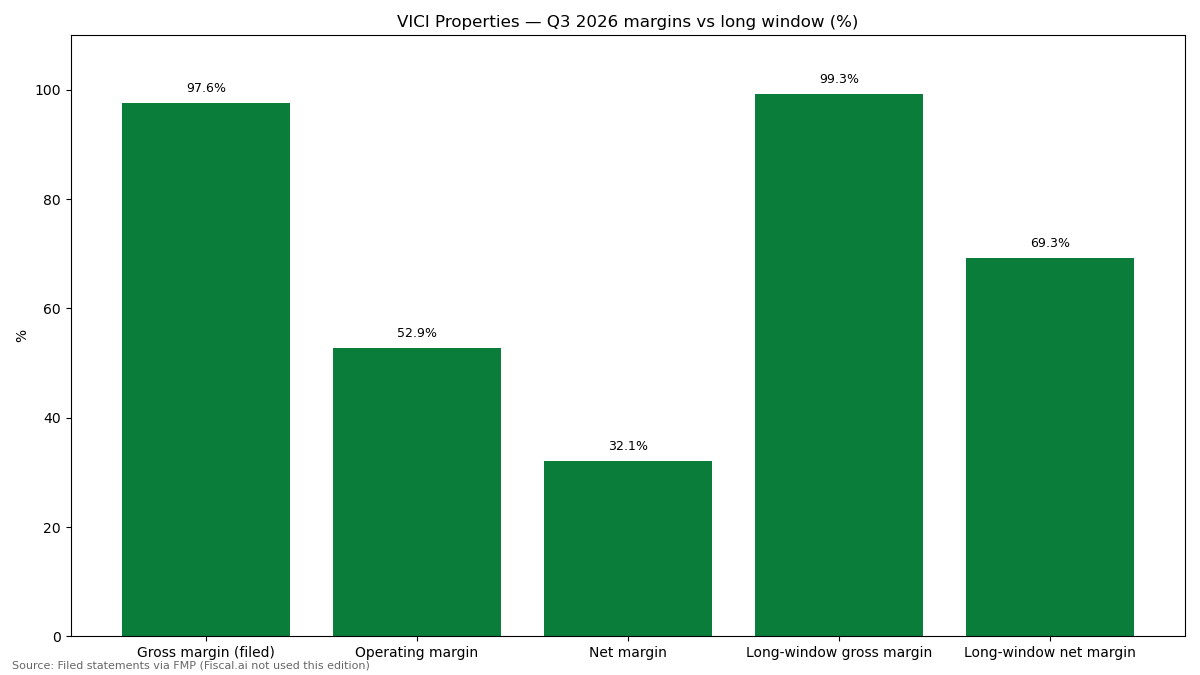
Margins: the rent line held its structure at 97.58% — the quarter's swing sits in one expense line below it. Source: company filings.
The long view
One quarter is weather; five years are climate. For a REIT, the long view reads differently: growth is acquired property by property, margins are structural, cash is the product, and returns on capital are capped by the cap rates the portfolio was assembled at. The figures below are computed from the filed history in the data set.
Revenue growth
Growth is the first quality test, because a landlord that cannot grow rent must grow by acquisition — and acquisitions must be accretive per share, not just larger. The five-year revenue CAGR in the filed history is 26.73% and the three-year CAGR 15.49% — the signature of a portfolio assembled by large sale-leaseback deals in the earlier window, now maturing: this quarter's print was +5.76% year over year. The two-year check is deceleration from deal-led to rent-led growth, which is normal and healthier — provided AFFO per share, the per-share test, keeps pace. Judgment: the long growth record is excellent and unavoidably acquisition-flattered; the forward question is per-share, and it is exactly the question the missing AFFO line leaves open.
Operating margin
Margin tells you whether the triple-net structure is intact — in this sector it should be, almost by definition. The long window shows a gross margin of 99.33% and a net margin of 69.28%. This quarter's gross margin kept the structure at 97.58% (−175 bp year over year), while the operating margin printed 52.85% — a swing driven by the $459.1M other-expenses line, not by rent economics. Judgment: the structural margin is intact where it is defined — at the rent line; the operating swing is an expense event to be explained when the transcript posts, not a margin trend, unless it recurs.
Cash — free cash flow margin and conversion
Cash is the product a REIT sells its shareholders. Over the long window, operating cash flow runs at 98.15% of net income, and this quarter converted GAAP profit into cash at 187.20% — $649.3M of free cash flow on $342.5M of net income — the arithmetic signature of non-cash charges sitting in the GAAP line while rent arrived in cash. The dividend took $495.2M of that cash. Judgment: cash generation is the strongest verified leg of the story — it is the reason the GAAP miss did not move the stock down.
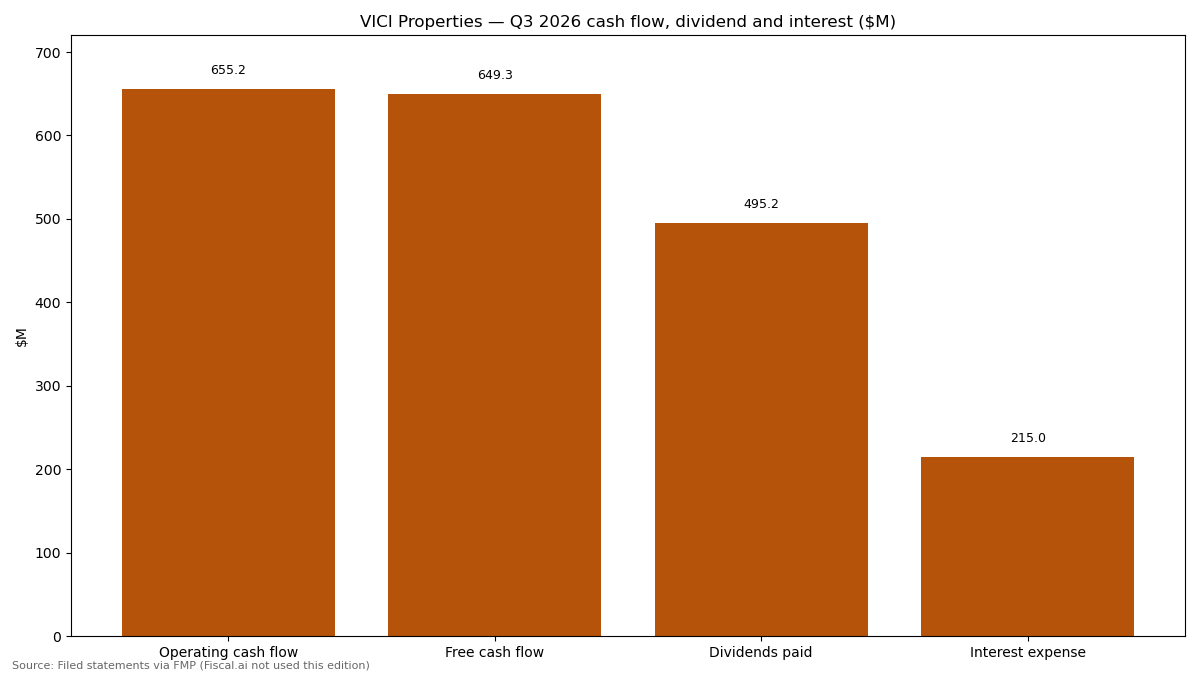
Cash: free cash flow covered the dividend with room — the quarter's most decision-relevant arithmetic. Source: company filings.
Return on invested capital
ROIC asks what the portfolio earns on everything invested in it — for a REIT, the honest answer is usually the cap rate it was assembled at, plus rent growth. The five-year ROIC in the filed history is 7.26% and ROCE 7.27%. Read in sector terms, a return near 7% on capital alongside a double-digit free-cash-flow yield on the equity is the normal shape of a net-lease balance sheet — the debt in the structure lifts the equity's cash yield above the portfolio's own return. It also caps the compounding: this is an income instrument with growth options, not a compounder. Judgment: returns on capital are sector-normal; the story stands or falls on cash yield, coverage and the debt load, in that order.
Beyond the print — the business this quarter
The earnings release is the scoreboard; this section is what changed in the business itself during and around the quarter, each item traced to the filed data.
The dividend went out at full scale (filed). $495.2M of dividends were paid in the quarter — the largest single use of cash after debt service, and the practical proof that management did not treat the GAAP expense line as a cash event. A board that believed the quarter's profit drop was economic would have had a conversation about the distribution; the filed cash flow shows it paying the distribution in full.
The share count crept — it did not jump (filed). Diluted shares rose 0.95% sequentially to 1,100.6M. For a REIT that funds growth with equity, a sub-1% quarterly creep is consistent with routine issuance rather than a transformational deal closing in the quarter — and it sets the bar the missing AFFO disclosure must clear: per-share growth, after this creep, is the accretion test.
Interest is the second rent line (filed). Interest expense of $215.0M in the quarter — 20.2% of revenue — on total debt of $17,825.7M, against cash of just $270.3M. The exposure is plain: the cap-rate spread is rate-sensitive, so every refinancing and every new deal's financing cost moves the accretion math. This is the channel through which macro reaches an otherwise insulated rent roll.
The disclosure gap itself is a fact. When the earnings data closed, the call transcript had still not posted, guidance was not stated, and AFFO, tenant coverage and pipeline were all unverified. For most companies that is a footnote; for a REIT whose entire valuation language is AFFO, it is this story's central limitation.
What management said — filing-only this edition
This section normally reports what management guided and claimed, in their own words. This edition cannot — and says so rather than filling the space.
No verbatim management commentary is available for Q3 2026 in the source set. The earnings-call transcript had not posted when the earnings data closed its definitive edition, so no quotes are reconstructed from summaries and no guidance is inferred: guidance class is NOT STATED, and this section is filing-only. The filed facts on record this quarter are the statements themselves: revenue of $1,065.5M, $459.1M of other expenses within operating expenses, $495.2M of dividends paid, and a balance sheet carrying $17,825.7M of total debt. When the transcript posts, the three disclosures that matter are AFFO per share and its growth rate, tenant coverage, and any accretive deals.
The Key Issue — verified on rent and cash, unverified on AFFO: what settles whether the rent story is proven?
Thesis: VICI's rent, cash flow and dividend all verified this quarter. But the sector's deciding evidence — AFFO per-share growth, tenant coverage, and the cause of a $459.1M expense line — is still unposted, and a debt load of $17,825.7M means the cost of being wrong about coverage is amplified. The question is not whether the rent arrived; it is what the missing disclosures will say about how durable, and how per-share, that rent really is.
Evidence for (the rent story is intact): revenue grew 5.76% year over year and beat estimates; gross margin kept 97.58%; free cash flow of $649.3M covered the $495.2M dividend with room; the five-year record shows revenue CAGR of 26.73% and free-cash-flow CAGR of 23.28%; and the market's own reaction on print night — up 2.70% on a GAAP miss — says holders read the cash, not the headline.
Evidence against (unverified can hide a lot): debt of $17,825.7M with interest consuming 20.2% of revenue makes the equity a levered claim on the rent roll — small coverage slips become large equity moves; tenant concentration among a few large gaming operators is the sector's standing risk and coverage is currently unverified; the dividend consumed about three-quarters of quarterly free cash flow, leaving a thinner buffer if AFFO stalls; per-share growth has lagged total growth badly in the long record (free cash flow per share compounding far more slowly than total free cash flow) — the dilution tax on deal-led growth; the $459.1M expense is unexplained in the source set; and the share price, despite the post-print recovery, still sits below its 200-day average with a −15.27% 12-month return.
What to watch: (1) The transcript and release materials when they post — AFFO per share and its growth rate is the single disclosure that firms this story up. (2) Tenant coverage metrics for the major operators, and any sign of gaming softness. (3) External datapoint: Las Vegas visitation and gaming-revenue data — the macro backdrop for the rent roll's largest exposure; a sustained visitation decline would test coverage before it tests rent. (4) The cause and recurrence of the $459.1M other-expenses line. (5) Deal pipeline announcements — sale-leaseback origination at spreads that are accretive after the share-count creep. (6) Historical analogy: the net-lease sector's own history says high-yield landlords get re-priced twice — first on rates, then on coverage — and only the second re-pricing is permanent; the analogy argues the coverage disclosure, not the rate path, is the one that decides this story. The forward question: when AFFO per share finally posts, will it show mid-single-digit growth behind a verified rent roll — or will it show that the quarter's calm was the calm of an incomplete disclosure?
Sources: company filings and consensus estimates for Q3 2026 (quarter ended September 30, 2026, reported October 28, 2026); filed five-year history. Gaps, stated plainly: AFFO per share, tenant coverage, guidance and deal pipeline are unverified because the earnings-call transcript had not posted when the data closed; the cause of the $459.1M other-expenses line is not stated in the filed summary; tenant-level rent splits are not in the source set and are not estimated.
Disclosure: The author may hold positions in companies discussed. This post is general information about a company's reported results, not investment advice or a recommendation.