Vertiv: Orders Doubled, Guidance Raised — Now the Multiple Has to Earn It
Vertiv opened its call with a rebuttal.

Revenue +61% YoY to $4,313M · adjusted EPS $2.21 beat consensus by 21% · full-year guidance raised to $14.7B of sales and $7.15 of adjusted EPS
Company Insights · Vertiv (NYSE: VRT) · Q3 2026 (quarter ended September 30, 2026), reported Wednesday, October 28, 2026 before the open
The story in 30 seconds
- Vertiv beat on both lines by a wide margin — revenue $4,312.8M (+61.2% YoY), adjusted EPS $2.21 — and organic orders more than doubled year over year.
- Guidance was raised on every line: FY26 sales of $14.7B, adjusted EPS of $7.15, an adjusted operating margin of ~24% and adjusted free cash flow of $2.7B.
- The open question is conversion: orders and book-to-bill are not disclosed by company policy, so the raised guide must be judged on execution evidence alone.
Vertiv opened its call with a rebuttal. Executive Chairman David Cote, paraphrasing Mark Twain, told the market the rumours of the company's demise had been greatly exaggerated — a direct answer to a quarter of chatter about supply-chain failures, overheating equipment and lost ground to competitors. The numbers were the real rebuttal: revenue up 61% year over year, an adjusted operating margin of 25.2%, and the one demand figure Vertiv normally refuses to give — organic orders up more than 100% — disclosed precisely because it settles the argument.
The market's response was measured: the stock closed up 2.8% to $249.78, against an average absolute move of ±8.6% over eight quarters. A beat of this size, with guidance raised on every line, would normally re-rate a stock. Instead the close says investors believe the print and will not pay more for it — the question is no longer whether Vertiv can grow, but whether growth this fast converts, quarter after quarter, at the margins now promised.
That question has a wrinkle: Vertiv does not disclose orders or book-to-bill by policy. The third-quarter disclosure was a one-off exception, management said so explicitly, and it will not be repeated. From here, the raised guide must be believed on execution evidence alone.
In this post: 1. The print in one picture — where the revenue went. 2. What to make of it — seven readings of the quarter. 3. The long view — five years from margin trough to AI build-out. 4. The Key Issue — whether doubled orders become durable ~24% margins when book-to-bill is undisclosed.
At a glance — Q3 2026
| Revenue | $4,312.8M vs $3,749.3M est · +15.03% surprise · +61.18% YoY · +31.72% QoQ |
| EPS (adjusted) | $2.21 vs $1.82 est · +21.43% surprise · GAAP diluted EPS $1.95 |
| Margins | Gross 38.11% (+33 bp YoY) · GAAP operating 22.81% (+232 bp) · Adjusted operating 25.2% (+290 bp) · Net 17.73% (+283 bp) |
| Cash generation | Operating cash flow $794.0M · Free cash flow $654.9M · 85.7% of net income |
| Balance sheet | Cash $3,512.9M · Cash + short-term investments $3,711.7M · Total debt $3,268.2M · Net cash $244.7M |
| Demand | Organic orders +100%+ YoY (one-off disclosure) · Net sales +61% (~55% organic + 6% acquisitions) |
| Guidance | Raised: FY26 sales $14.7B · Adj EPS $7.15 · Adj operating margin ~24% · Adj FCF $2.7B |
| Reaction | +2.8% close to $249.78 (8Q average move ±8.6%) |
The quarter in one line: the largest double beat in this universe this season — a 15% revenue surprise and a 21% EPS surprise, with guidance raised on every line — from a company that then said it will go back to not disclosing its order book.
Where the dollar went — Q3 2026
| Flow | $M | % of revenue |
|---|---|---|
| Revenue | 4,312.8 | 100.0% |
| Cost of revenue | 2,669.4 | 61.9% |
| Gross profit | 1,643.4 | 38.1% |
| Operating expenses | 659.6 | 15.3% |
| Operating income | 983.8 | 22.8% |
| Total other income | 11.0 | 0.3% |
| Income tax | 230.3 | 5.3% |
| Net income | 764.5 | 17.7% |
Exact filed figures, quarterly income statement for the period ending September 30, 2026. Operating expenses: SG&A $556.9M + other $102.7M (research and development is bundled in the data extract). The effective tax rate was 23.1%.
What to make of this print
- The beat was volume, not accounting. Revenue beat consensus by $563.5M and grew 61.2% YoY — roughly 55 points organic, 6 from acquisitions. Part of the sequential jump (+31.7% QoQ) is recovered revenue: about $100–150M delayed by second-quarter supply-chain issues landed in the third quarter (per the CFO on the call). Strip that out and the run-rate is still the fastest in company history — and the fourth-quarter guide of roughly flat sequential sales is the honest consequence, not a slowdown.
- Quality of earnings — operational. Adjusted EPS rose 78% YoY to $2.21 (call figure) while the diluted share count rose only 0.11% quarter over quarter, with no repurchases in the quarter. None of the EPS growth was manufactured by a shrinking count; it is volume and operating leverage.
- Margin expansion is real — and it is the guide now. Adjusted operating margin reached 25.2% (+290 bp YoY) on adjusted operating profit of ~$1.1B (+83%), and management raised the full-year margin guide to ~24% (+360 bp vs 2025): the third-quarter level is presented as sustainable, not a peak. The Americas ran at a 29.4% adjusted margin; Asia-Pacific expanded 380 bp to 17%.
- Cash kept up with earnings — this time. Free cash flow of $654.9M converted 85.7% of net income, adjusted free cash flow rose 50% YoY to $652M, and the balance sheet sits in net cash. For an industrial growing at 61%, that is the difference between a growth story and a working-capital trap; the inventory build discussed in Q&A is the line to follow.
- Demand was disclosed once — and it doubled. Organic orders grew more than 100% YoY, balanced across customer types with or without neocloud demand, on top of a strong first half. The disclosure proves demand at a point in time; the policy of not repeating it withholds the series that would prove durability.
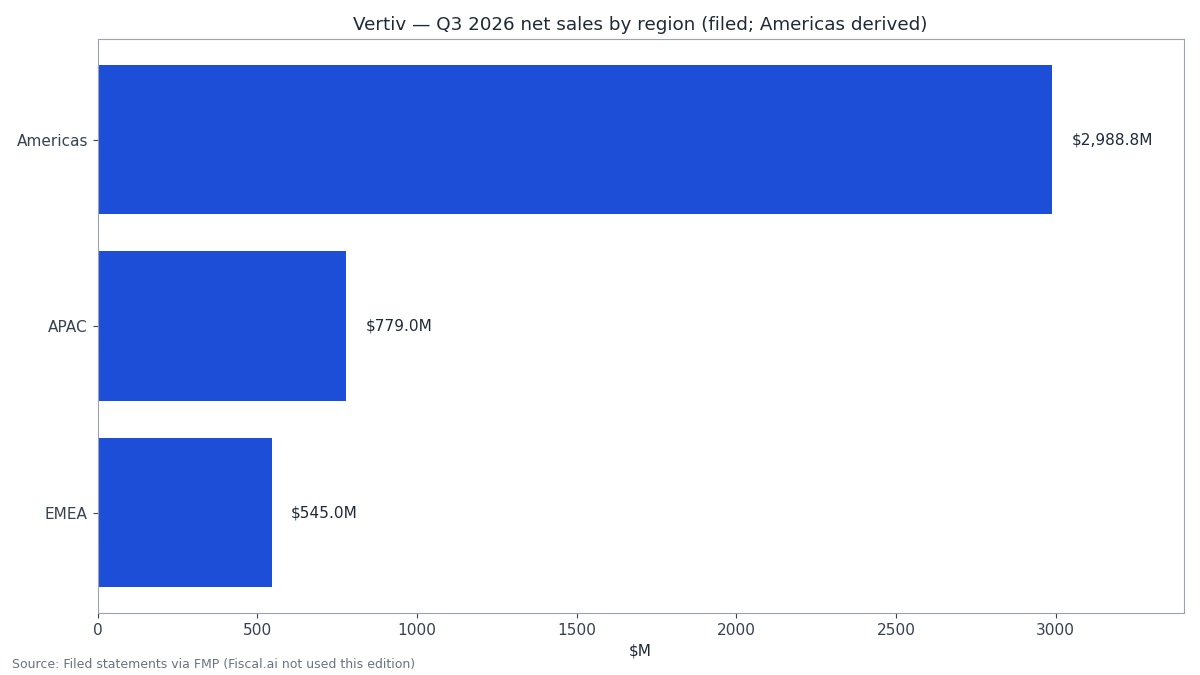
- Every region fired. Americas +75% reported (+66% organic), Asia-Pacific +50% (+48%), EMEA +23% (+19%), with the EMEA pipeline approximately doubling YoY and APAC strength broad-based in Australia and India with early improvement in China.
- The debate has moved from execution to price. The stock rose only 2.8% on a 21% EPS beat because the valuation already capitalises much of this future: a trailing price/earnings multiple of 45.6× and a free-cash-flow yield of 3.24% on the reported dashboard basis. Execution can keep beating while the multiple compresses as fast as earnings grow.
Takeaway: operationally this is a flawless quarter — demand, margin, cash and guidance all moved the right way at once. The question it leaves is about proof: an order book the company has chosen to keep dark, behind a guide that assumes conversion continues.
How Vertiv makes money
Data-center infrastructure is the physical layer of AI: the power chain from grid connection to rack, the thermal chain that removes heat — air and, increasingly, liquid cooling — plus racks, modular systems and lifecycle services. Demand is set by hyperscaler and neocloud programmes measured in gigawatts; supply is constrained by factories, components and skilled labour; margins expand with volume and mix, and contract just as fast when volume falls. Peers covered in this universe: Vertiv, GE Vernova, Quanta Services, Arista Networks and Broadcom.
Vertiv sells the equipment every AI data centre needs before a GPU can run: AC/DC power, thermal and liquid cooling, racks, modular systems, monitoring and lifecycle services, under brands including Liebert, NetSure, Geist, E&I, Powerbar and Avocent. It reports geographically only. The Americas is the engine: $2,988.8M in the third quarter (total less APAC and EMEA, as derived from the filed figures), +75% reported, at a 29.4% adjusted operating margin. APAC contributed $779M (+50%) at a 17% margin; EMEA $545M (+23%). Headquarters: Westerville / Columbus, Ohio; 34,000 employees; CEO Giordano Albertazzi, Executive Chairman David Cote.
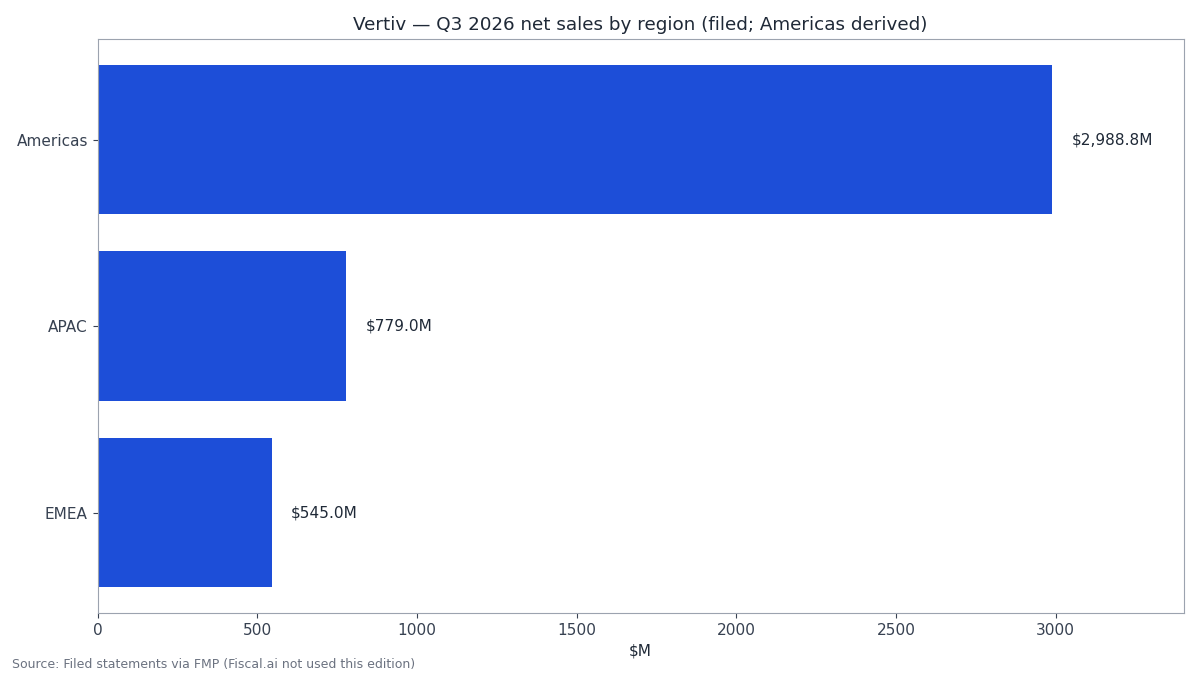
Q3 2026 net sales by region (Americas derived from filed totals). Source: Filed statements via FMP (Fiscal.ai not used this edition).
The long view
One quarter is weather; five years are climate. Four lenses, the same ones every time, on the filed record.
Revenue growth. Growth is the first quality test — a premium valuation is only defensible while compounding continues. Revenue compounded at 18.5% a year over five years (FY2020 $4,370.6M → FY2025 $10,229.9M); the three-year pace is 21.6%, so the check says accelerating, and FY2026 is guided to $14.7B. This quarter: +61.2% YoY. Judgment: growth is not maturing — it is stepping up, which is precisely why valuation, not trajectory, is the debate.
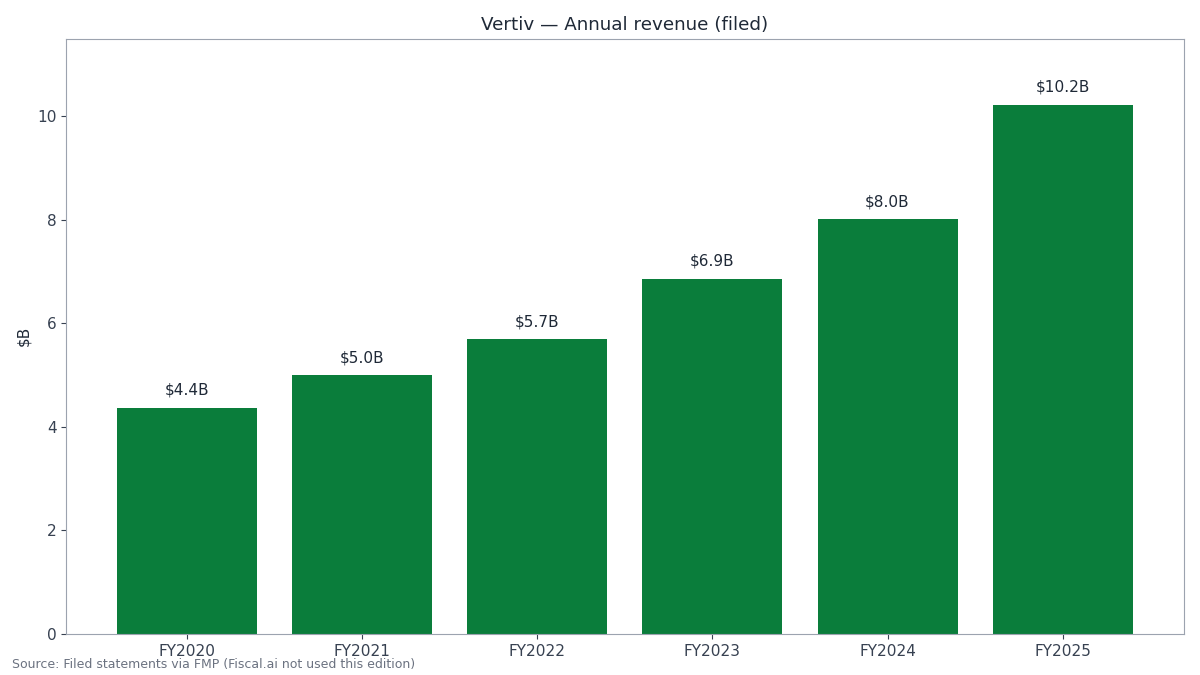
Annual revenue, FY2020–FY2025, filed figures. Source: Filed statements via FMP (Fiscal.ai not used this edition).
Operating margin. Margin tells you whether growth is being earned or bought. The five-year average operating margin is only ~11.7% — but the average conceals the story: 5.2% in FY2021, a 4.0% trough in FY2022, then 13.4%, 17.2% and 18.5%. This quarter: 22.8% GAAP, 25.2% adjusted. Judgment: the margin structure has been rebuilt — whether ~24% adjusted is a plateau the cycle defends or a peak it revisits is the open question; the 2022 trough is the reminder that leverage runs both ways.
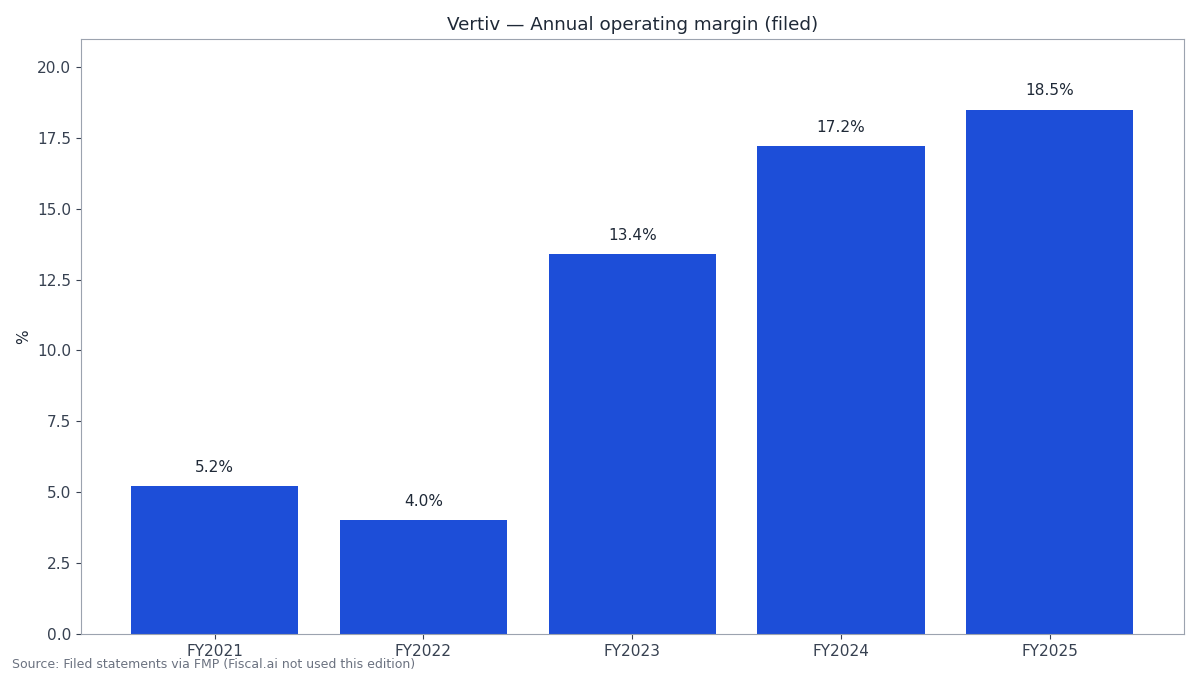
Annual operating margin, FY2021–FY2025, filed figures. Source: Filed statements via FMP (Fiscal.ai not used this edition).
Cash. Cash is where industrial growth stories usually break. Free cash flow swung from $126.3M (FY2021) to negative $263.8M in FY2022, then $765.9M, $1,135.2M and $1,887.4M in FY2025 — an 18.4% free-cash-flow margin — with five-year operating cash flow at 176.7% of net income. This quarter converted 85.7%. Judgment: cash conversion has matured with scale — but the FY2022 negative print, in a year revenue still grew, is the standing warning.
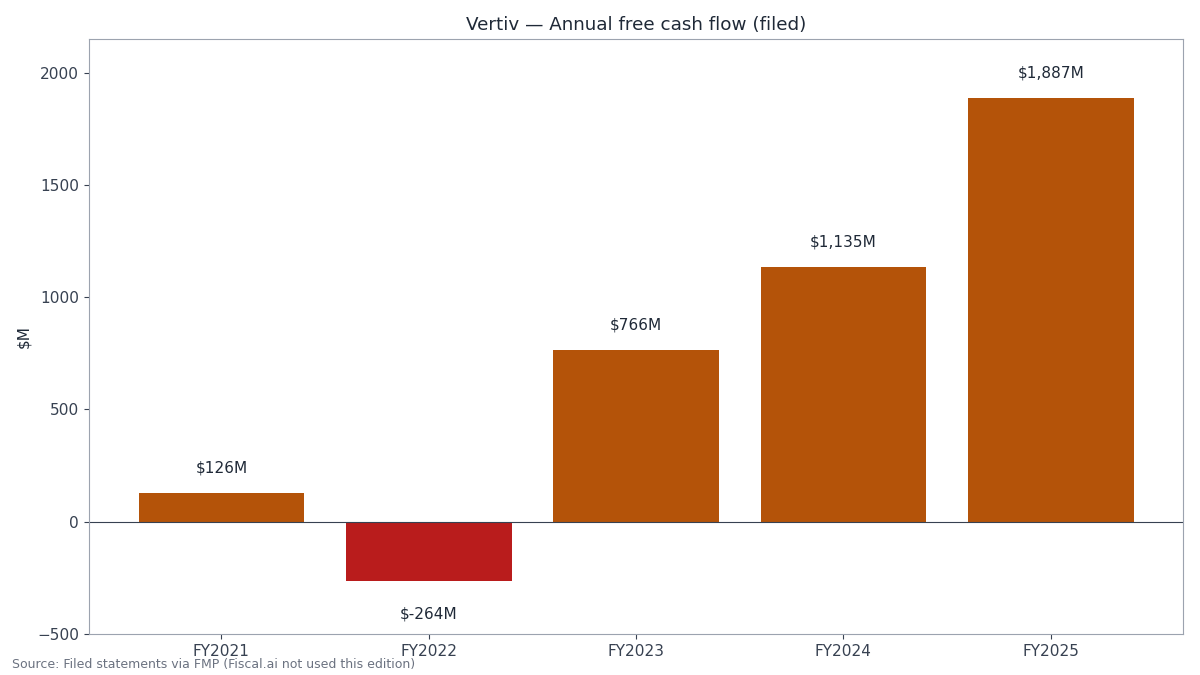
Annual free cash flow, FY2021–FY2025, filed figures. Source: Filed statements via FMP (Fiscal.ai not used this edition).
Return on invested capital. ROIC asks what the installed base earns on everything invested in it. The five-year average ROIC is 10.5%, with return on capital employed at 14.6% — respectable, not elite, held down by the trough years. At a 25.2% adjusted margin on a revenue base that has more than doubled in five years, incremental returns on new capacity run far above that historical mean. Judgment: returns are inflecting up from a mediocre base — the history and the trajectory genuinely disagree, and the next two prints arbitrate between them.
Beyond the print — the business this quarter
The earnings release is the scoreboard. The quarter's business story is capacity, cooling mix and a step up the value chain.
Capacity is being added on three continents at once (quarter, per the call). New Americas facilities for infrastructure, power, thermal and rack systems; the Slovakia campus expanding and power facilities scaling in Ireland; the new Johor, Malaysia factory now operational in APAC; chiller capacity on track to double by year-end. Capacity added ahead of demand is what let doubled orders become revenue rather than backlog slippage.
Liquid cooling is taking a bigger share of heat removal (quarter, per the call). Management said liquid cooling is taking a much bigger share of first-level heat extraction, the market mix is moving toward liquid, and it is satisfied with Vertiv's competitive standing and leadership in the category — while being explicit that air cooling is not going away. Mix matters: liquid systems carry the integrated power and services content where the margin advantage lives.
Two acquisitions closed, one of them strategic (quarter, per the call). Vertiv closed Utility Innovation Group (microgrid solutions, advanced power controls, behind-the-meter power design) and King Environmental Services (fluid management and load testing in Europe). In Q&A, Utility Innovation Group was framed as a move up the value chain — an earlier seat at the architecture conversation, and the prospect of adding a segment to the powertrain. Small deals; the direction, from components toward system architecture, is the signal.
The second-quarter problems were answered with volume (quarter, per the call). Asked directly about compressor failures and UPS heat issues, management pointed to execution: roughly $100–150M of delayed second-quarter revenue was recovered in the third quarter, factory resiliency work continues, and doubled orders — balanced with or without neocloud customers — were offered as the customers' own assessment.
What management said — Q3 2026 call (October 28, 2026)
David Cote, Executive Chairman: "Well, to paraphrase Mark Twain, the rumors of our demise have been greatly exaggerated." The opening line targeted the quality-and-supply-chain narrative built against the stock during the quarter. Management contested it head-on — then supplied the orders figure to back the rhetoric.
Giordano Albertazzi, CEO: "But it is worth sharing that our Q3 orders were more than 100% up year on year. Organically." Vertiv's policy is not to disclose orders, and the chairman repeated in the same call that orders data will not be shared going forward. A one-off disclosure of a doubled order book is a deliberate signal — the strongest demand evidence available, offered once, with no series to follow it.
Giordano Albertazzi, CEO (closing): "Proud and pleased, but certainly never satisfied." The closing frames the raised guide as a floor rather than a victory lap — consistent with the fourth quarter guided roughly flat sequentially after the pull-forward, leaving 2027 as the next proof point.
Also from the call: guidance was raised on every metric (FY26 sales $14.7B, adjusted EPS $7.15, adjusted operating profit above $3.5B, adjusted operating margin ~24%, adjusted free cash flow $2.7B); the fourth-quarter midpoint guide is sales of ~$4.4B (+53% YoY), adjusted EPS of $2.25 and an adjusted operating margin of 25.8%; capital return in the quarter was a $24M dividend, with the balance sheet in net cash.
The Key Issue — can Vertiv convert doubled orders into durable ~24% margins and the raised guide when book-to-bill is undisclosed?
Thesis: Vertiv has proven demand (orders +100%+), proven operating leverage (an adjusted margin of 25.2%) and a raised guide assuming both persist (FY26 margin ~24%). What it has not provided — by deliberate policy — is the series that would let investors verify conversion as it happens: orders and book-to-bill. The case rests on trusting execution through a blind spot, at a valuation that leaves little room for that trust to be misplaced.
Evidence for — "conversion is real"
The third quarter is the demonstration: capacity on three continents converted a doubled order book into +61% revenue at expanding margins, free cash flow converting 85.7% of net income, and a net-cash balance sheet. The guide rose by $650M of sales with margin raised alongside, not traded against it. Regional breadth (Americas +75%, APAC +50%, EMEA +23%) and a doubling EMEA pipeline argue against a single-programme air pocket; the five-year margin rebuild (4.0% → 18.5%) shows operating leverage delivered before.
Evidence against — "the blind spot is the risk"
With book-to-bill undisclosed, order normalisation would give no early warning — the first evidence would be a revenue miss against a guide built on conversion. Part of the third quarter was pull-forward ($100–150M of delayed second-quarter revenue), hence the fourth quarter guided roughly flat sequentially. The long record is thinner than the quarter: five-year ROIC of 10.5% and a negative-free-cash-flow FY2022. And the price assumes success: 45.6× trailing earnings and a 3.24% free-cash-flow yield require conversion to be durable, not demonstrated once.
What to watch
(1) Fourth-quarter delivery — sales of ~$4.4B at a 25.8% adjusted margin midpoint would confirm conversion through the pull-forward quarter. (2) The FY27 framework: any orders or backlog colour re-opens the verification channel. (3) External datapoint: the wider grid and electrical chain printed strong in the same window — Quanta Services reported on October 29 and demand signals across the AI power, cooling and electrical build-out are strengthening — corroborating end-demand independently of Vertiv's disclosure choices; hyperscaler capital-spending guides are the other external check. (4) Historical analogy (the company's own precedent, labelled as such): Vertiv's FY2022 — margin troughing at 4.0% while revenue still grew and cash flow went negative, then rebuilding to 18.5% by FY2025 — proves this income statement's leverage cuts both ways. (5) Liquid-cooling mix and any repeat of the quality chatter that opened the quarter. The forward question: when the fourth quarter prints, does Vertiv deliver the raised guide at ~24%+ margins and frame FY27 with enough demand evidence to replace the orders series it withholds — or does the blind spot become the story?
Sources: Vertiv's filed Q3 2026 financial statements via FMP (scoreboard, income statement, margins, cash flow and balance sheet, reaction and consensus estimates); the Q3 2026 earnings-call transcript (October 28, 2026) for all quotations and call items, each labelled in the text; FMP consensus estimates for FY2026–FY2027 revenue and EPS growth (consensus price target unavailable and therefore omitted).
Disclosure: This post is general information and analysis, not financial advice and not a recommendation to any person. The author may hold positions in companies discussed.