Waste Management: A Small Miss, a Big Drop — Q3 2026
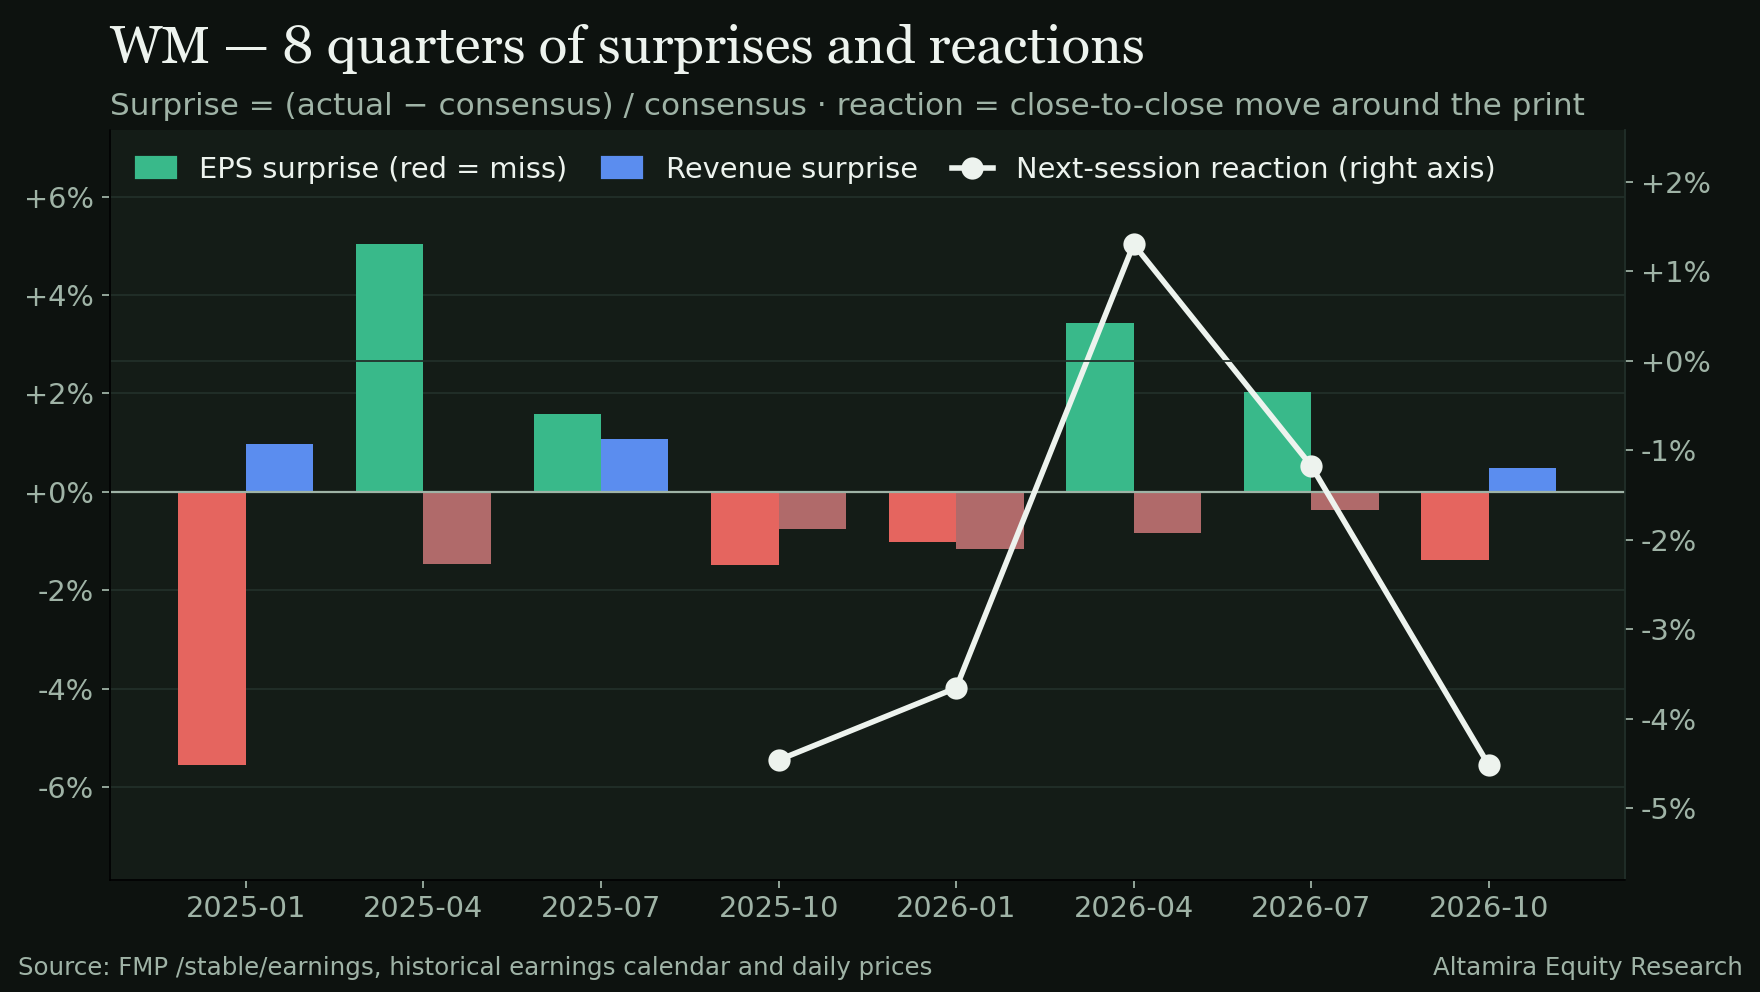
The quarter in one line: Waste Management beat on revenue ($6,846M vs $6,813M, +0.5%) and grew operating income to $1,279M, but adjusted EPS of $2.15 missed the $2.18 estimate by 1.4%

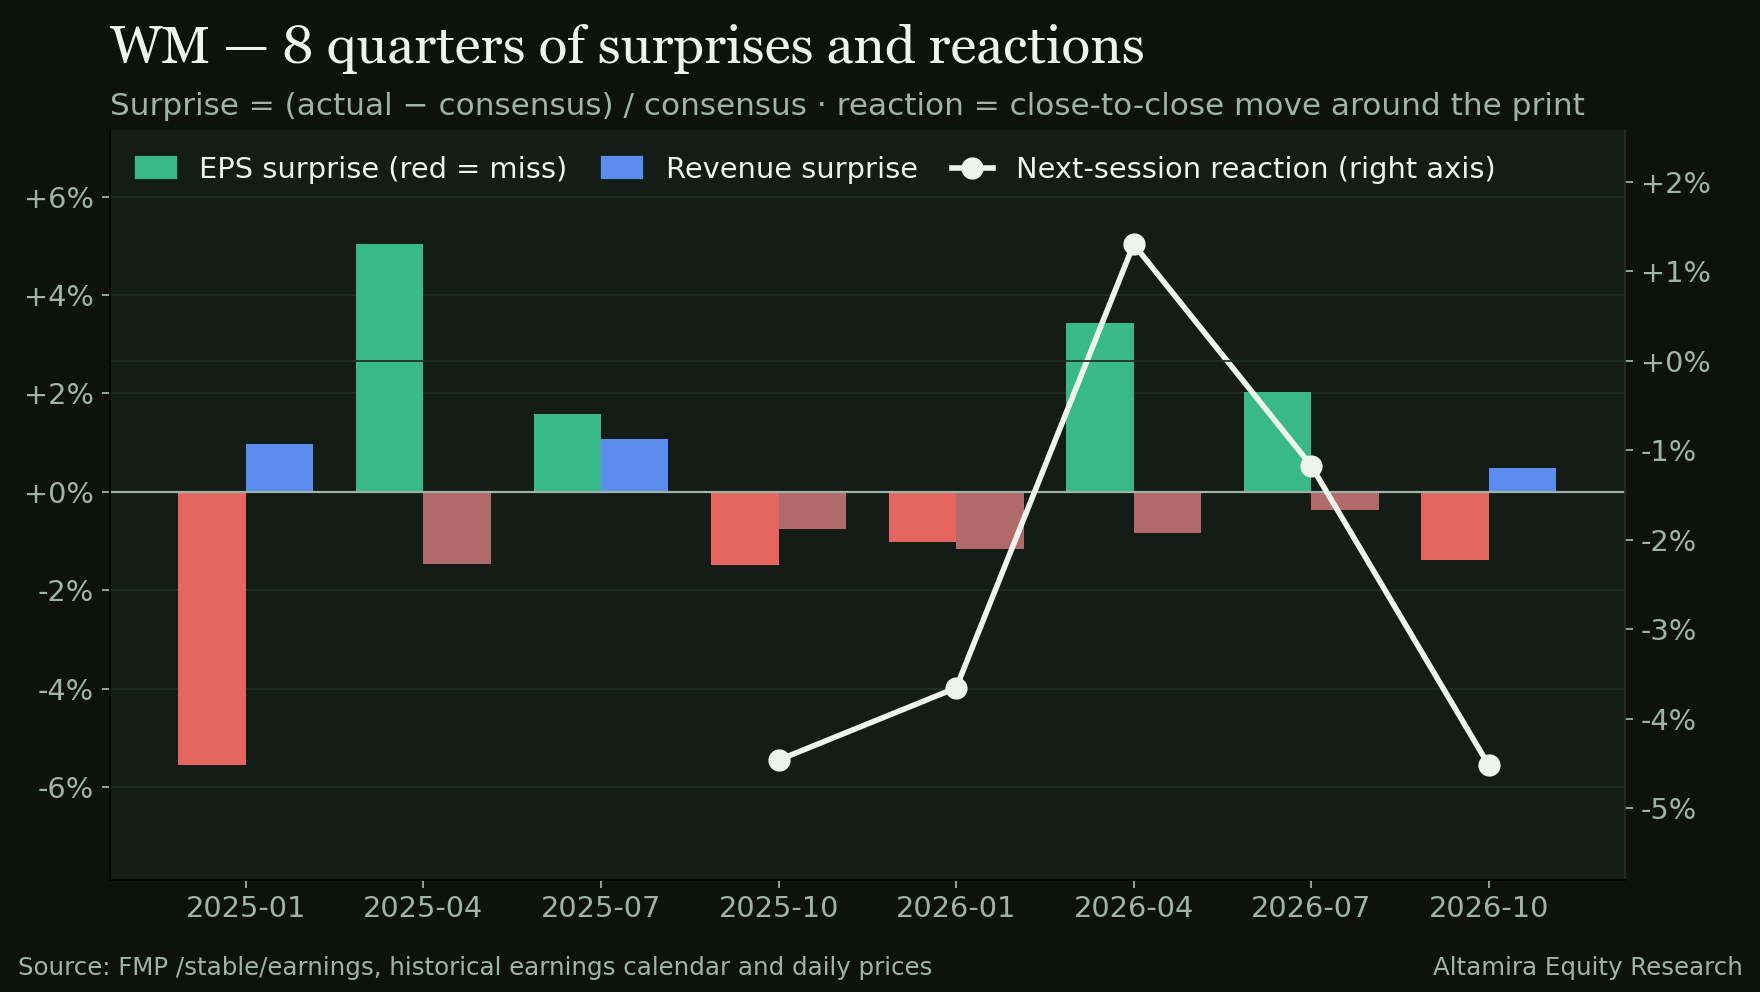
The quarter in one line: Waste Management beat on revenue ($6,846M vs $6,813M, +0.5%) and grew operating income to $1,279M, but adjusted EPS of $2.15 missed the $2.18 estimate by 1.4% — and the stock fell 6.1% after hours, roughly twice its historical average move, with the earnings-call transcript still not posted on FMP to explain the miss or update guidance.
At a glance — Q3 2026 scoreboard
Revenue $6,846M vs $6,813M est · +0.49% surprise · +6.3% YoY · +2.4% QoQ
EPS (adjusted) $2.15 vs $2.18 est · −1.38% surprise · GAAP diluted EPS $2.05
Guidance NOT STATED Call transcript pending on FMP at build time — no guidance class available
Reaction −6.1% AH To $226.36 from $241.02 close · 8Q avg abs move ±3.2%
| Metric | Actual | Estimate | Surprise |
|---|---|---|---|
| Revenue | $6,846.0M | $6,812.9M | +0.49% |
| EPS (adjusted, FMP calendar basis) | $2.15 | $2.18 | −1.38% |
| Operating margin (filed extract) | 18.7% · −19 bp YoY · operating income $1,279M (+5.2% YoY vs Q3 ’25 $1,216M, FMP quarterly statements) | ||
| Net margin | 12.0% · +262 bp YoY · net income $820M | ||
| Cash generation | OCF $1,640M · capex $657M · FCF $983M · FCF conversion 119.9% of net income | ||
| Capital return | Buyback $580M + dividends $377M = $957M returned in Q3 · shares −0.85% QoQ | ||
| Balance sheet | Cash $247M · total debt $23,370M · net debt $23,123M · interest expense $237M in Q3 | ||
| Estimate range | EPS estimates $2.14–$2.23 (17 analysts) · FMP price-target consensus null — omitted | ||
Presentation flag — read before using any “gross margin” for this quarter: the Recap flags “gross margin −1,051 bp YoY.” That is arithmetic on the FMP filing extract, in which Q3 cost of revenue is $5,567M with selling, general & administrative expenses and operating expenses both recorded as $0 — i.e. the extract bundles operating costs into cost of revenue, so “gross profit” equals operating income in this extract. In Q2 2026 the same source decomposed cleanly (cost $3,955M, SG&A $683M, D&A $793M). This edition therefore anchors on operating income and net income, which are consistent across quarters, and does not present the −1,051 bp figure as a verified economic margin collapse.
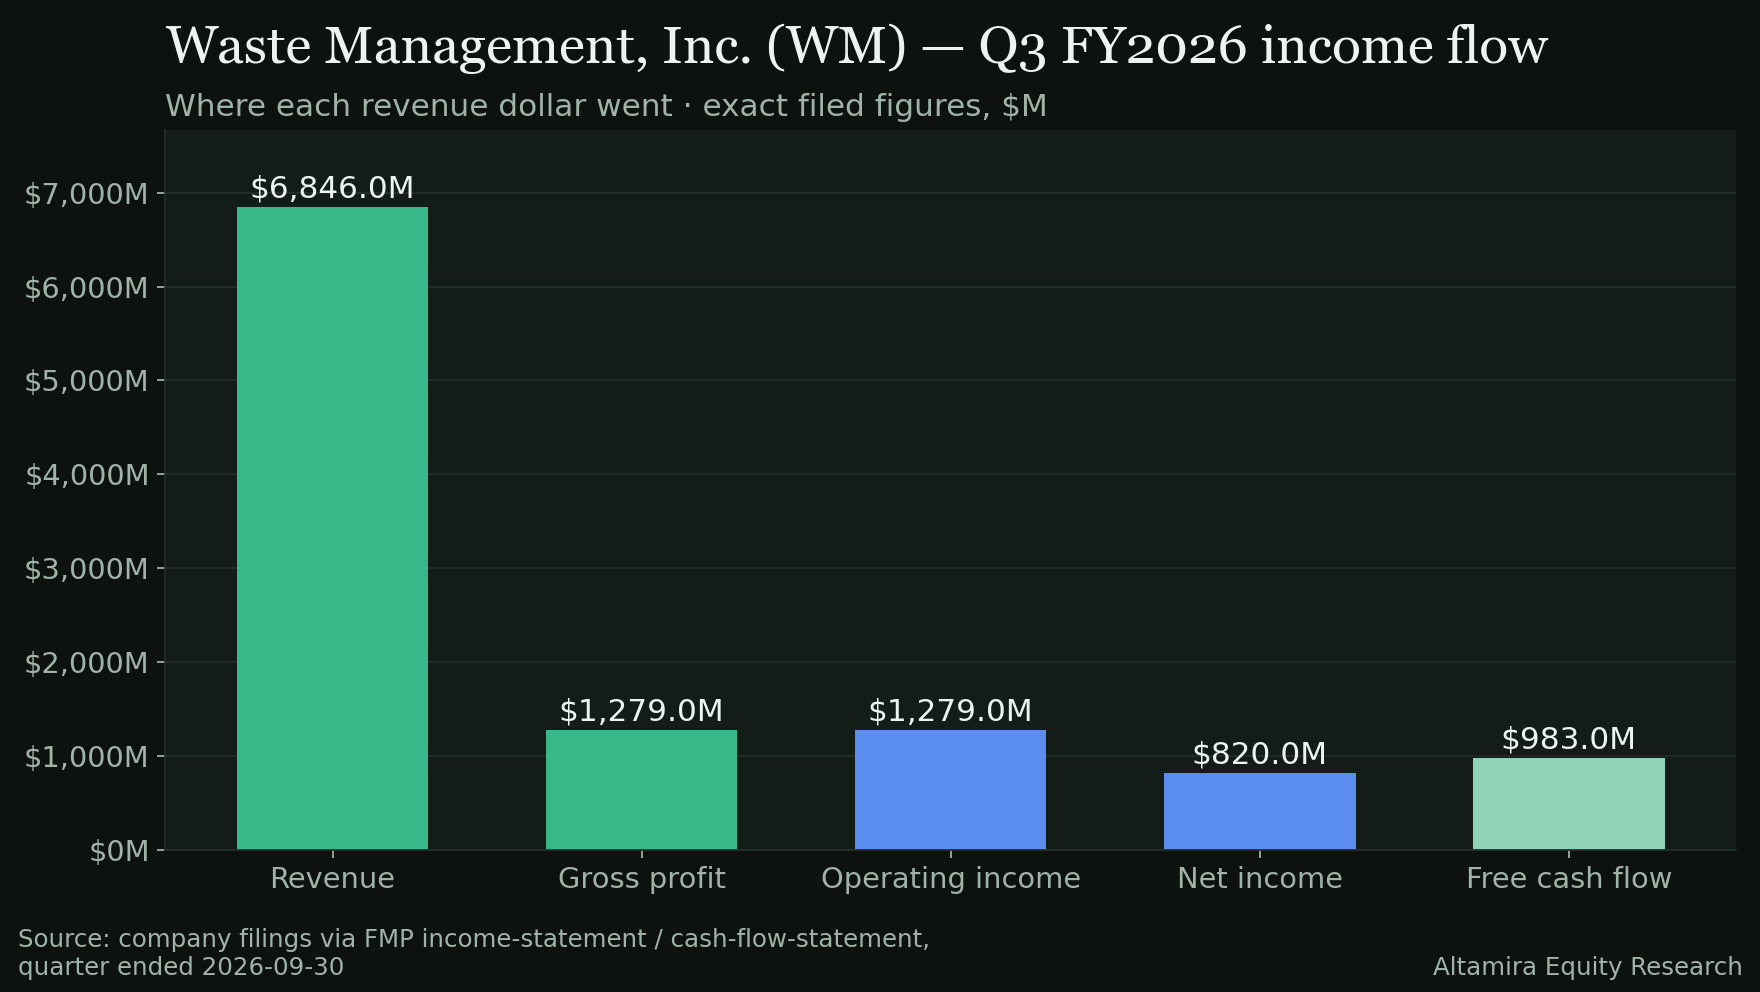
Q3 2026 Sankey — where the dollar went (as filed in the extract)
Revenue $6,846M · 100.0%
Cost + operating expenses (as filed in extract) $5,567M · 81.3%
Operating income $1,279M · 18.7%
Net other expense $235M · 3.4%
Income tax $224M · 3.3%
Net income $820M · 12.0%
Exact filed figures, FMP quarterly income statement, period ending Sep 30, 2026 (filed Oct 27, 2026). Pre-tax income was $1,044M (operating income $1,279M less $235M net other expense, which includes $237M of interest expense); tax $224M; net income $820M. Depreciation & amortisation of $792M is a non-cash charge inside the expense total. Because of the bundling flag above, the first step combines cost of revenue and operating expenses — no finer split is asserted for Q3.
How Waste Management makes money
WM is North America’s largest environmental-services provider (FMP company profile, pulled Oct 28, 2026): it collects and transports waste and recyclables from residential, commercial, industrial and municipal customers to transfer stations, material recovery facilities and landfills; it owns and operates landfills (including landfill gas-to-energy), transfer stations and recycling facilities, and adds recycling processing and brokerage, construction and remediation, and specialised disposal services. The model is route density plus scarce landfill capacity: recurring collection contracts, priced per service, disposed of in assets that are hard to permit and harder to replicate. Headquarters: Houston, Texas; 60,500 employees (FMP profile).
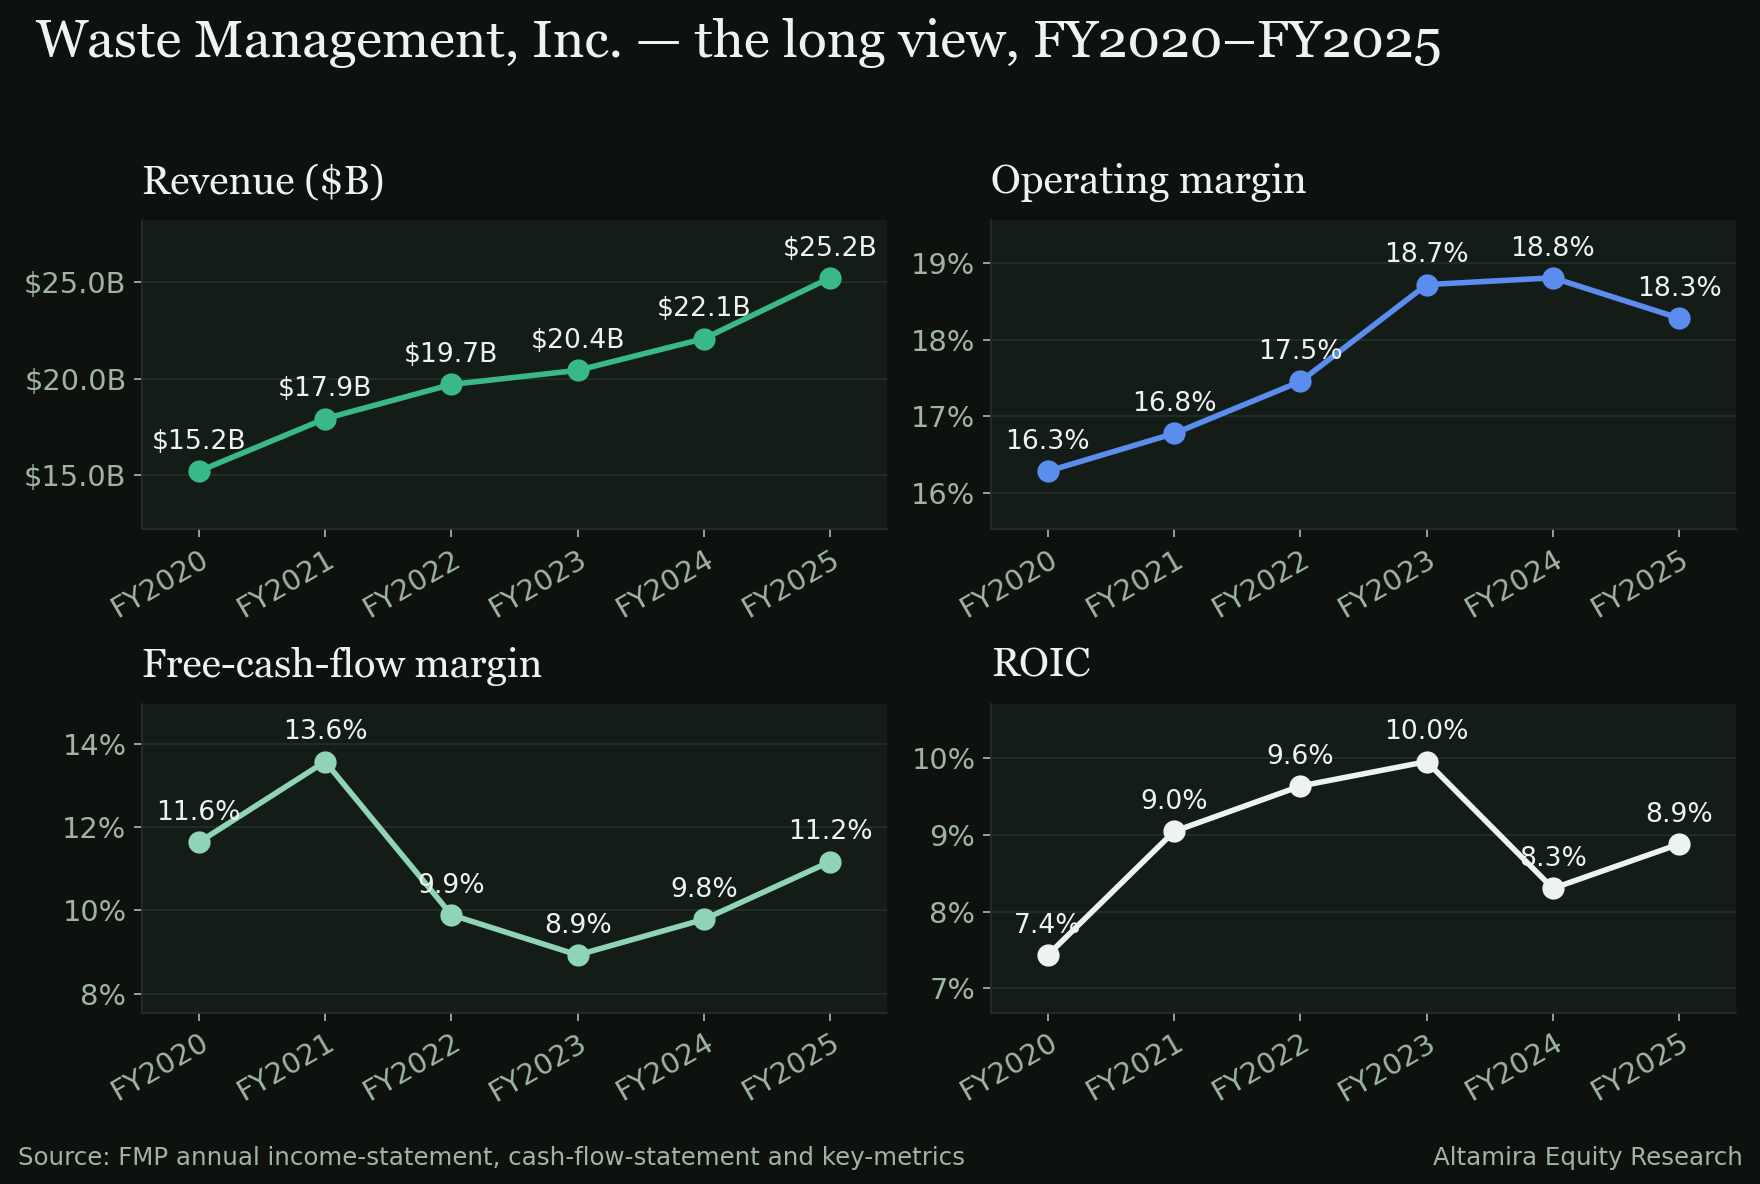
Source gap, labelled: no Fiscal.ai profile exists for WM and no live Fiscal.ai session was available in this run; FMP’s revenue product- and geographic-segmentation endpoints returned no data for WM. This section therefore gives no segment dollar split — inventing one would violate the tracing rule. Filed annual revenue (FMP annual income statements) shows the scale trajectory, including the FY2025 step-up:
FY2023$20,426MFY2024$22,063MFY2025$25,204M
FY2023 $20,426M · FY2024 $22,063M · FY2025 $25,204M — FMP annual income statements (KPI Scorecard cache, filed).
The quarter in charts
Quarterly revenue — growth resumed after the winter dip
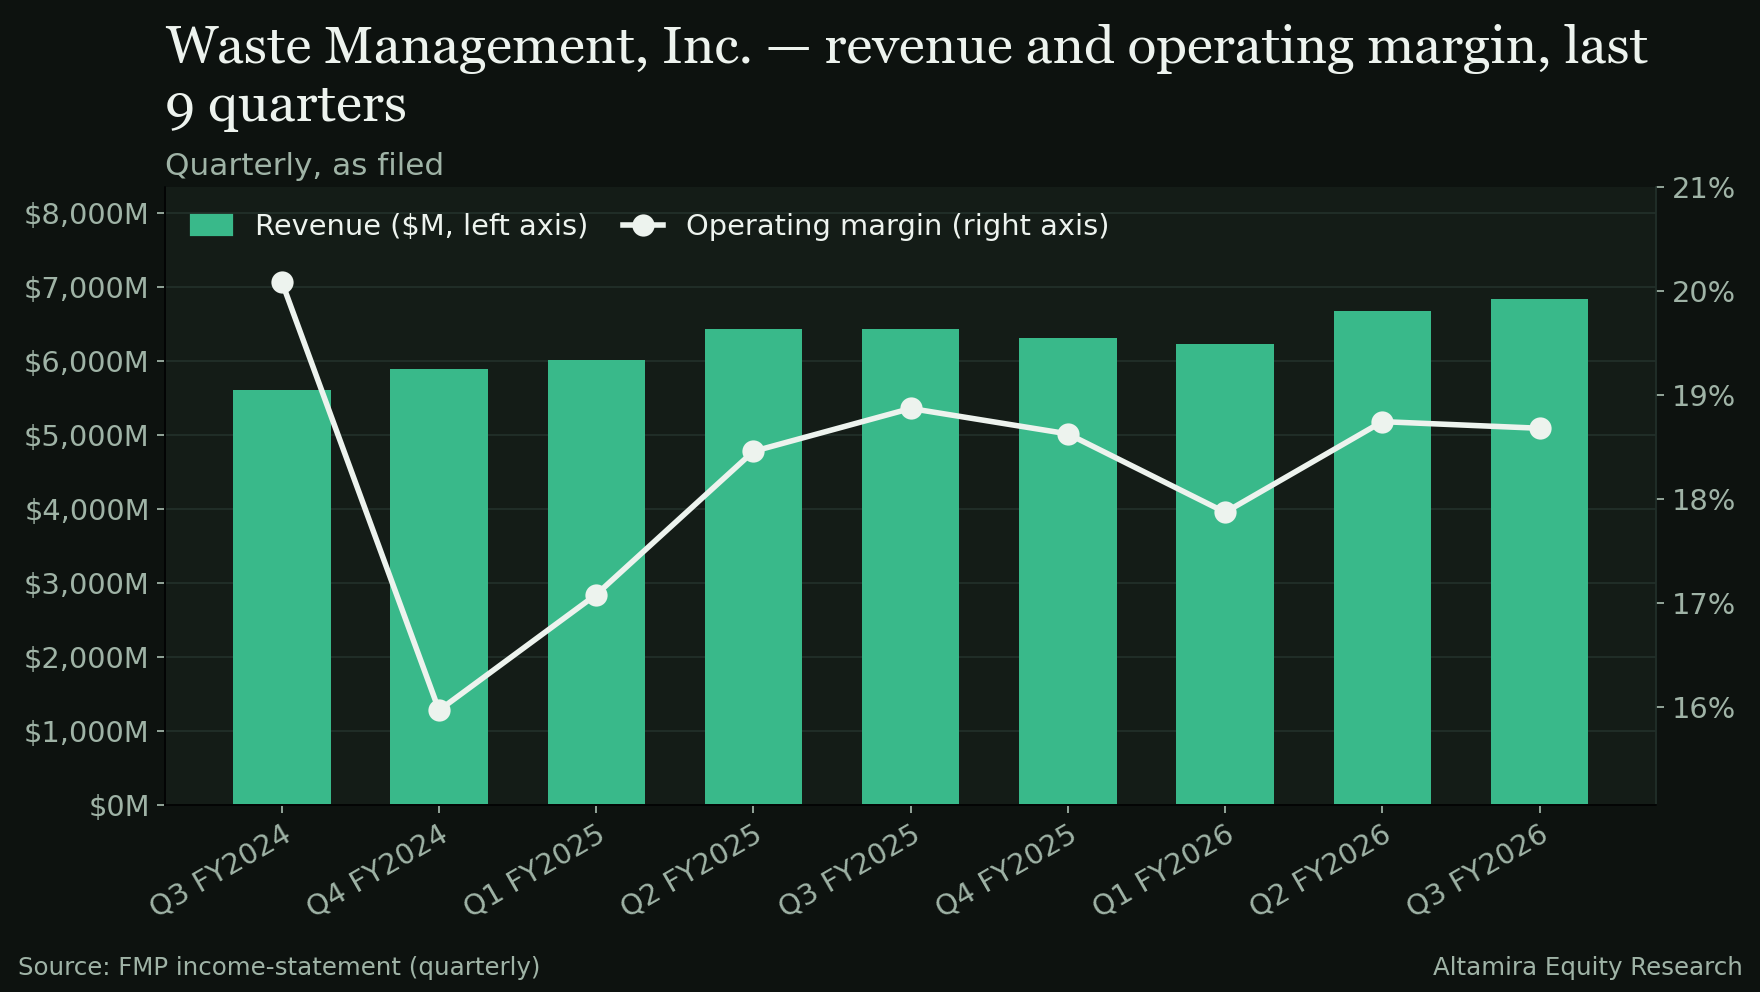
Q3 ’25$6,443MQ4 ’25$6,313MQ1 ’26$6,227MQ2 ’26$6,684MQ3 ’26$6,846M
Revenue of $6,846M is the highest of the five quarters shown and +6.3% YoY, after Q4 ’25 and Q1 ’26 dipped seasonally. The beat itself was small (+0.49%) — in line with WM’s 8-quarter history, in which revenue surprises have ranged only between −1.5% and +1.7%: this is a business that lands close to estimates on the top line.
Operating income — the reliable anchor
Q3 ’25$1,216MQ4 ’25$1,176MQ1 ’26$1,113MQ2 ’26$1,253MQ3 ’26$1,279M
Operating income rose to $1,279M, +5.2% YoY and +2.1% QoQ, and net income rose to $820M from $603M a year ago (GAAP diluted EPS $2.05 vs $1.49). Whatever the extract’s cost bundling hides, the operating line itself did not collapse — which is precisely why the size of the after-hours drop needs the call transcript to judge.
What management said — not yet available
- Transcript pending. FMP had not posted the Q3 2026 earnings-call transcript at build time (Recap status: pending). All five Recap call bullets — guidance, margins, demand, capital return, analyst Q&A — are therefore recorded as “transcript not yet posted,” and guidance is classified NOT STATED.
- What the filing alone proves: revenue +6.3% YoY, operating income $1,279M, net income $820M, OCF $1,640M, FCF $983M, $580M of buybacks and $377M of dividends in the quarter.
- What it does not prove: why adjusted EPS missed by three cents, whether pricing, volume, recycling commodities or costs drove the quarter, and whether full-year guidance moved. Any edition that answered those questions today would be inventing them — they wait for the transcript.
The Key Issue
Thesis: Is a −6.1% drop the right price for a −1.4% EPS miss at a defensive, cash-generative utility-like business — or is the market pricing the balance sheet and the missing explanation, not the miss itself?
Evidence for “overreaction”
- Revenue beat, volume-line growth is intact: $6,846M (+6.3% YoY) is a five-quarter high, and operating income grew +5.2% YoY to $1,279M with net income up to $820M (GAAP diluted EPS $2.05 vs $1.49 a year ago).
- Cash quality is strong: FCF $983M at 119.9% conversion of net income, and $957M of it was returned in the quarter ($580M buybacks + $377M dividends) — the capital-return machine did not pause.
- The miss is three cents against an estimate range of $2.14–$2.23 (17 analysts); the actual $2.15 sits inside that range, near its low end — a miss of positioning, not a profit warning in the filing.
Evidence against — why the drop may be information
- Leverage is structural and large: total debt $23,370M against cash of $247M (net debt $23,123M), with $237M of interest expense in this quarter alone and $657M of capex. At a P/E TTM of 30.8× (Recap/FMP), a leveraged, low-growth name has little valuation cushion when it misses.
- There is still no management explanation: guidance is NOT STATED and the transcript is pending, so the market is trading without the one thing that normally contains a WM miss — an outlook reaffirmation.
- The cost picture cannot be verified from the extract: the bundled cost presentation (see flag) means neither the Recap’s −1,051 bp “gross margin” nor any defence of it can be checked until the detailed filing/call is available.
- The move itself: −6.1% is about 1.9× WM’s 8-quarter average absolute move (±3.2%) — the largest signal in the print, and it was set by sellers with the same incomplete information.
What to watch
The call transcript when FMP posts it (guidance language first, cost/pricing colour second); whether the detailed statements decompose Q3 costs in the normal format; Q4 seasonal revenue vs the $6,313M Q4 ’25 base; and debt paydown vs buyback pace — Q3 returned $957M while net debt stands at $23,123M.
In charts
The numbers behind this note, drawn from the same filed figures.
Research for information only — not investment advice; see Disclosures.