Palantir: Revenue Growth Accelerated for a Fourth Straight Quarter — the Stock Fell on the Print Anyway
Palantir's revenue grew 95.87% year over year last quarter, the fourth straight quarter in which that growth rate accelerated rather than decelerated, with operating margin at 46.89% and free cash flow converting 106.08% of net income. The stock fell 1.65% on the print anyway, and has traded lower s

EPS 0.44 vs 0.41 expected (+8.35%) · revenue $2,313.4M, +6.25% vs estimate and +95.87% YoY — a fourth straight quarter of accelerating growth · operating margin 46.89%, +1,360 bp YoY · free cash flow $1,196.6M, 106.08% of net income · stock −1.65% on the print and lower since
The story in 30 seconds
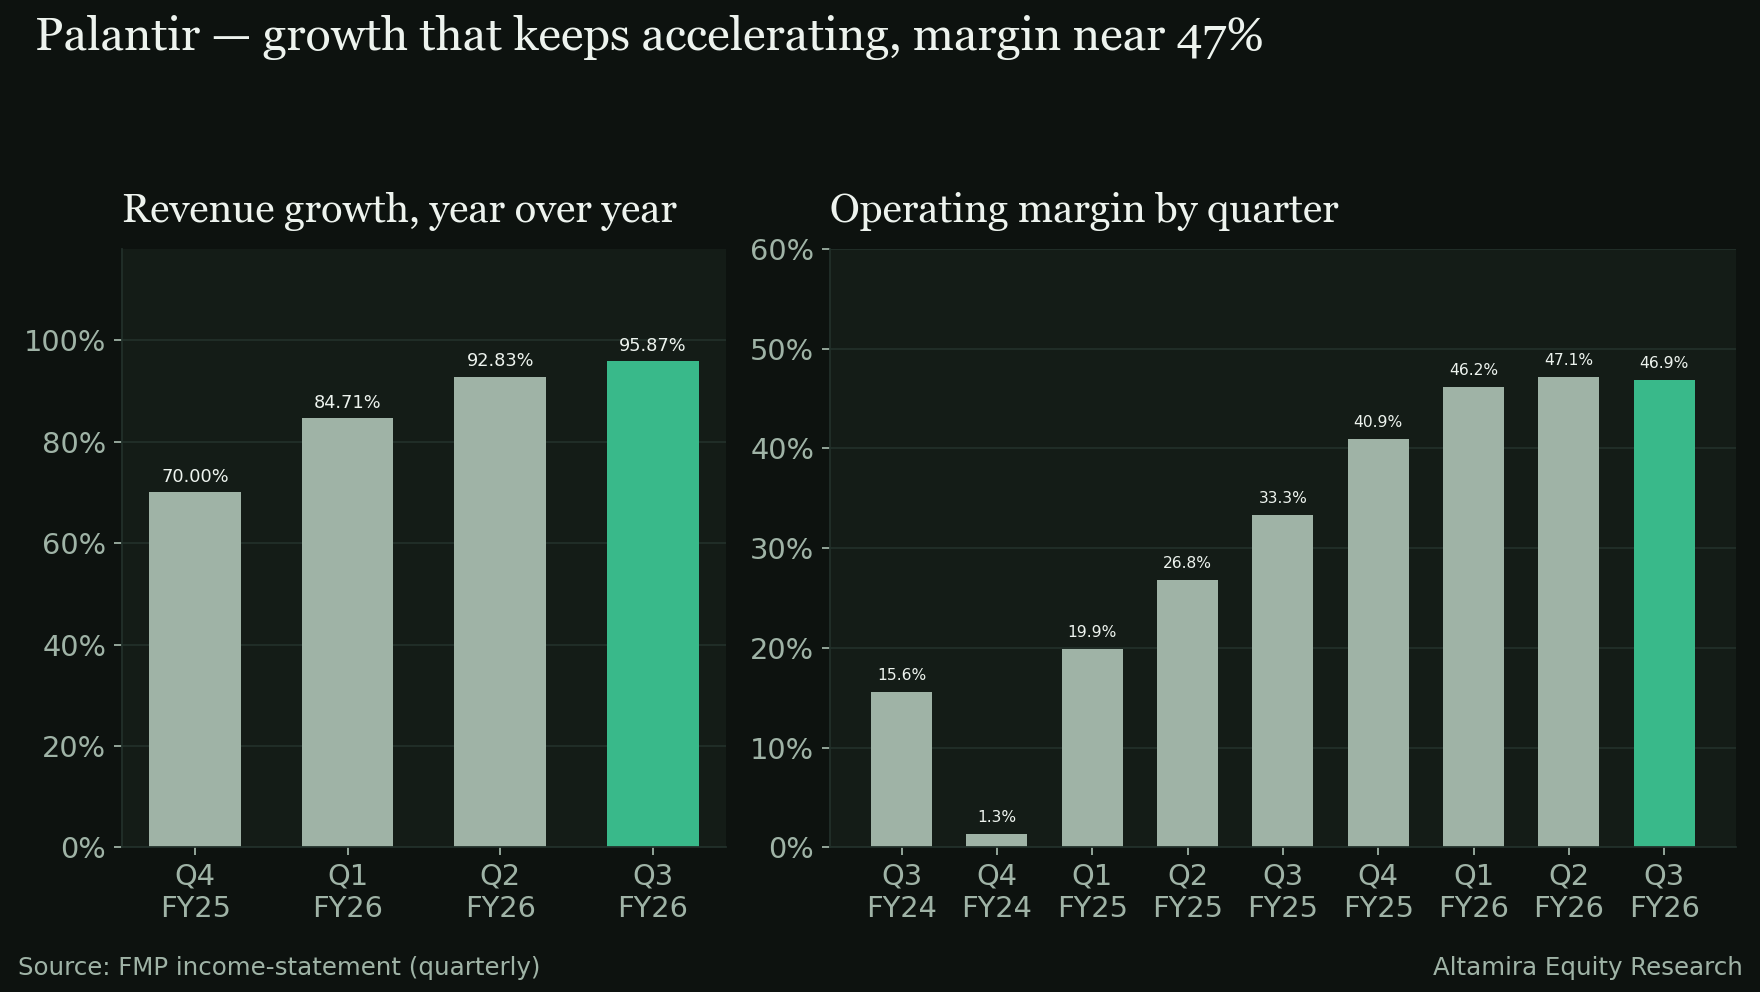
- Palantir Technologies (PLTR) reported its third fiscal quarter on November 2, 2026, clearing both bars: EPS of 0.44 beat the estimate by 8.35% and revenue of $2,313.4M beat by 6.25% and grew 95.87% year over year — grade A on our rubric, and the fourth consecutive quarter in which year-over-year revenue growth accelerated (70.00% → 84.71% → 92.83% → 95.87%).
- The quarter underneath the beat was clean: operating margin was 46.89%, up 1,360 basis points year over year, and free cash flow of $1,196.6M converted 106.08% of net income of $1,128.0M.
- The open question is the market's read on it: the stock fell 1.65% on the print — the opposite direction from a double beat — and has traded lower still since, down to 167.99 as of November 13, a decline of roughly 4.22% from the reaction close.
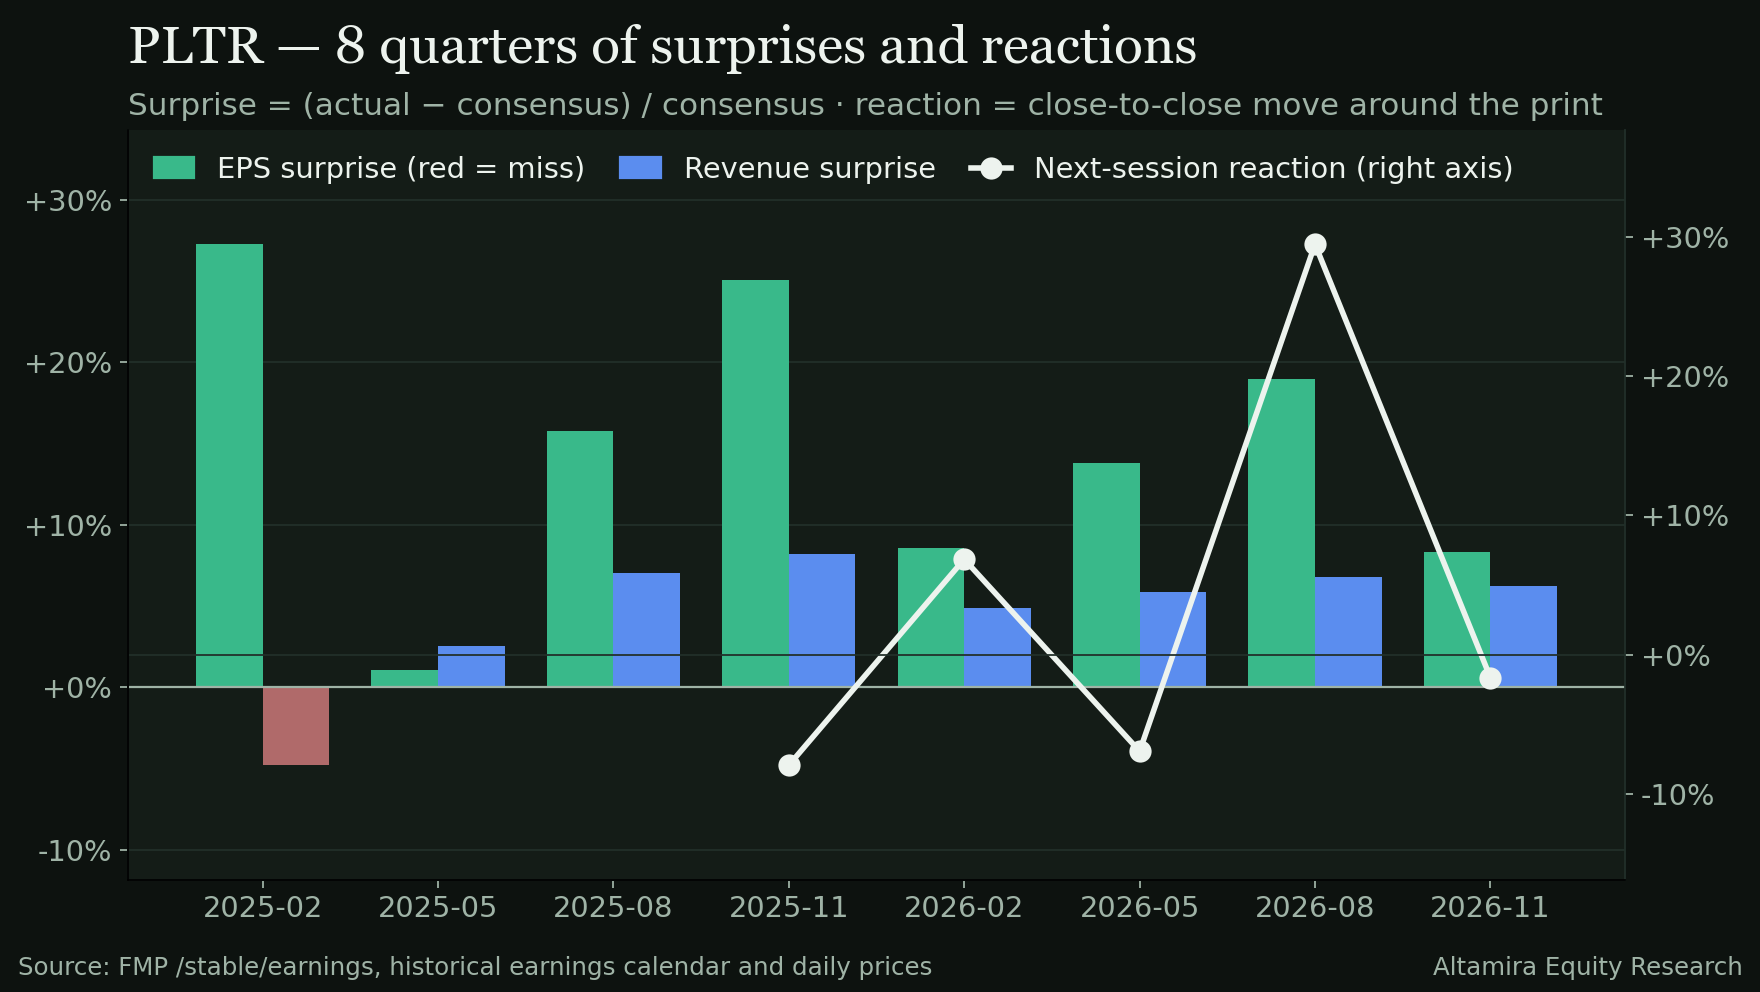
Palantir reported on November 2, 2026. Read quickly, this looks like exactly the print a growth stock wants: a double beat, a fourth straight quarter of accelerating revenue growth, and margin and cash-flow lines at or near multi-quarter highs. It didn't trade that way. The stock fell 1.65% the next session — about a sixth of its 10.56% average absolute move over the last eight prints, but in the wrong direction for a beat — and has fallen further in the two weeks since.
Palantir builds software platforms for government and commercial customers, including the Gotham system used across intelligence and defense operations. The third quarter extended a run that has been underway for roughly two years: operating margin has now improved in six of the last seven quarters, and this was the fourth straight quarter in which the year-over-year revenue growth rate itself got larger rather than smaller.
In this post: (1) the quarter against the four-quarter acceleration and the market's negative reaction; (2) where the revenue dollar went, in one chart; (3) what to make of the margin, cash and share-count lines; (4) the five-year record against this one quarter; (5) the honest counterweight and the Key Issue.
At a glance — Q3 FY2026
- Revenue: $2,313.4M vs $2,177.3M expected · +6.25% surprise · +95.87% YoY
- EPS: 0.44 vs 0.41 expected · +8.35% surprise
- Guidance: NOT STATED — the earnings-call transcript is not in the dataset; no guidance class is assigned and none is invented here
- Reaction: −1.65% close to close, from 178.34 (2026-11-02) to 175.40 (2026-11-03) · 0.2× the 8-quarter average absolute move of 10.56%
- Margins: gross 83.43% (+98 bp YoY, −123 bp QoQ) · operating 46.89% (+1,360 bp YoY, −23 bp QoQ) · net 48.76% (+849 bp YoY, −611 bp QoQ)
- Cash generation: operating cash flow $1,204.6M · capital expenditure −$8.0M · free cash flow $1,196.6M · 51.72% of revenue, +923 bp YoY · free cash flow to net income 106.08%
- Share count: diluted shares 2,573,926,000, +0.45% YoY and +0.16% QoQ · dividends $0.0M · buybacks $0.0M
- Balance sheet: cash & short-term investments $10.56B · total debt $225.3M · net debt −$3,394.1M · shareholders' equity $11.23B · inventory $0.0M
Since the print: the stock closed at 175.40 the session after the print (2026-11-03) and has traded down to 167.99 as of November 13 — a decline of roughly 4.22% that extended the post-print pullback, even though the shares are little changed over twelve months (−2.41%).
The quarter in one line: a fourth straight quarter of accelerating revenue growth, margin near a multi-quarter high and free cash flow outrunning net income all landed in a single print, and the stock fell anyway — on the day and in the two weeks since.
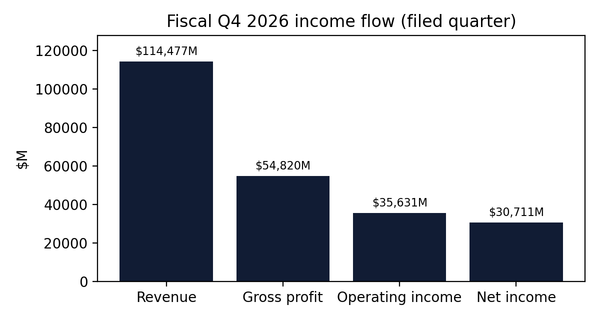
Q3 FY2026 flow — where the revenue dollar went
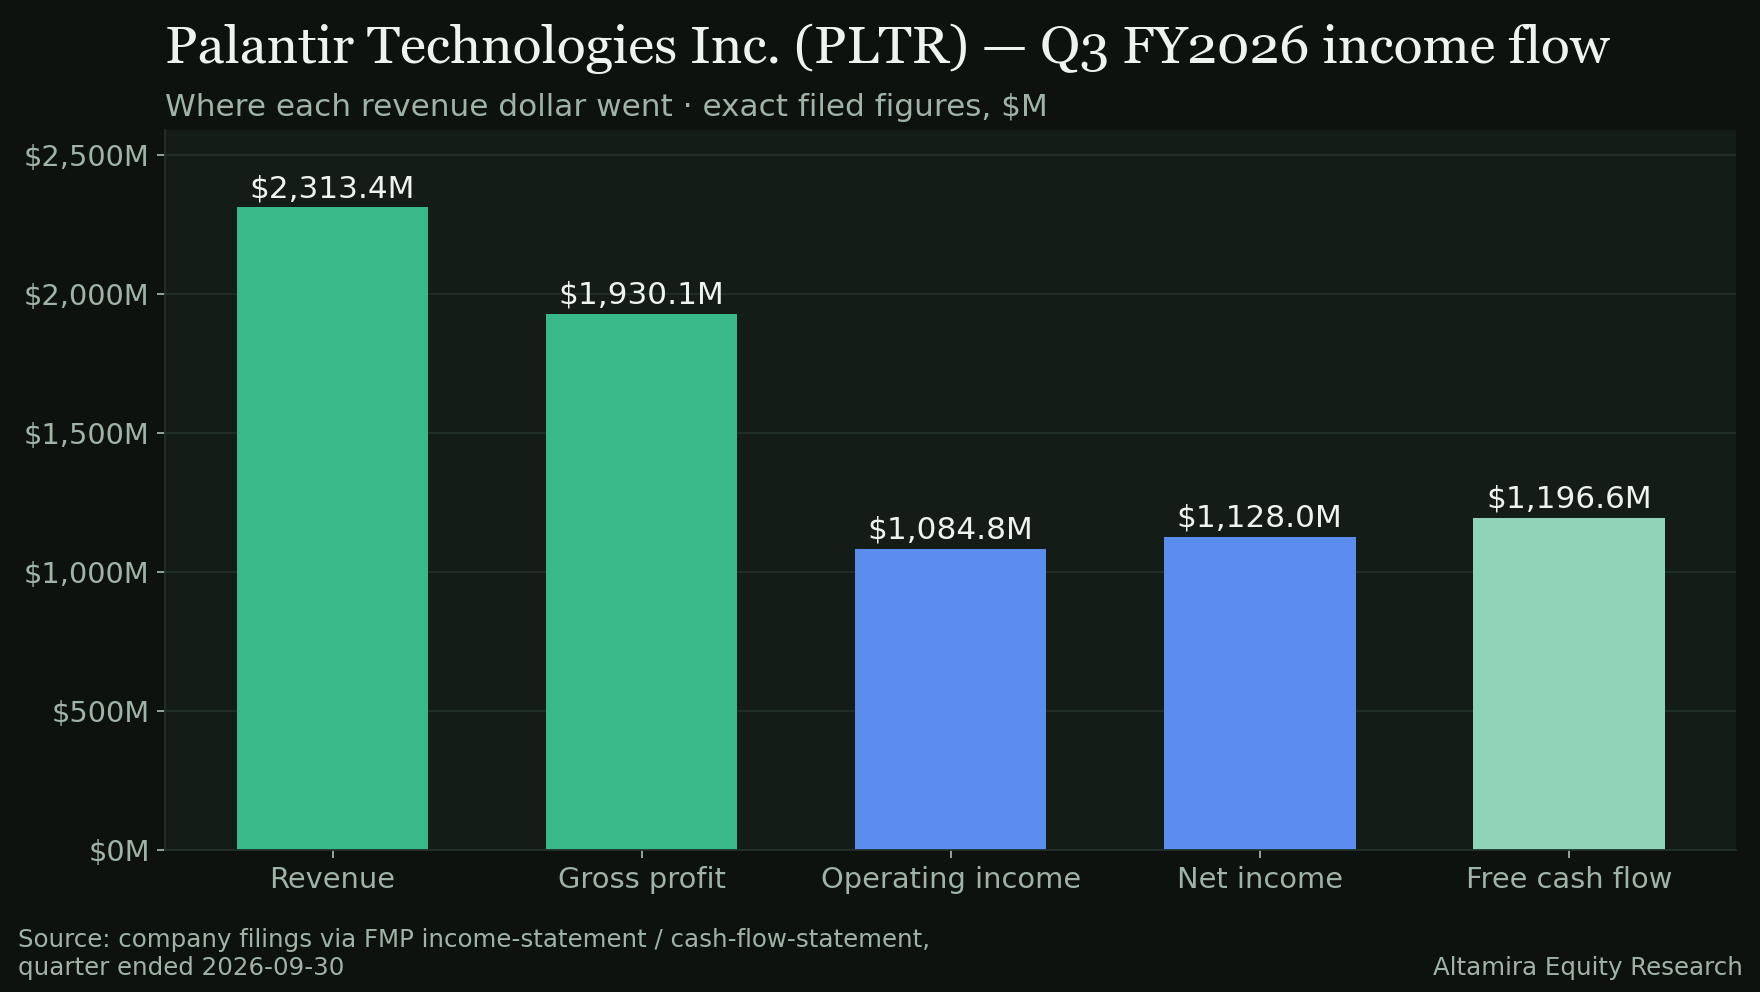
- Revenue: $2,313.4M (100.00%)
- Cost of revenue: $383.3M (16.57%)
- Gross profit: $1,930.1M (83.43%)
- Operating expenses: $845.3M (36.54%) — R&D $219.7M (9.50%), SG&A $625.6M (27.04%)
- Operating income: $1,084.8M (46.89%), +175.86% YoY
- Pre-tax income: $1,148.0M (49.62%)
- Income tax: $13.6M (0.59%)
- Net income: $1,128.0M (48.76%)
- Free cash flow: $1,196.6M (51.72%)
The swing item is on the other side of the usual story: operating expenses are already down to 36.54% of revenue (R&D 9.50%, SG&A 27.04%), so the 83.43% gross margin converts almost entirely into the 46.89% operating margin — there is little expense layer left to compress further.
What to make of this print
Six readings, each a finding plus what it means.
- Revenue growth accelerated for a fourth straight quarter. +95.87% year over year last quarter, up from +92.83% the quarter before, +84.71% the quarter before that and +70.00% in Q4 FY2025 — four consecutive quarters of acceleration rather than the deceleration that growth of this magnitude usually shows eventually.
- Operating margin held near a multi-quarter high. 46.89%, up 1,360 bp year over year and down just 23 bp sequentially from 47.12% — essentially flat across three straight quarters at 46.18%, 47.12% and 46.89%.
- Quality of earnings: free cash flow outran net income. Free cash flow of $1,196.6M was 106.08% of net income of $1,128.0M, on capital expenditure of just $8.0M against operating cash flow of $1,204.6M.
- The share count is essentially flat. Diluted shares of 2,573,926,000 rose just 0.45% year over year and 0.16% sequentially, with $0.0M of buybacks and $0.0M of dividends — dilution is not working against the per-share numbers here.
- The balance sheet is a net-cash position. Net debt of −$3,394.1M against $10.56B of cash and short-term investments and total debt of just $225.3M — financial risk is not a factor behind this quarter's margin.
- The market's reaction ran the other way. Despite the double beat (EPS +8.35% surprise, revenue +6.25% surprise) and every line above, the stock fell 1.65% on the print and has fallen further since — a 0.2× reaction relative to the stock's own 10.56% average absolute move on the last eight prints, in the opposite direction from a beat.
Takeaway: a quarter where growth accelerated, margin held at a multi-quarter high and cash conversion exceeded net income, and the market's reaction was negative and small rather than positive — the gap between the print and the tape is this recap's Key Issue, below.
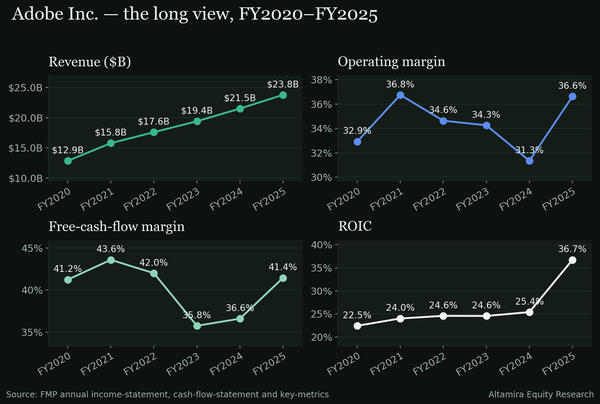
The long view — FY2020 to FY2025
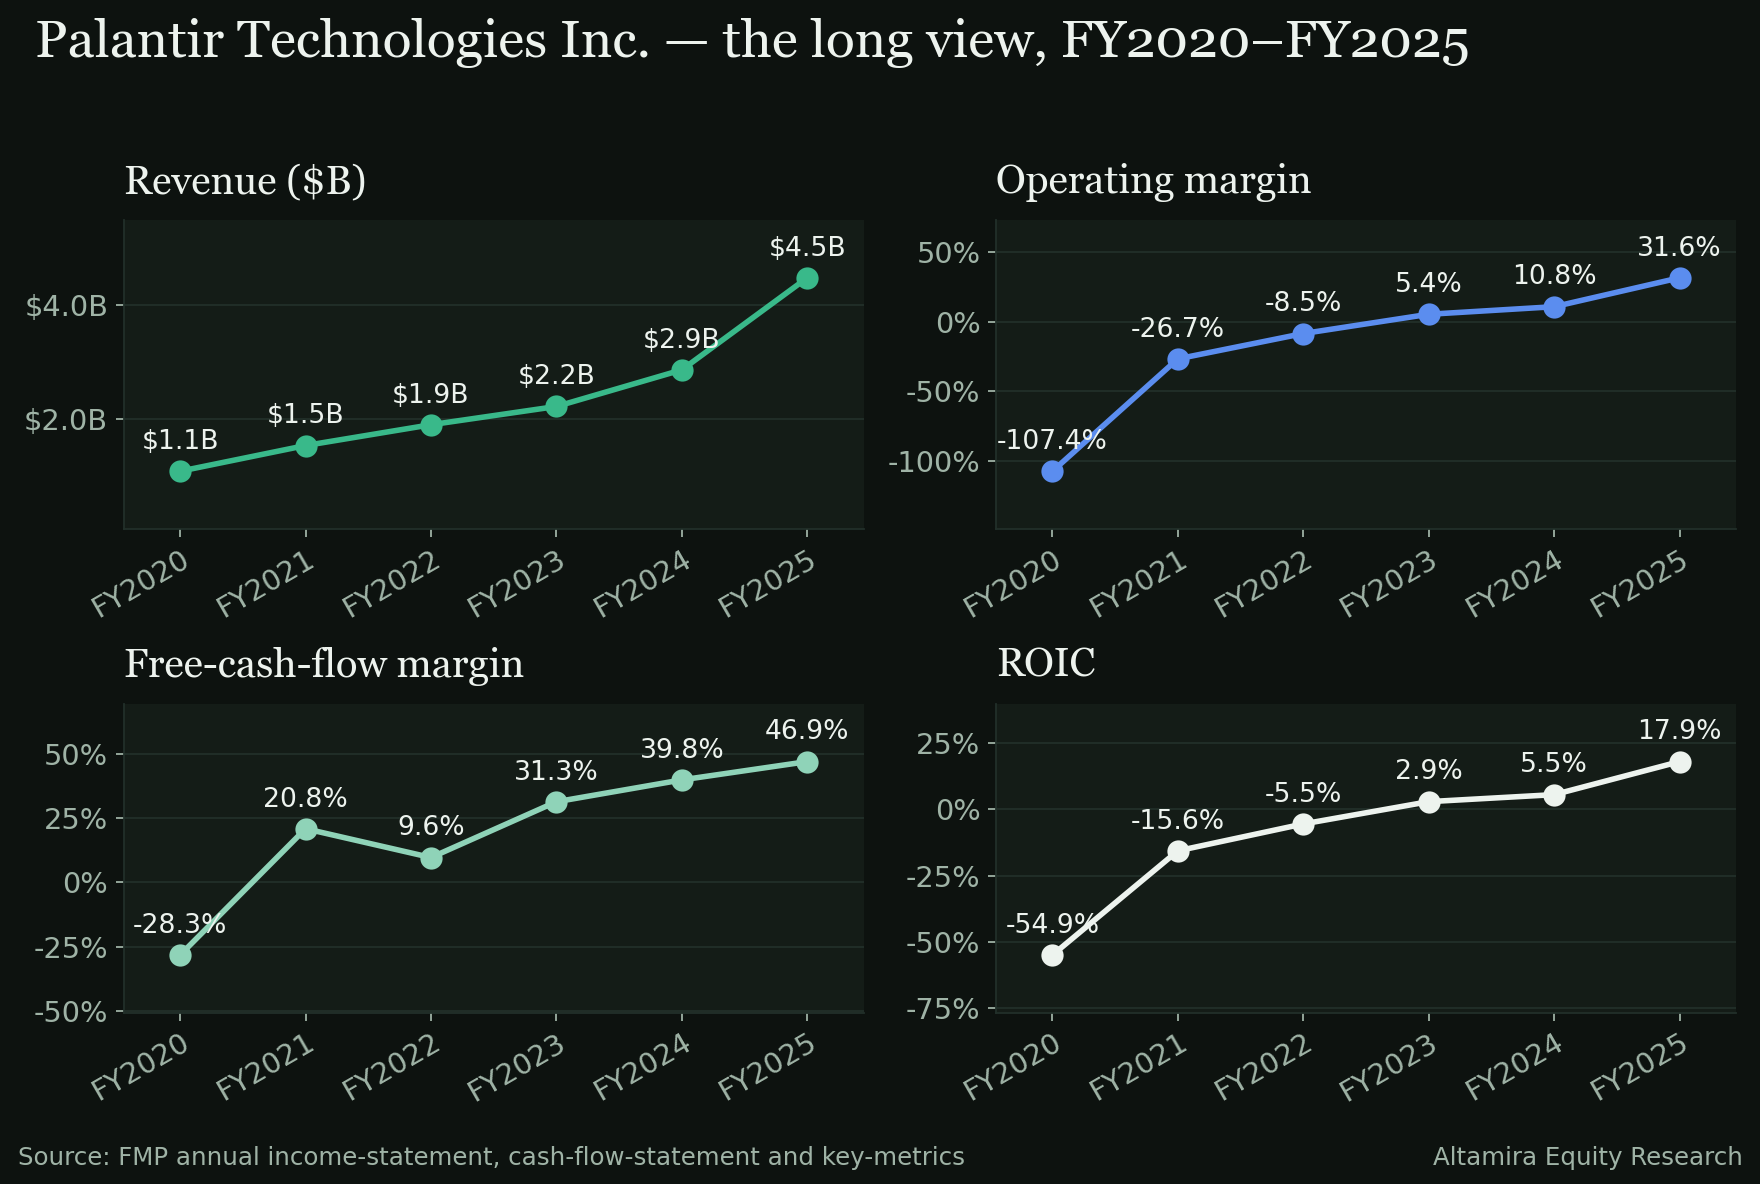
- Revenue growth. $1.09B in FY2020 to $4.48B in FY2025, a 32.58% compound rate.
- Operating margin. −107.41% (FY2020) to −26.66% (FY2021) to −8.46% (FY2022) to 5.39% (FY2023) to 10.83% (FY2024) to 31.59% (FY2025) — a +13,901 bp move over the period, with the business crossing from deeply unprofitable to a positive operating margin inside the five years shown.
- Cash. Free cash flow moved from −$0.31B in FY2020 to $2.10B in FY2025, a 46.94% FCF margin in FY2025 against −28.26% in FY2020.
- ROIC. −54.88% in FY2020 to 17.95% in FY2025, the steepest improvement of the four lenses — though diluted shares rose 161.93% over the same period, a far larger per-share base than at the start of it.
The honest counterweight
Three cells argue that a strong print does not settle the valuation question.
- The stock already trades above every published fair-value estimate. At the November 13 close of 167.99, Morningstar's fair value of 153.00 (dated February 5, 2026) implies a margin of safety of −9.80%; the in-house DCF (73.30) and the FMP DCF (15.40, as of November 14) sit far below that — a spread of nearly ten times between the lowest and highest published estimate.
- Morningstar rates the moat Narrow, not Wide, and both of the library's cards on this name are stale. The moat card (Narrow, as of June 17, 2026) is 151 days old and the capital-allocation card (Standard, as of February 5, 2026) is 283 days old — flagged stale rather than treated as current.
- Value is the weakest pillar in an otherwise strong scorecard. The November 14 KPI Scorecard edition has Palantir's growth pillar at 100.0 and health at 99.2, but value at just 14.8 — the composite of 54.8 is held down almost entirely by that one pillar, on a stock trading at 109.80x trailing earnings (TTM).
The Key Issue
Whether the market's negative reaction to a double beat, and the decline since, reflects a valuation that already prices in several more quarters of this acceleration — or whether a growth rate that has now accelerated for four straight quarters has further to run than the Street's fiscal-year estimates ($13.12B for FY2027 up to $31.72B for FY2029) assume. The February 1, 2027 print, against this quarter's 46.89% operating margin and 95.87% revenue growth, is where that gets tested directly.
Thesis verdict: Strengthened Grade A
Revenue growth accelerated for a fourth consecutive quarter, operating margin held near its high, and free cash flow converted more than 100% of net income — every operating line in the print moved in the same, favorable direction. The negative and since-extended market reaction is the counterweight that keeps this from being a simple "buy the beat" story, not a reason to call the operating thesis anything less than strengthened.
Sources
- FMP /stable/earnings (actuals vs consensus, eight quarters), /historical/earning_calendar/PLTR (report timing), /historical-price-full/PLTR (daily closes; moving averages, ranges and the close-to-close reaction computed from them) — pulled November 15, 2026.
- FMP /income-statement, /cash-flow-statement, /balance-sheet-statement (quarterly; the Q3 FY2026 statements filed November 3, 2026) and the annual statements plus /key-metrics for FY2020–FY2025 — pulled November 15, 2026.
- FMP /analyst-estimates and /key-metrics-ttm — pulled November 15, 2026.
- Morningstar analyst estimate dated February 5, 2026, read September 14, 2026, and research-library cards (moat, as of June 17, 2026; capital allocation, as of February 5, 2026, both flagged stale): Morningstar's view, not Altamira's.
- Altamira KPI Scorecard, edition 2026-11-14 (kpi-scorecard-2026-11-14.json): composite, pillar and technical scores, tier, state and fair-value cells as published.
- Guidance, segment detail and management commentary: NOT STATED — the earnings-call transcript is not in the dataset for this edition.
Research for information only — not investment advice; see Disclosures.
On the data pages
- PLTR company page — the filed figures, margins, cash flow and the print history, from SEC EDGAR.
- PLTR vs NVDA, head to head — the two on the same scorecard cells (top composite in Technology (kpi-scorecard-2026-11-14.json)).
- Verdict ledger — every public call, on the record.
- Earnings schedule — who reports next, and how every print this season graded.