CrowdStrike: The Five-Year Record Still Compounds — the Price Has Outrun Every Published Model
CrowdStrike has grown revenue at a 40.64% compound rate since FY2021 and free cash flow at 34.95%. The stock closed today 60.17% above the one published fair value that has followed it longest, and every model this scorecard tracks sits below the current price. This note reads the record and the tap
The story in 30 seconds
CrowdStrike has grown revenue at a 40.64% compound rate since FY2021 and free cash flow at 34.95%. The stock closed today 60.17% above the one published fair value that has followed it longest, and every model this scorecard tracks sits below the current price. This note reads the record and the tap


Revenue CAGR 40.64% (FY2021–FY2026) · operating margin +449 bp to −6.10%, still negative · FCF CAGR 34.95% · close 243.46, up 87.06% over 12 months, 60.17% above the Morningstar fair value of 152.00
The story in 30 seconds
- The five-year record shows one of the faster compounding stories in the KPI Scorecard universe: revenue grew from $0.87B in FY2021 to $4.81B in FY2026, a 40.64% compound rate, while free cash flow compounded at 34.95% and operating margin improved 449 basis points — though it is still negative, at −6.10% in the most recent fiscal year.
- The price says something sharper. The stock closed today at 243.46, up 2.71% on the day, 26.84% over three months and 87.06% over the past year. It now trades 38.71% above its 200-day average, even after sitting 1.27% below its 50-day average.
- The open question is whether the technical score of 81.0 — the strongest cell on an otherwise mixed scorecard — reflects a business that has earned its premium, or has simply outrun three independent fair-value models that all sit below the current price, the closest of them 60.17% below.
CrowdStrike's fundamental composite on the Altamira KPI Scorecard is 42.0, built from a growth pillar of 94.9 and a health pillar of 71.3 at the top of the range, but a quality pillar of just 17.6 and a value pillar of 3.8 near the bottom. The same edition scores the stock's technical state at 81.0, a blended total of 53.7, tier 4, grade C, state PULLBACK. A reader looking only at the growth numbers would call this one of the fastest-compounding names on the sheet; a reader looking only at valuation would call it one of the most expensive. Both readings use real numbers, and this note sets out what each one is actually measuring.
CrowdStrike sells cloud-native cybersecurity through its Falcon platform — endpoint protection, cloud workload security, identity protection and threat intelligence sold mostly by subscription — a business that has moved, over five fiscal years, from $0.87B of revenue to $4.81B while never yet posting a positive full-year operating margin in the series this pack carries. The margin and cash record below is what that subscription growth looks like in the filed statements; the valuation record is what the market is already paying for it, eleven trading sessions before the next print.
In this post: (1) how the business makes money today, from the latest filed quarter; (2) the five-year record across four lenses; (3) what the cash and share-count lines say about the quality of the earnings; (4) what the price already assumes against three published fair-value models; (5) the scorecard's own read, pillar by pillar; (6) the honest counterweight and the Key Issue ahead of the December 1 print.
How CrowdStrike makes money
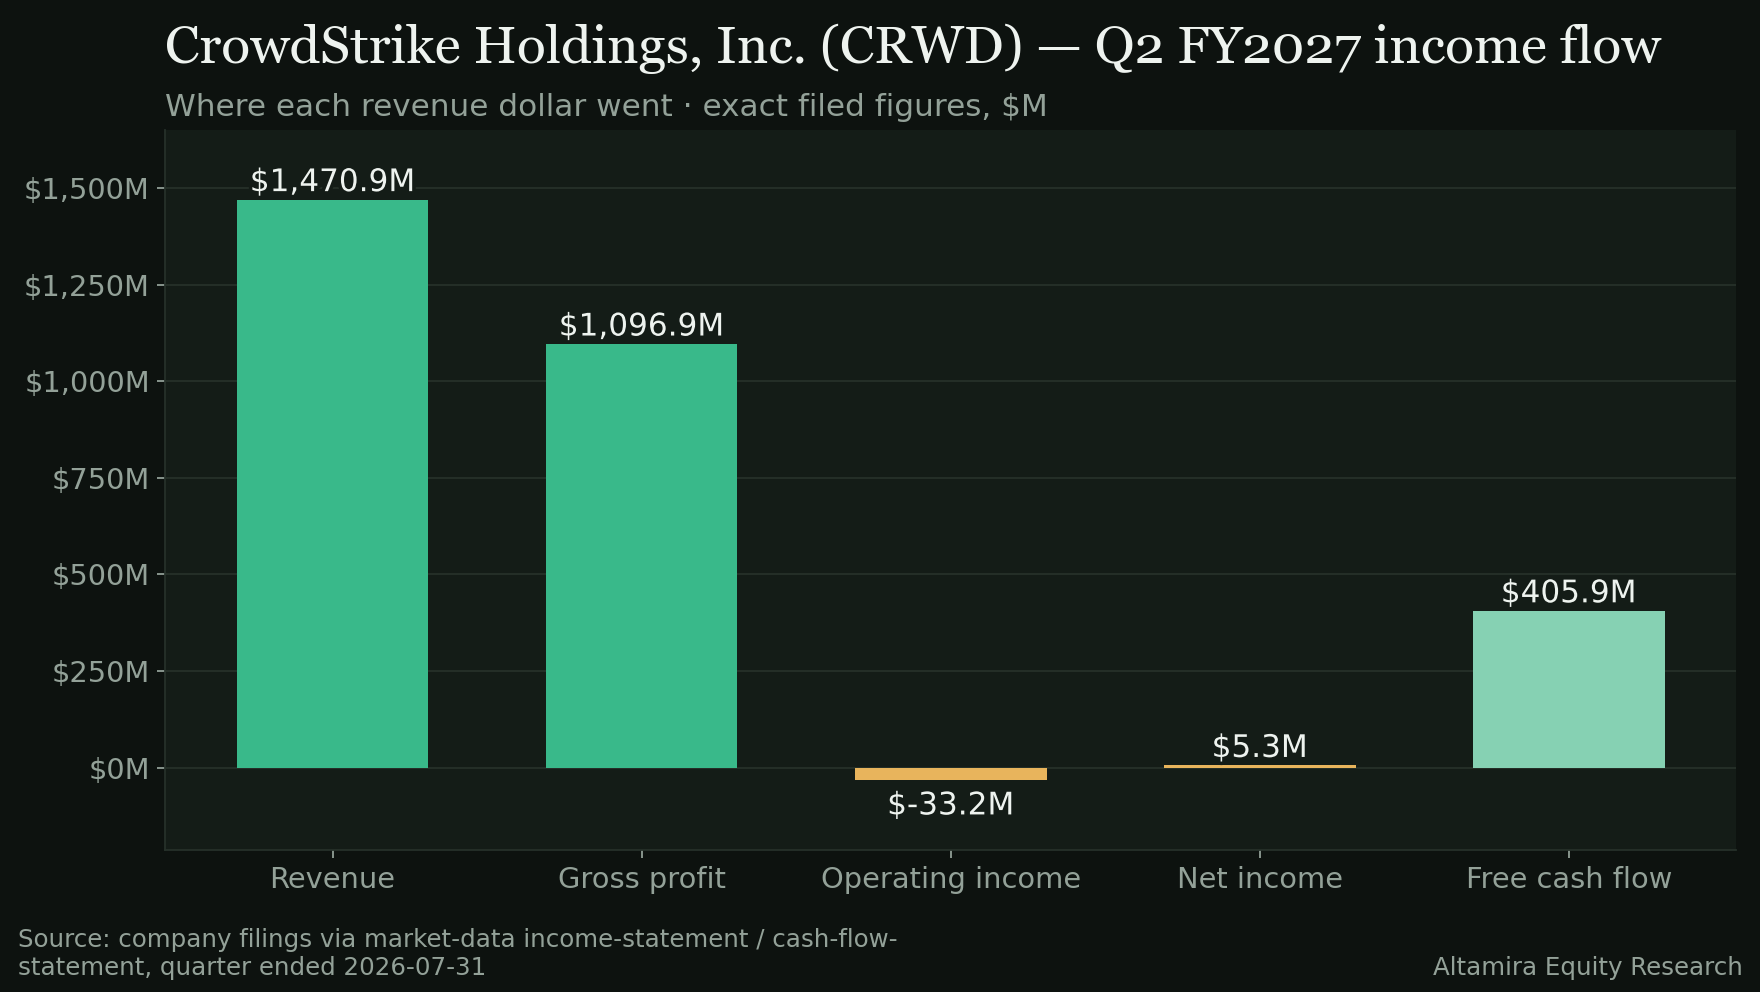
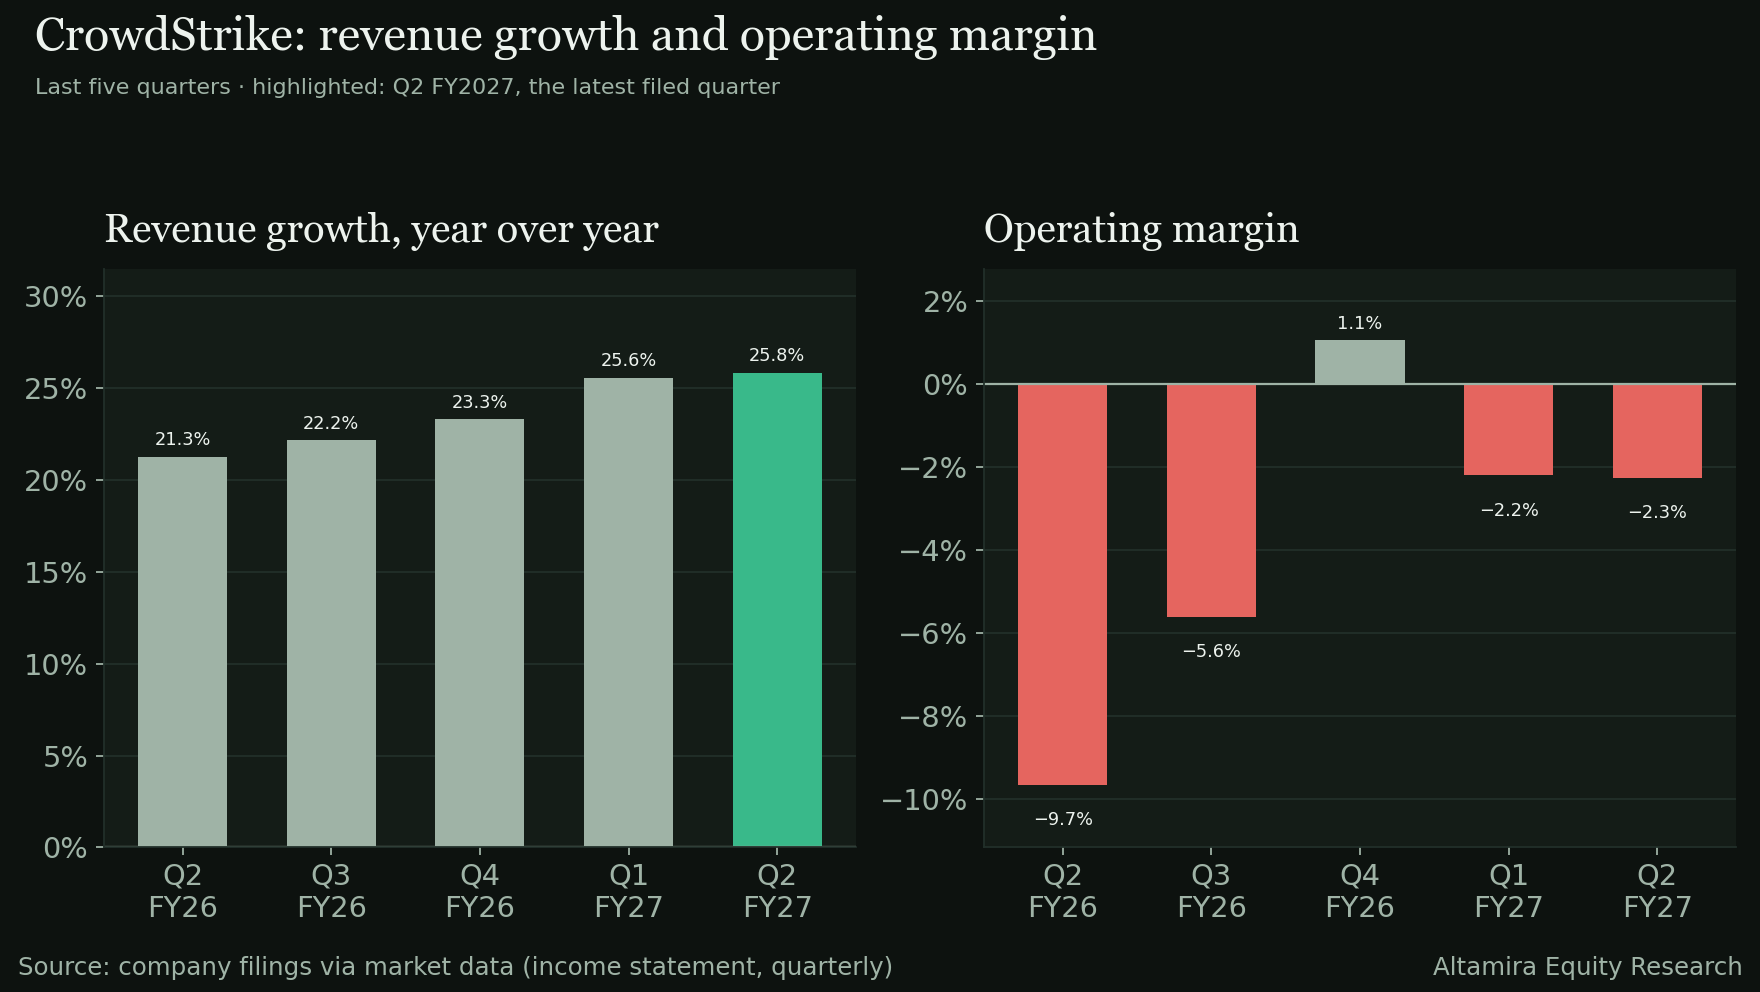
In the latest filed quarter, Q2 FY2027 (period ended July 31, 2026): revenue of $1,470.9M, up 25.83% year over year and 6.15% sequentially. Cost of revenue was $374.0M (25.43% of revenue), leaving a gross profit of $1,096.9M (74.57%). Operating expenses were $1,130.1M (76.83%) — R&D of $444.2M (30.20%) and SG&A of $685.9M (46.63%) — producing an operating loss of $33.2M, a −2.26% operating margin, though up 741 basis points year over year. Pre-tax income was $3.9M (0.27%); after a tax benefit of $1.4M, net income was $5.3M, a 0.36% net margin, up 701 basis points year over year. Free cash flow was $405.9M, 27.59% of revenue.
The swing line quarter over quarter is free cash flow, not the income statement: operating margin was essentially flat sequentially (−5 bp) while free-cash-flow margin fell 801 basis points, from 35.60% the quarter before to 27.59% — the subject of the quality-of-earnings section below.
The long view — FY2021 to FY2026
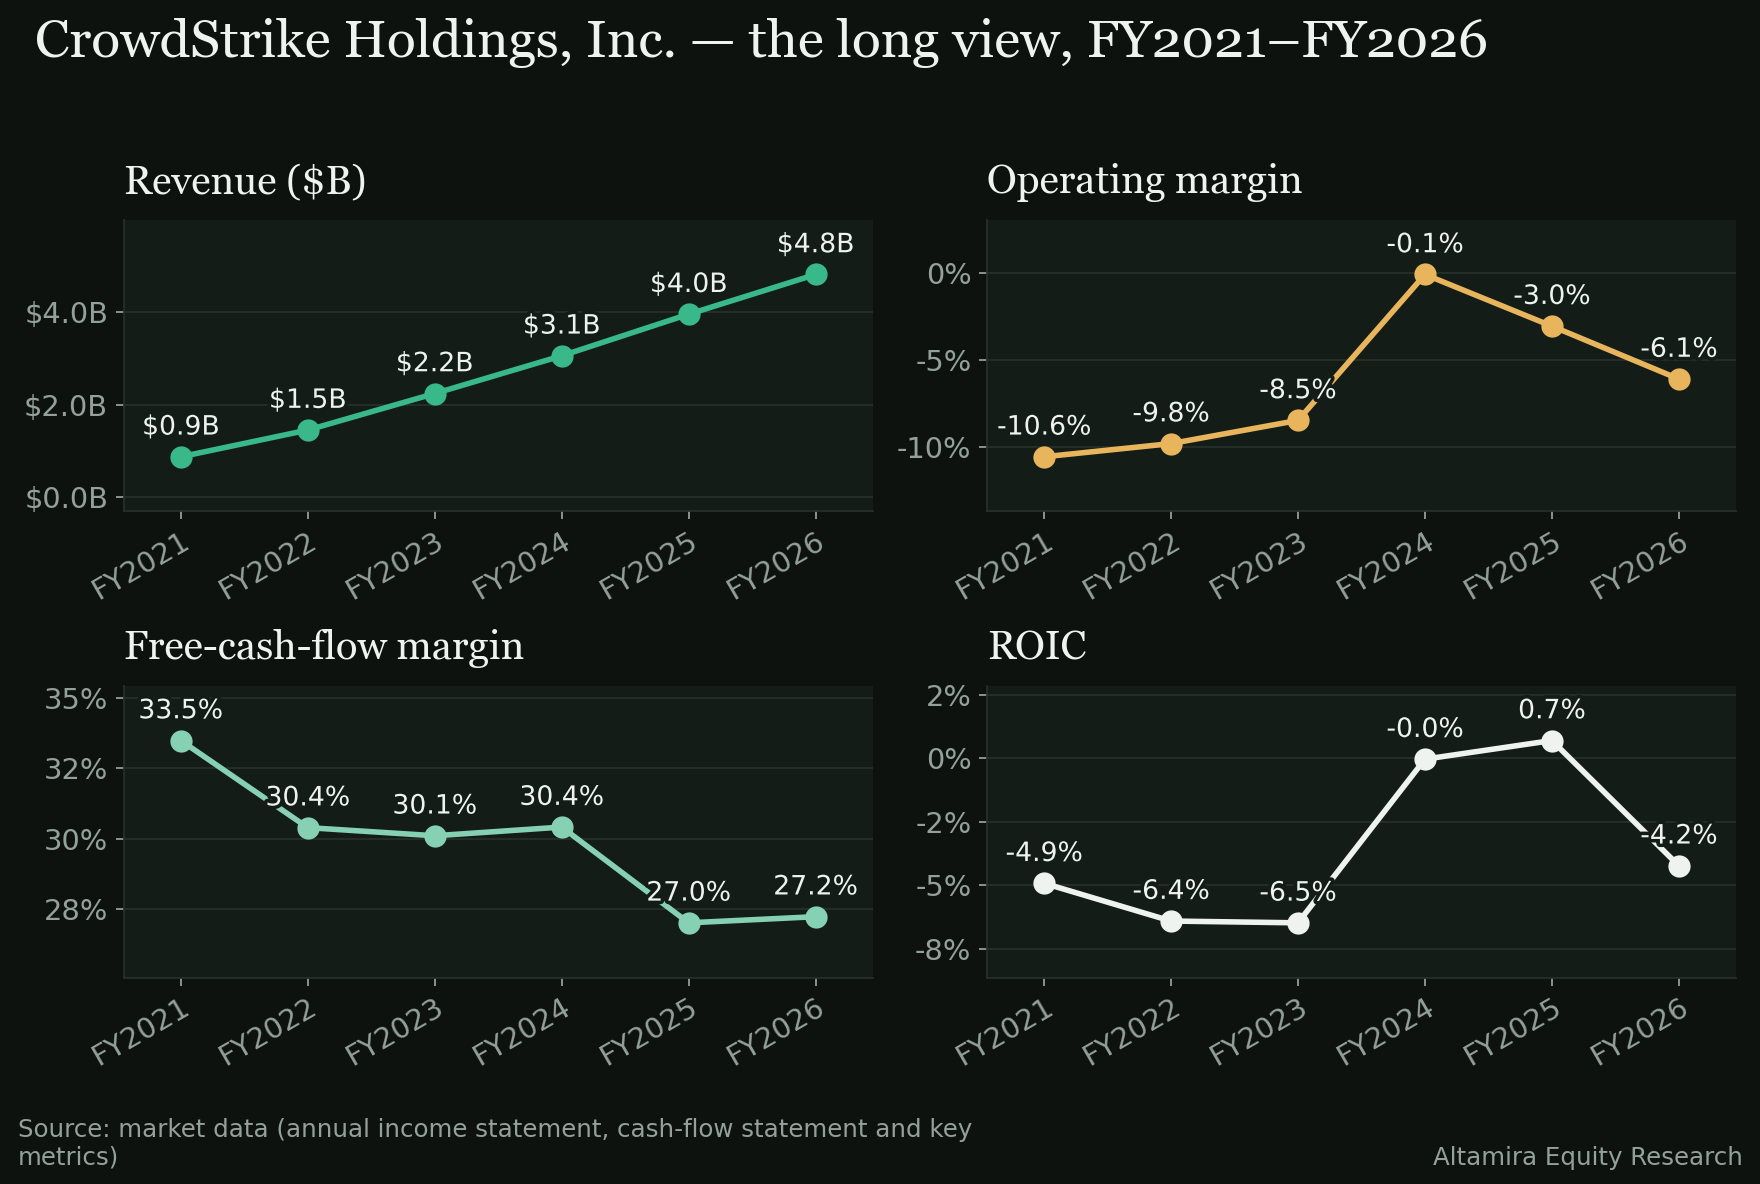
- Revenue growth. $0.87B in FY2021 to $4.81B in FY2026, a 40.64% compound rate, with every year in the window growing — FY2022 $1.45B, FY2023 $2.24B, FY2024 $3.06B, FY2025 $3.95B — a steady deceleration in growth rate even as the dollar base has kept expanding.
- Operating margin. −10.58% in FY2021, the weakest point in the window, improving to −9.82% in FY2022, −8.48% in FY2023 and −0.07% in FY2024 — the closest the line has come to breakeven — before slipping back to −3.05% in FY2025 and −6.10% in FY2026. The net move across the five years is an improvement of 449 basis points, but no year in the window has closed with a positive full-year operating margin.
- Cash. Free-cash-flow margin has stayed in a narrow band across the window, from 33.48% in FY2021 to 27.23% in FY2026, with FY2023 (30.10%) the highest point in between; free cash flow itself compounded at 34.95%, close to the 40.64% revenue rate.
- ROIC. −4.93% in FY2021 to −6.42% in FY2022, then briefly positive at 0.70% in FY2025 before falling back to −4.24% in FY2026 — the only one of the four lenses without a clear directional trend across the five years.
Quality of earnings
Net income in the latest quarter was $5.3M, up 106.83% year over year but still a thin 0.36% net margin on $1,470.9M of revenue. Free cash flow of $405.9M was far larger than net income — 7,648.98% of it — a gap driven mainly by non-cash items rather than operating cash flow alone, since operating cash flow of $530.3M against capital expenditure of $124.4M left the $405.9M free-cash-flow figure, still comfortably ahead of the net income line but down from a free-cash-flow margin of 35.60% the quarter before.
Diluted share count was 1,044,469,000, up 4.48% year over year and 1.25% sequentially — dilution rather than buyback, with no dividends or buybacks recorded in the quarter. The balance sheet at July 31, 2026 carried $5,013.8M of cash and short-term investments against $820.2M of total debt, for a net cash position of $4,193.7M — a balance sheet with no leverage to speak of, against $5,101.7M of shareholders' equity.
Valuation — what the price already says
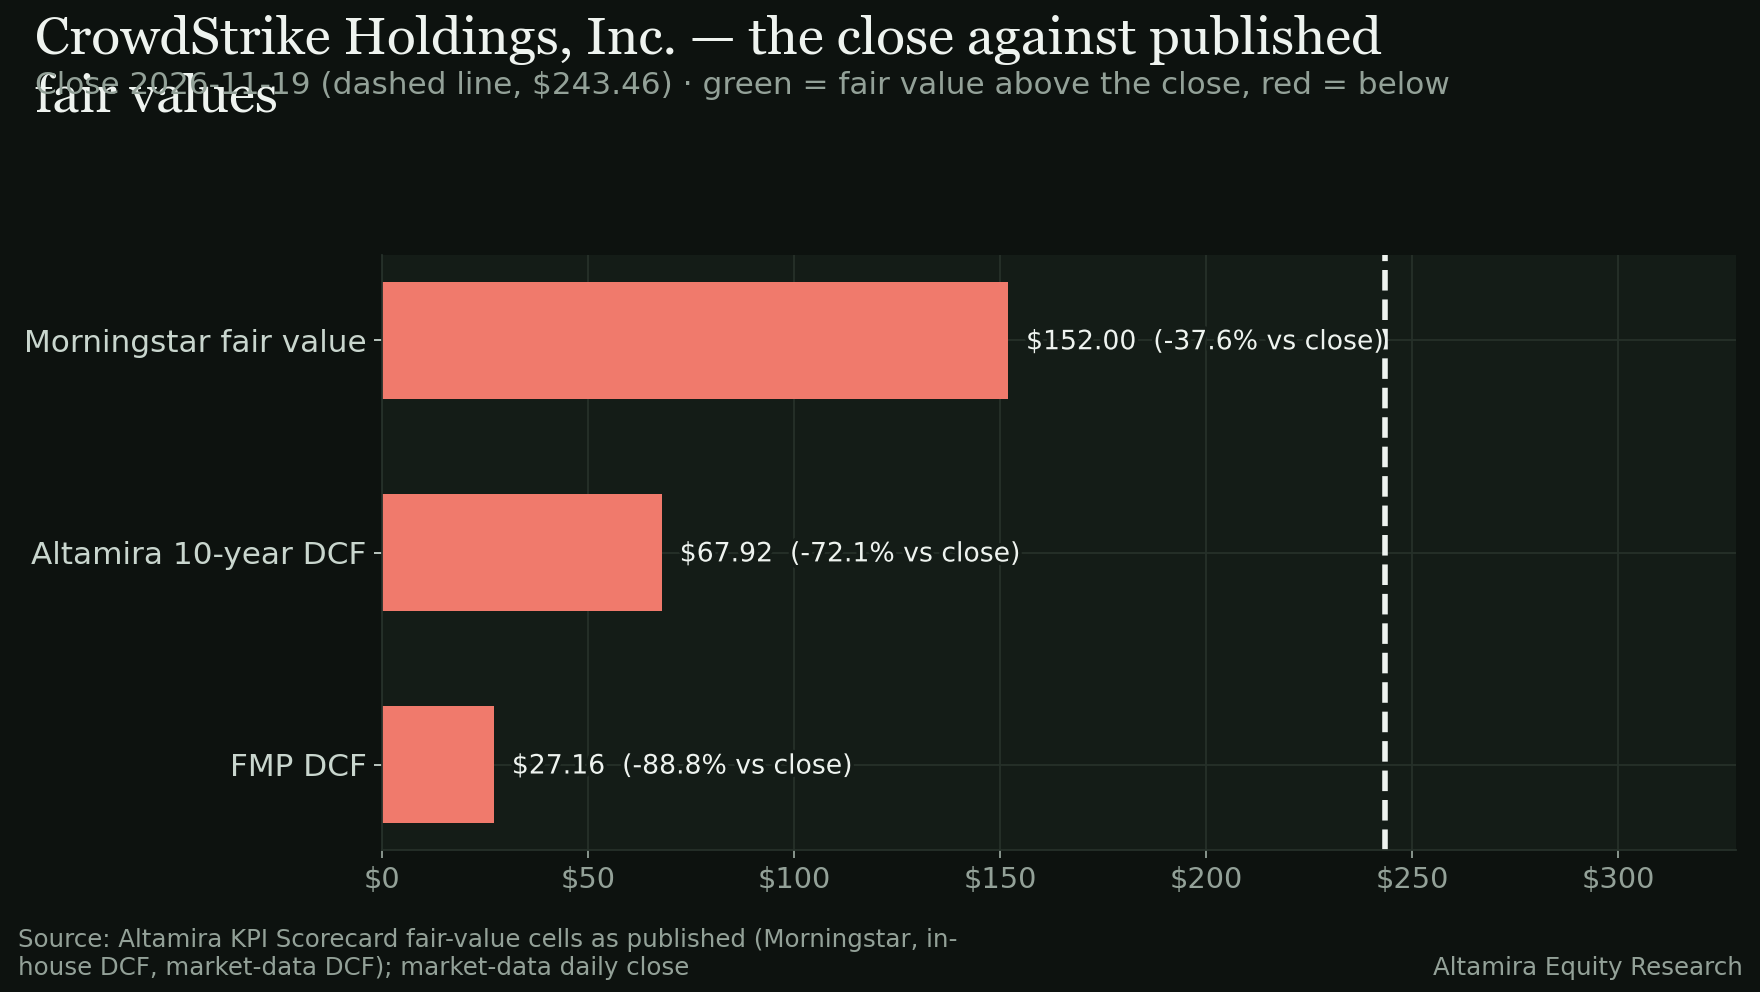
At the November 19, 2026 close of 243.46, the stock sits above all three fair-value figures the KPI Scorecard carries for CrowdStrike:
| Source | Fair value | As of | Price vs fair value | Fair value vs price |
|---|---|---|---|---|
| External DCF model | 27.16 | 2026-11-14 | +796.37% | −88.84% |
| Altamira 10-year DCF | 67.92 | n/a | +258.44% | −72.10% |
| Morningstar fair value | 152.00 | 2026-08-27 | +60.17% | −37.57% |
The published range runs from 27.16 to 152.00 — every model below the current price, with the gap narrowest against the Morningstar figure (margin of safety −55.94%) and widest against the external DCF model. Fair value is stated as published in the dataset; analyst price targets are excluded from this comparison (R7). On a trailing basis the stock trades at a P/E of 6,916.48 with a free-cash-flow yield of 0.63% and ROIC of −1.57%.
The scorecard read
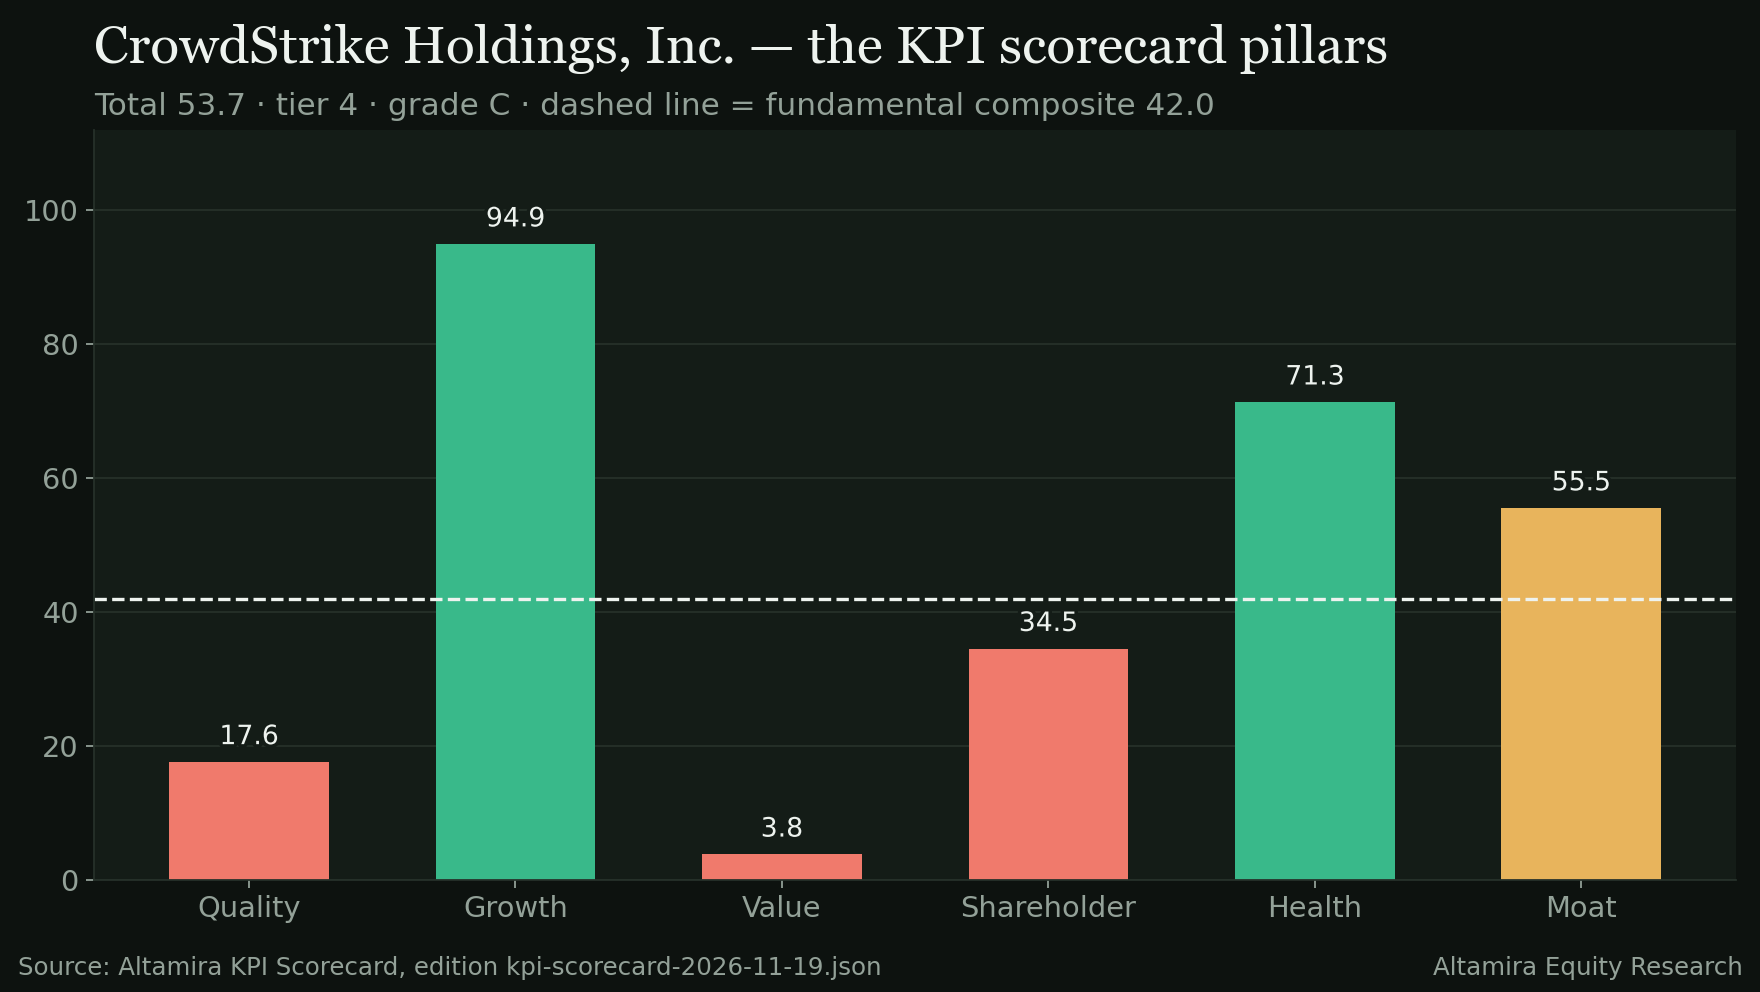
The November 19, 2026 edition of the Altamira KPI Scorecard has CrowdStrike at a fundamental composite of 42.0, built from a growth pillar of 94.9 — among the strongest in the scorecard universe — and a health pillar of 71.3, against a quality pillar of 17.6, a value pillar of 3.8 and a shareholder pillar of 34.5 near the bottom. The technical score is 81.0, far above every fundamental pillar except growth, producing a blended total of 53.7, tier 4, grade C, state PULLBACK, rank 202 with a one-day delta of 2.6. The spread between the 94.9 growth pillar and the 3.8 value pillar is the single widest gap on the sheet for this name — a scorecard that is, in effect, two different stories at once.
The honest counterweight
Three cells argue against reading the growth record as justification for the current price.
- No fiscal year in this five-year window has closed with a positive full-year operating margin. The improvement from −10.58% to −6.10% is real, but the line has never crossed zero, and the FY2026 reading is actually worse than FY2024's −0.07%, the closest the company has come.
- Every published fair-value model sits below the price, and by a wide margin at the closest one. A 60.17% gap to the Morningstar figure, the narrowest of the three, is not a rounding difference; all three independent approaches this scorecard tracks disagree with the current price in the same direction.
- The value pillar, at 3.8, is near the bottom of the scorecard's scale. Whatever the growth and health pillars say about the business, the scorecard's own valuation read is one of the weakest cells on the sheet for this name, not a minor footnote to an otherwise clean profile.
The Key Issue
Whether the December 1, 2026 print — consensus revenue of $1,528.4M (+23.84% YoY implied against the prior-year quarter) and EPS of 0.31 — shows the operating-margin line closing the gap to positive for the first time in this five-year window, or confirms FY2026's −6.10% as the new normal after FY2024's near-breakeven −0.07%. That single cell, more than the share price, is what would start to close the gap between the scorecard's growth and value pillars.
Sources
- Market data (actuals vs consensus, eight quarters), the earnings calendar (report timing), and daily closes (moving averages, ranges and the day's move computed from them) — pulled November 20, 2026.
- Income, cash-flow and balance-sheet statements, quarterly (nine quarters; the Q2 FY2027 statements filed August 27, 2026) and annual for FY2021–FY2026, plus key metrics — market data, pulled November 20, 2026.
- Forward analyst estimates and trailing-twelve-month valuation metrics — market data, pulled November 20, 2026.
- Altamira KPI Scorecard, edition 2026-11-19 (kpi-scorecard-2026-11-19.json): composite, pillar and technical scores, tier, state and fair-value cells as published. Fair value is stated as published in the dataset.
- Morningstar fair value and ratings: Morningstar, as published, dated August 27, 2026, read September 14, 2026 — cited as Morningstar's view, not Altamira's.
- Guidance, segment detail and management commentary: NOT STATED — the earnings-call transcript is not in the dataset for this edition.
Research for information only — not investment advice; see Disclosures.
On the data pages
- CRWD company page — the filed figures, margins, cash flow and the print history, from SEC EDGAR.
- CRWD vs NVDA, head to head — the two on the same scorecard cells (top composite in Technology (kpi-scorecard-2026-11-19.json)).
- Verdict ledger — every public call, on the record.
- Earnings schedule — who reports next, and how every print this season graded.
Free · one field
Get the next recap the morning after the print Get the next CRWD recap the morning after it reports
Previews before the print, the graded recap after it, and the weekly scorecard. Every verdict stays on the public record.
Free. No positions, no tips. Unsubscribe in one click.
Every verdict, graded on the record
Join free