Skyworks: A $1.28 Headline Beat Built on $0.15 of GAAP Earnings
The story in 30 seconds


Headline EPS $1.28 vs $1.27 (+0.79%) · revenue $1,046M, −4.95% YoY, GAAP operating margin 2.13% · FCF −$61M — shares fell 12.63% after hours
Skyworks Solutions, Inc. (SWKS, NASDAQ) · Fiscal Q4 2026 (period ended Oct 2, 2026), reported Mon Nov 3, 2026 after the close · All figures from filed financials and the earnings release, traced in the edition's source notes
The story in 30 seconds
- Skyworks beat the headline on both lines — headline EPS $1.28 vs $1.27 expected (+0.79%) and revenue $1,046M vs $1,036M (+0.93%) — its ninth consecutive EPS beat, on revenue down 4.95% year over year.
- The filed quarter underneath deteriorated: GAAP operating income was just $22M at a 2.13% margin (−796 basis points year over year), GAAP diluted EPS was $0.15 against the $1.28 headline, and free cash flow was −$61M.
- The open question is explanation versus trend: gross margin actually improved to 40.87%, the damage sits in $405M of operating expenses including $82M of other expenses, and the earnings call that would explain it has not yet been posted — so no guidance is available and none is inferred here.
Skyworks beat its quarter by one cent and lost an eighth of its value after hours. The headline — earnings per share of $1.28 against a $1.27 estimate, revenue of $1,046M against $1,036M — is, on its own terms, a beat. The filed income statement underneath it is a different document: operating income of $22M on more than a billion dollars of revenue, a GAAP diluted EPS of fifteen cents, and negative free cash flow. The after-hours move — down 12.63% to $74.42 from $85.17, against an eight-quarter average absolute move of ±6.64% — was the market reading the filing, not the headline.
That gap, between the headline basis the beat is measured on and the GAAP basis in the filing, is the whole Skyworks question this quarter. The business question was supposed to be diversification: a radio-frequency front-end supplier concentrated in handsets, and above all in one very large handset customer, trying to prove that broad markets — automotive, industrial, connected home, infrastructure — can carry more of the revenue. This print cannot answer it. No segment or customer split is disclosed, revenue fell 4.95% year over year even as it rose 11.86% sequentially on the seasonal handset ramp, and the earnings call has not yet been posted.
So this post reads the filed quarter line by line, and then places it in the five-year record: revenue down from $5,486M in fiscal 2022 to $4,087M in fiscal 2025, and operating margin down from 31.57% to 12.23% over the same filed years, before this quarter's 2.13%. A single bad quarter can be an accident. A five-year slope is a condition.
In this post: first, the print in one picture — how $1,046M of revenue becomes just $23M of net income. Second, what to make of it, including the quality-of-earnings line. Third, the long view — five filed years of shrinking revenue and compressing margin, set against a cash record that held up far better until this quarter. And fourth, the Key Issue: is the 2.13% margin a one-quarter break with an explanation still to come, or the handset model repricing in public?
At a glance — fiscal Q4 2026 scoreboard
This box shows the quarter against the estimates the market was using, so the surprise — not just the size — is visible at a glance.
- Revenue: $1,046M — vs $1,036M est · +0.93% · −4.95% YoY · +11.86% sequentially
- Headline EPS: $1.28 — vs $1.27 est · +0.79% · GAAP diluted EPS $0.15
- Guidance: NOT STATED — the call transcript is not yet posted, so no guidance is available
- Reaction: −12.63% — after-hours $74.42 vs $85.17 prior · 8Q avg ±6.64%
The quarter in one line: Skyworks beat the headline by a cent on revenue down 4.95% year over year, kept just $22M of operating income and $23M of net income from $1,046M of sales, burned $61M of free cash flow — and the market, reading the filing rather than the headline, took 12.63% off the shares.
- Gross profit: $427M — 40.87% · +20bp YoY · +76bp sequentially
- Operating income: $22M — 2.13% · −796bp YoY · −306bp sequentially
- Net income: $23M — 2.24% · GAAP EPS $0.16, diluted $0.15 · diluted shares 151.5M
- Free cash flow: −$61M · operating cash flow $34M · capital spending $95M
- Operating expenses: $405M — research and development $214M · SG&A $109M · other expenses $82M
- Balance sheet: cash $2,606M · total debt $2,473M · net cash $133M
- Valuation context at the print: P/E (trailing) 74.26x · EV/Sales 3.21x · EV/EBITDA 18.28x · free-cash-flow yield −0.07%
- Estimate context: EPS range $1.24–$1.28 (14 analysts) — the $1.28 headline printed at the very top of the range
Basis note: the $1.28 headline EPS and its +0.79% surprise are the non-GAAP basis as reported; the filed GAAP figures are EPS $0.16 and diluted EPS $0.15. The income-statement, cash-flow and balance-sheet lines in this post are the filed GAAP quarter throughout, and the two bases are never mixed within a single figure. No consensus price target is available in the data on file for Skyworks, so none is shown and none is estimated.
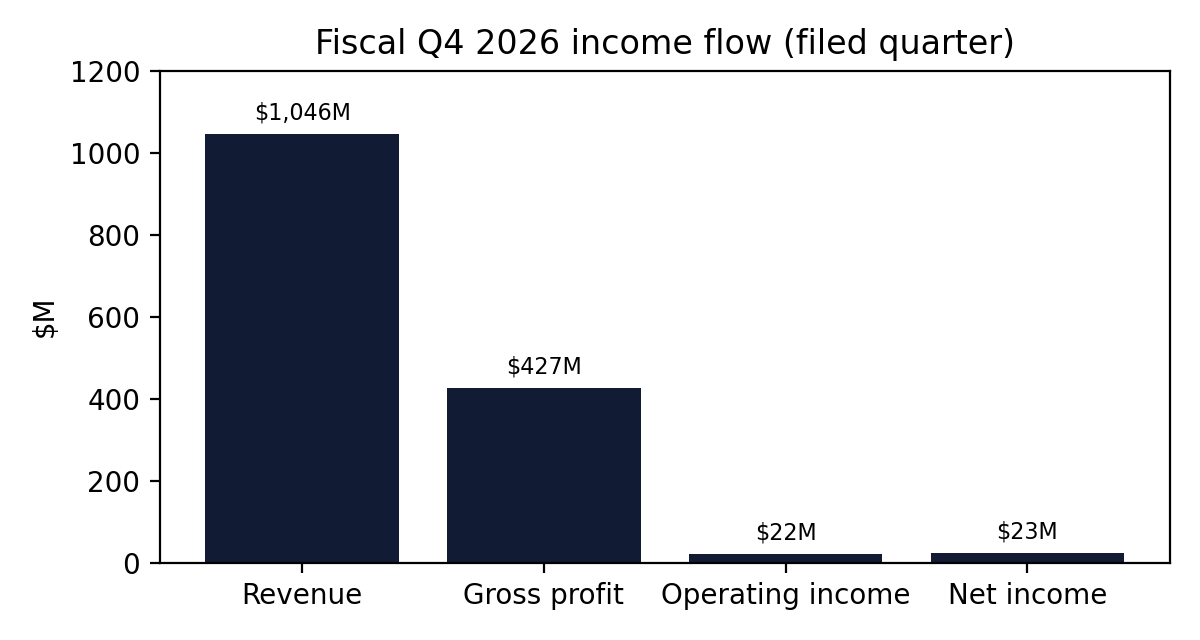
Fiscal Q4 2026 income flow (filed quarter). Source: company filings via FMP. The break is below the gross line: gross profit held at 40.87% of revenue, but operating expenses of $405M consumed all but $22M of it; a $14M tax benefit is what carried net income to $23M.
What to make of this print
These bullets separate what the print proved from what it merely suggested.
- The beat is real and immaterial at the same time. Headline EPS +0.79% and revenue +0.93% extend the streak to nine consecutive EPS beats — but the surprises have been shrinking, from +15.79% four quarters ago to +0.79% now, and this one was earned on revenue that fell 4.95% year over year. Beating a lowered bar by a cent is an execution footnote, not the story of the quarter.
- Quality of earnings: buyback-assisted headline, GAAP earnings collapsed — stated explicitly. The company spent $108M repurchasing shares and the basic share count fell 0.27% sequentially, which mechanically supports per-share figures, while GAAP net income fell to $23M and GAAP diluted EPS printed at $0.15 against the $1.28 headline. Free-cash-flow conversion of −261% means the quarter's reported profit was not cash-backed at all.
- Gross margin held; everything below it broke. Gross profit of $427M at 40.87% improved — +20bp year over year and +76bp sequentially. The collapse is in the $405M of operating expenses, where $82M of other expenses sits alongside $214M of research and development and $109M of SG&A, leaving operating income of $22M and EBITDA of $147M (14.09%). Until the pending call explains the $82M, no reader can say whether it recurs.
- Cash quality failed the quarter outright. Operating cash flow of $34M against $95M of capital spending left free cash flow at −$61M. Stock compensation added a further $50M (4.73% of revenue) of non-cash cost. Against five filed years of strongly positive free cash flow, one negative quarter is a warning rather than a conclusion — but it is a warning about the strongest part of the record.
- The sequential ramp is seasonality, not recovery. Revenue rose 11.86% sequentially, the familiar fiscal-Q4 handset launch ramp — and still fell 4.95% against the same quarter a year ago. The strongest seasonal quarter of the year produced the weakest margin of the recent record.
- The balance sheet is the one line that did not strain. Cash of $2,606M against total debt of $2,473M leaves a net-cash position of $133M, and the quarter's $108M buyback shows capital return continuing through the weak print. There is no solvency question here; the question is whether the quarter is the exception or the run-rate.
Takeaway: strip the headline away and this is a quarter in which revenue shrank, operating margin fell to 2.13%, free cash flow went negative and the diversification question went unanswered — cushioned only by a net-cash balance sheet. That is a quarter awaiting an explanation, and the explanation has not yet been posted.
How Skyworks makes money
This section explains what Skyworks actually sells and why the mix matters, before the long-view numbers judge how well it has worked.
The sector in brief. RF and analog semiconductors sell the physical layer of wireless — the amplifiers, filters, switches and front-end modules that turn a baseband signal into a radio transmission and back. Economics turn on three things: content per device (each new radio standard and frequency band adds filters and modules, so a supplier can grow inside a flat handset market if content rises faster than units fall), customer concentration (the largest handset makers negotiate from enormous scale, and a single design win or loss moves a supplier's year), and diversification (automotive, industrial, infrastructure and connected-home sockets pay lower content per unit but arrive on longer, stickier design cycles). Among the companies this publication tracks most closely, Broadcom and Marvell are adjacent analog and connectivity franchises at far larger scale; Qorvo, which this publication does not track as part of its core universe, is the closest RF front-end peer.
Skyworks Solutions, Inc. develops, manufactures and markets analog and mixed-signal semiconductor products. The catalogue runs from amplifiers, front-end modules, filters, switches and antenna tuners to power, timing and isolation parts, sold through a direct sales force, distributors and independent representatives. Applications span smartphone — historically the centre of gravity — automotive, broadband, cellular infrastructure, connected home, defense, industrial, medical and wearables. The company was founded in 1962, is headquartered in Irvine, California, employs roughly 10,000 people, and is led by chief executive Philip G. Brace. Two honest limits: the data provider's segmentation for Skyworks is empty, and the fiscal Q4 print discloses no segment or customer split — so no segment dollars are stated anywhere in this post, because none exist in the traced sources.
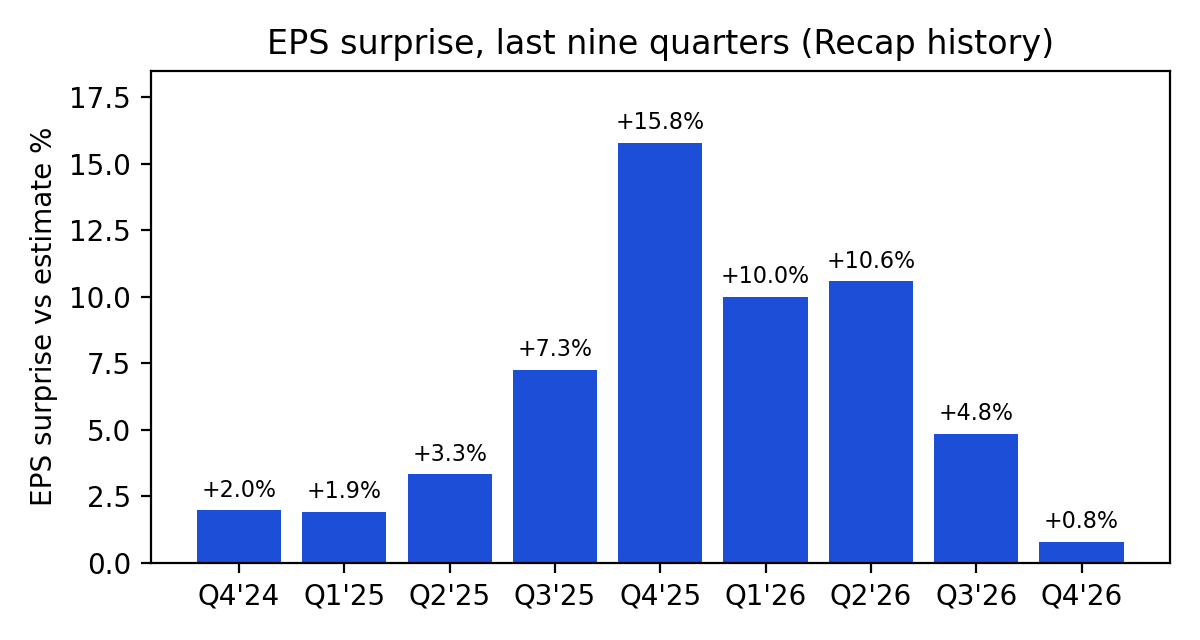
EPS surprise versus estimate, last nine quarters. Source: company filings via FMP. Nine consecutive beats — but read the slope: the surprises have compressed from +15.79% to +0.79%, a streak continuing in name while fading in substance.
The long view
One quarter can flatter any company; these four lenses judge Skyworks on five years of filed results, with the quarter as the latest data point rather than the story. The charts in this section are rendered from verified filed values, as their captions state. The filed annual window ends at fiscal 2025 (ended Oct 3, 2025); the fiscal Q4 2026 print completes fiscal 2026, but no filed fiscal-2026 annual is in the data on file, and the window is labelled accordingly.
Revenue growth — does the top line compound?
Revenue growth is the first lens because Skyworks' story is a content-and-diversification story that must, eventually, show up as a growing top line. It does not yet: five-year revenue CAGR is 4.02% and the three-year rate is −9.34%, outright negative. Filed revenue tells the same story in dollars: $5,109M (FY2021), $5,486M, $4,772M, $4,178M and $4,087M in FY2025 — a business $1.4 billion smaller than its FY2022 peak. This quarter's note: −4.95% YoY, +11.86% on the seasonal ramp. Judgment: the top line is not compounding; it is contracting in slow motion, and every other lens in this section is downstream of that fact.
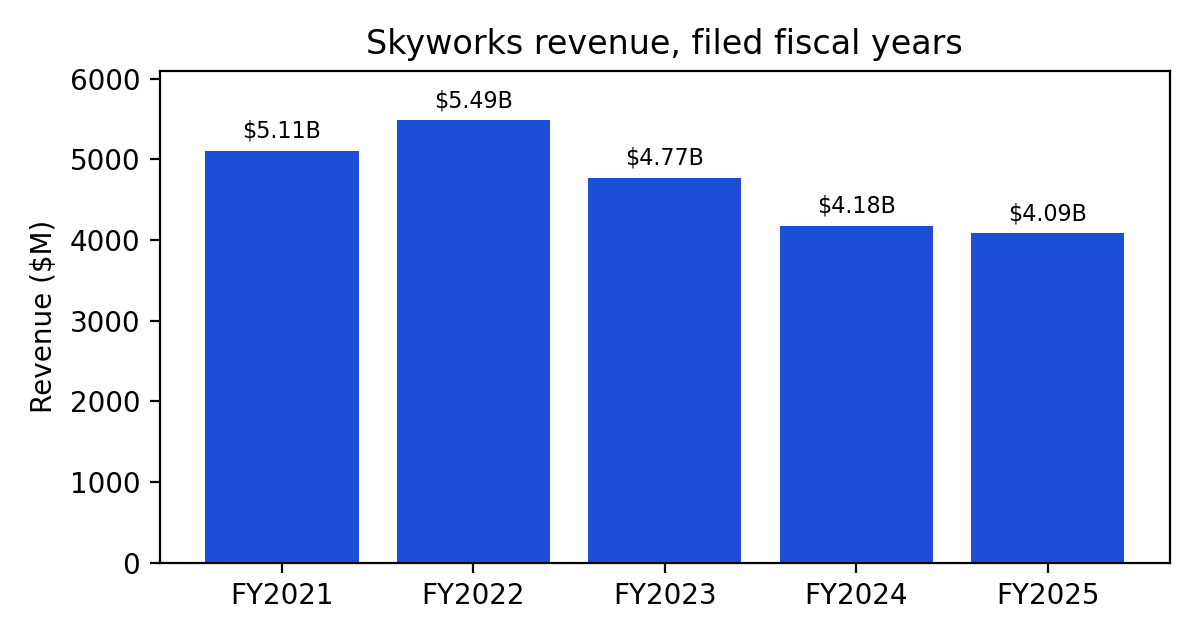
Filed fiscal-year revenue, FY2021–FY2025. Source: company filings via FMP. The FY2022 peak of $5,486M and the three consecutive declines since are the chart the diversification story has to reverse.
Operating margin — does growth drop to profit?
Margin is the second lens because an RF supplier's defence against customer concentration is supposed to be exactly this: differentiated content that holds its price. The filed record shows the defence eroding year by year — operating margin of 31.57% (FY2021), 27.84%, 23.57%, 15.26% and 12.23% in FY2025, a five-year simple average of 22.09%. This quarter's note: 2.13%, with the break located below a gross margin that actually improved to 40.87%. Judgment: five years of compression looks structural until proven otherwise — but the specific Q4 break sits in $82M of other expenses that the pending call has not yet explained; if that line is genuinely one-off, the structural rate is nearer FY2025's 12.23% than this quarter's 2.13%.
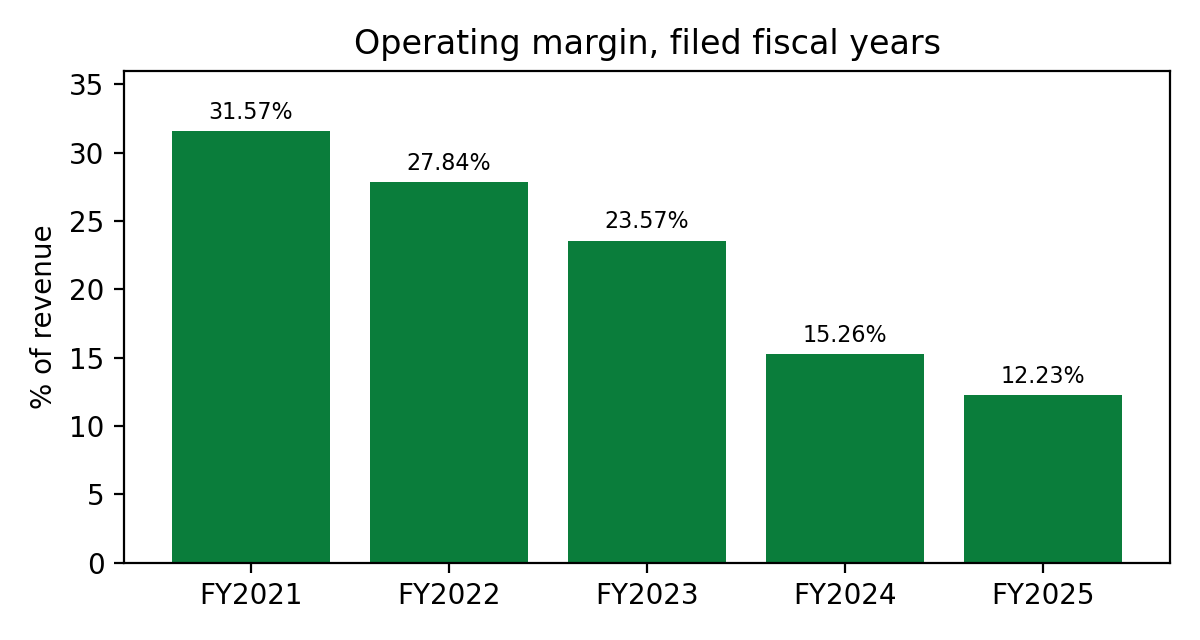
Filed operating margin, FY2021–FY2025. Source: company filings via FMP. A near-perfect staircase down — 31.57% to 12.23% in four steps — is the single most important chart in this post.
Cash — do the earnings arrive as cash?
Cash is the third lens because it is where Skyworks' record parts company with its income statement — historically in the company's favour. Filed free cash flow was $1,120M (FY2021), $915M, $1,620M, $1,668M and $1,106M in FY2025 — free-cash-flow margins of 21.92%, 16.68%, 33.95%, 39.92% and 27.06% — with FY2025 operating cash flow of $1,301M against $195M of capital spending. The five-year operating-cash-flow-to-net-income ratio is 169.35%. This quarter's note: −$61M, at −261% conversion. Judgment: cash generation has been this company's saving grace through the whole revenue decline, which is exactly why a negative quarter matters — one quarter does not establish that the cash lens is following the margin lens down, but it starts the clock.
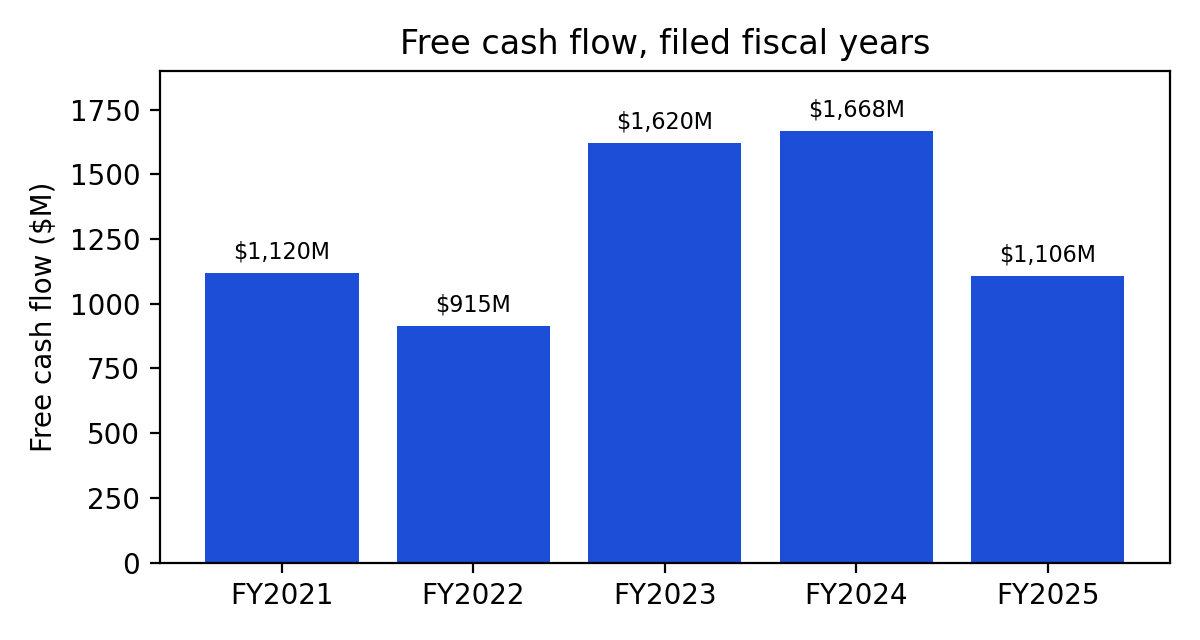
Filed free cash flow, FY2021–FY2025. Source: company filings via FMP. Free cash flow in FY2024–FY2025 held near record levels while revenue fell — the resilience this quarter's negative print puts in question.
Returns on capital — what does each invested dollar earn?
Returns on capital are the fourth lens because they test whether the remaining business still earns its keep on the capital already invested. Five-year return on invested capital is 12.47% and return on capital employed is 14.25% — middling figures that average a high-return handset franchise at its peak with the thinner business that replaced it. The trailing gross margin on the data on file is 41.16% and the trailing net margin 11.67%, both well above this quarter's filed net margin of 2.24%. This quarter's note: a 2.13% operating margin, annualised, would drag measured returns down mechanically if it persisted. Judgment: returns remain respectable on the five-year window precisely because the window still contains the old franchise; the margin staircase says the forward return on this capital base is lower than the backward one.
Beyond the print — the business this quarter
Earnings describe the last thirteen weeks; these developments describe the next several years.
- The Qorvo combination is the industry's structural story (announced combination, pending). A combination between Skyworks and its closest RF front-end peer has been announced and remains pending — framed here as context, with execution still to be proven. For an RF supplier facing the margin staircase above, combination is the scale answer: more content, more bargaining weight, one fewer competitor bidding content down. Execution — closing, integration, customer retention through the uncertainty — is the risk inside it.
- The handset ramp arrived on schedule (filed). Revenue's +11.86% sequential rise is the fiscal-Q4 launch-season pattern doing what it always does. What it did not do this year is grow the year-ago quarter (−4.95%) — the ramp is intact, the base beneath it is shrinking.
- The balance sheet stayed a net-cash balance sheet (filed). Cash of $2,606M against total debt of $2,473M — net cash of $133M. Leverage is not the constraint on this story; demand and margin are.
- Capital return continued through the weak quarter (filed). Buybacks of $108M in the quarter and a trailing dividend of $2.84 per share, a 3.46% yield on the latest price in the data on file. No dividend payment was recorded in the quarter itself; the $2.84 is a trailing-twelve-month figure.
What the filing shows — management commentary pending
This section normally reports what management guided and claimed, in their own words; for this print it cannot, and this box states exactly what is missing rather than filling the space. The fiscal Q4 2026 earnings-call transcript has not yet been posted in the data on file, so this post carries no management quotes and infers none. Guidance is NOT STATED. What the filing alone establishes: margins (gross 40.87%, +20bp YoY and +76bp sequentially; operating 2.13%, −796bp YoY, with $82M of other expenses inside $405M of operating expenses — unexplained on the filed record); capital return ($108M of buybacks, basic shares −0.27% sequentially, stock compensation of $50M at 4.73% of revenue); and demand shape (+11.86% sequential, −4.95% YoY, with no segment or customer split disclosed). The explanation for the margin collapse, the composition of the $82M, the broad-market mix and any forward guidance all sit in the missing call.
The Key Issue — is 2.13% a break with an explanation, or the handset model repricing?
Every post in this series isolates the one question the next year will actually answer; this is Skyworks'.
Thesis. Can Skyworks explain — and then reverse — an operating margin that has fallen from 31.57% to 12.23% in four filed years and printed at 2.13% this quarter, while diversifying revenue away from the handset concentration that produced the decline? The forward earnings multiple in the data on file, 16.00x, assumes the margin floor is somewhere near the recent past; the five-year staircase assumes it is not a floor at all but a slope. The pending call is the first test, because it must assign the $82M of other expenses and the 796-basis-point year-over-year margin decline to causes that either recur or do not.
Evidence for the “break, not slope” reading. The break is located in one place: gross margin improved (+20bp YoY to 40.87%), so the product still prices; the damage sits below it, in an expense block whose largest single unusual item — $82M of other expenses — is exactly the kind of line that can carry one-off charges. The five-year cash record argues the underlying machine still works: free cash flow of $1,106M as recently as FY2025 at a 27.06% margin, and a five-year cash-conversion ratio of 169.35%. The balance sheet (net cash) buys time for the explanation and the fix. And the valuation already concedes a great deal: at 16.00x forward earnings on the data on file, the market is not paying for the old franchise.
Evidence for the “slope” reading. Start with the staircase itself: four consecutive filed years of margin decline, on revenue that peaked in FY2022 and has fallen since — that is not noise, it is a trend with a cause, and the obvious candidates are handset-customer concentration, RF content commoditization and China handset weakness. Then this quarter's specifics: revenue down year over year in the seasonally strongest quarter, free cash flow negative, and the EPS surprise streak compressing to +0.79%. Finally, the missing evidence cuts against the company here, not for it: the diversification disclosure that would prove the mix is improving is absent from the print entirely.
What to watch. (1) The pending call itself: an explanation of the operating-margin collapse and of the $1.28 headline versus $0.15 GAAP gap, an account of the negative free cash flow, a disclosure of broad-market mix versus handset exposure, and guidance that shows whether the after-hours reaction was about the outlook or only about this quarter. (2) The external datapoint — the handset read-across from this publication's own Apple coverage (Nov 18): Apple's fiscal Q4 print beat on both lines with total revenue up double digits year over year, yet its call was itself unavailable in the data on file, so neither services nor phone segment detail could be verified there either. The read-across that can honestly be drawn is narrow but real: the largest handset customer's top line is growing while its RF supplier's revenue shrinks — pointing at content and share inside the phone, not at the phone market itself, as Skyworks' problem. (3) The Qorvo combination, the industry's own consolidation datapoint: its execution milestones, and any customer defections during it, will show whether consolidation is the cure for the staircase or merely a larger company on the same slope. (4) The cash line, next quarter: free cash flow back to the conversion standard of the five-year record, or a second negative print that turns a warning into a pattern. Historical analogy: RF and analog suppliers have lived this cycle before — in prior handset downturns and socket-loss episodes, the pattern has been the same shape as this filing: revenue holds up seasonally while margin, negotiated away socket by socket and generation by generation, gives ground first and fastest, and recovery, when it came, came through content diversification and consolidation rather than through the handset cycle simply turning. The analogy is qualitative and is stated without figures; its lesson is narrow — margin staircases in this industry have historically been structural until a structural answer was actually delivered. The forward question: when the call finally posts, does its explanation assign the 2.13% to causes that end — and does the next print's broad-market disclosure show a mix that can carry a margin the handset business no longer will?
Sources: filed financials and consensus estimates via FMP (earnings scoreboard, income statement, cash flow and estimate history for fiscal Q4 2026 and fiscal years 2021–2025), the fiscal Q4 2026 earnings release, and the company's product descriptions. Consensus estimates in the data on file are dated Oct 24, 2026 and predate the print; the consensus forward path on that vintage is fiscal-2027 revenue growth of +2.57% with EPS −0.40% against fiscal 2026.
Disclosure: This post is analysis for information only and is not financial advice. The author may hold positions in companies discussed.
Free · one field
Get the next recap the morning after the print Get the next SWKS recap the morning after it reports
Previews before the print, the graded recap after it, and the weekly scorecard. Every verdict stays on the public record.
Free. No positions, no tips. Unsubscribe in one click.
Every verdict, graded on the record
Join free