S&P Global: The Only Revenue Decline in Nine Quarters — the Highest Margin in Nine Quarters Too
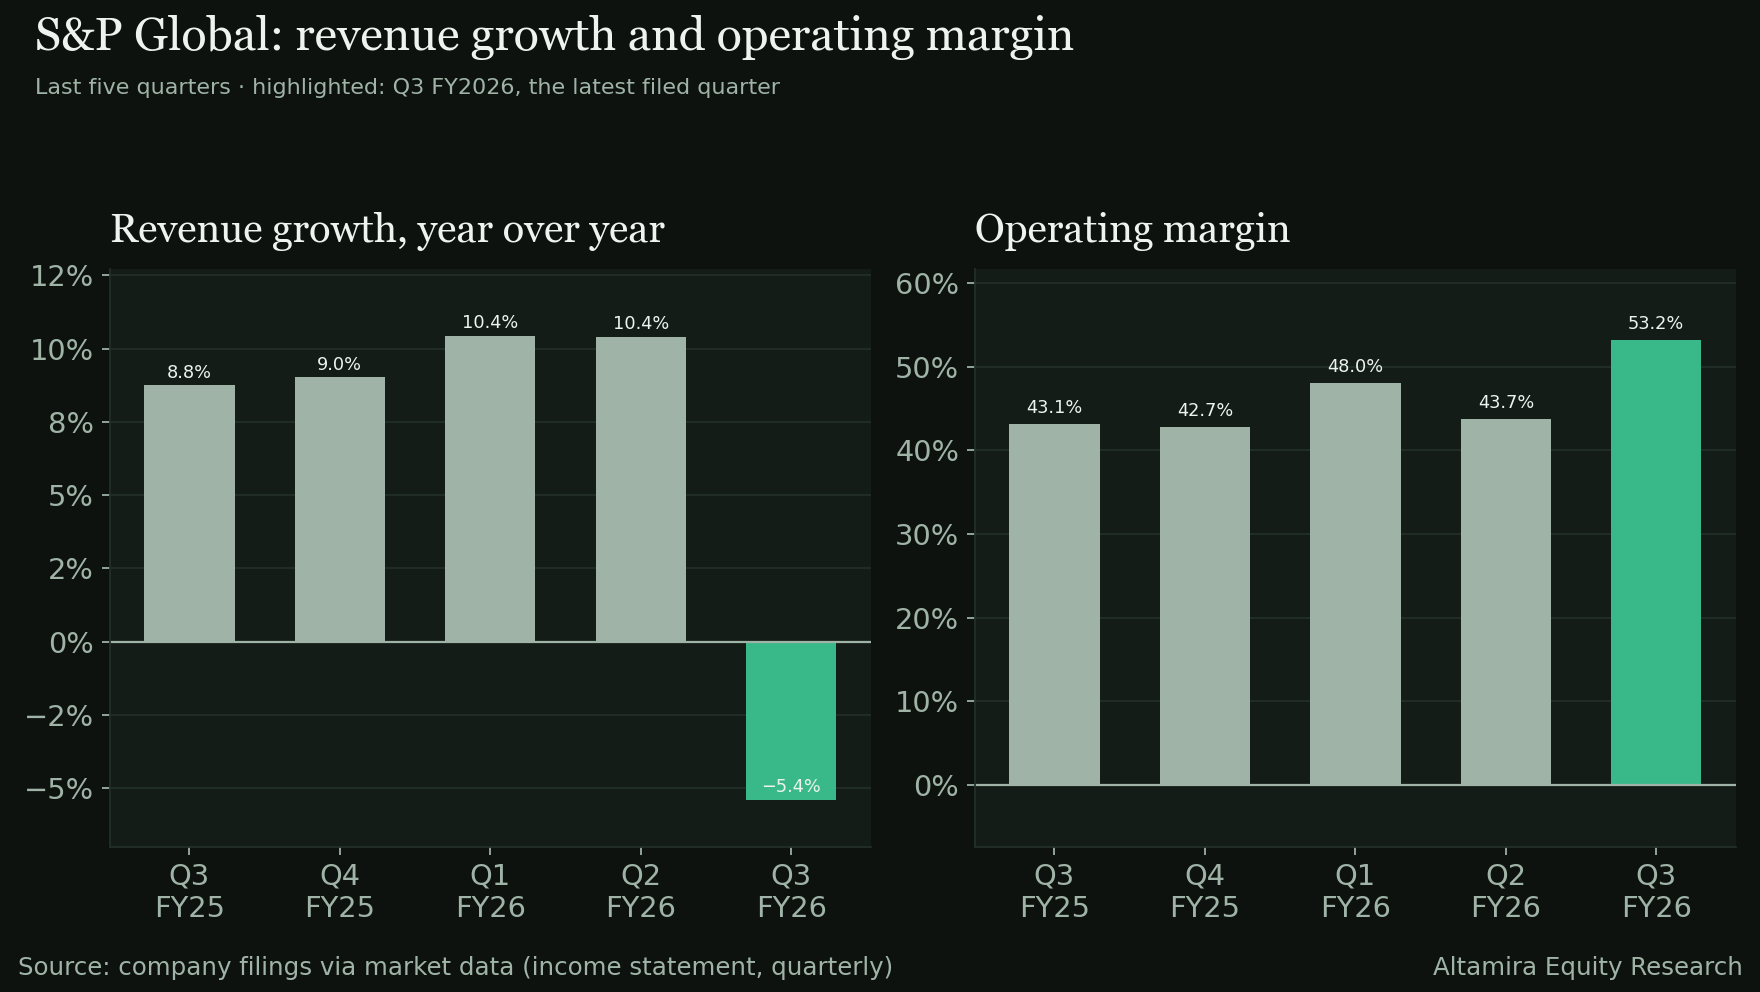
S&P Global beat on both revenue and EPS on October 27, grade B, even as revenue fell year over year for the first time in the nine quarters shown here. Operating margin expanded to the highest level of that same span. The stock has drifted lower since the print.
The story in 30 seconds
S&P Global beat on both revenue and EPS on October 27, grade B, even as revenue fell year over year for the first time in the nine quarters shown here. Operating margin expanded to the highest level of that same span. The stock has drifted lower since the print.


Revenue $3,678.0M beat estimate by +0.97% but fell −5.40% YoY · EPS 4.58 beat consensus by +3.39% · operating margin 53.18%, +1,010 bp YoY, the highest of the last nine quarters · stock −0.38% on the print
The story in 30 seconds
- S&P Global reported its third fiscal quarter on October 27, 2026: revenue of $3,678.0M beat the $3,642.7M estimate by 0.97% and EPS of 4.58 beat the 4.43 estimate by 3.39% — grade B on our rubric — even though revenue itself fell 5.40% year over year, the only year-over-year decline in the nine quarters of this dataset.
- The headline beat hides the margin story underneath it: operating margin reached 53.18%, up 1,010 basis points year over year and 948 basis points sequentially, the highest level in the nine quarters shown here, in the same quarter revenue shrank.
- The open question is what combination of mix, cost control and a smaller revenue base produced a nine-quarter-high margin on a nine-quarter-low revenue growth rate — a question this dataset cannot answer, since guidance and management commentary are not in it.
S&P Global reported on October 27, 2026. Read quickly, a 0.97% revenue beat and a 3.39% EPS beat look like a routine quarter for a company whose last eight prints have produced six A/B grades. The correct reading sits one line down: revenue of $3,678.0M was 5.40% below the year-ago quarter's $3,888.0M and 11.29% below the prior quarter's $4,146.0M — the only negative year-over-year quarter in the series this pack carries. At the same time, operating margin expanded to 53.18%, above every full fiscal year in the five-year annual record shown here (FY2021's 50.87% is the next-highest point) and the highest of the nine quarters in this dataset.
S&P Global provides benchmarks, data, analytics and workflow solutions across five segments — Market Intelligence, Ratings, Energy, Mobility and Dow Jones Indices — a business that has compounded revenue at 15.56% a year since FY2020 while operating margin has fallen 636 basis points over that same five-year window, from a FY2020 level of 48.60% to 42.24% in FY2025. This quarter's 53.18% margin sits well above that FY2025 level, arriving in the same quarter the company's own revenue growth went negative for the first time in this dataset's history.
In this post: (1) the quarter against a track record of consistent beats, now broken by a revenue decline; (2) where the revenue dollar went, in one chart; (3) what to make of the margin, cash and share-count lines; (4) the five-year record against this one quarter; (5) the honest counterweight and the Key Issue for February.
At a glance — Q3 FY2026
- Revenue: $3,678.0M vs $3,642.7M expected · +0.97% surprise · −5.40% YoY
- EPS: 4.58 vs 4.43 expected · +3.39% surprise
- Guidance: NOT STATED — the earnings-call transcript is not in the dataset; no guidance class is assigned and none is invented here
- Reaction: −0.38% close to close, from 450.65 (2026-10-26) to 448.93 (2026-10-27) · 0.1x the 8-quarter average absolute move of 3.68%
- Margins: gross 71.89% (+72 bp YoY, −1 bp QoQ) · operating 53.18% (+1,010 bp YoY, +948 bp QoQ) · net 33.71% (+347 bp YoY, +436 bp QoQ) · free cash flow 41.54% (+399 bp YoY, +775 bp QoQ)
- Cash generation: operating cash flow $1,556.0M · capital expenditure −$28.0M · free cash flow $1,528.0M · free cash flow to net income 123.23%
- Dividend and share count: dividends paid −$281.0M, buybacks −$2,600.0M · diluted shares 291,600,000, −4.24% YoY and −1.32% QoQ
- Balance sheet: cash & short-term investments $2,441.0M · total debt $13.58B · net debt $11.14B · shareholders' equity $19.71B · goodwill and intangibles $39.53B
Since the print: the stock closed at 448.93 the session after the print (2026-10-27) and has drifted lower since, closing at 442.66 as of November 19 — still well inside its 52-week range of 369.69 to 516.89, and now 2.76% above its 50-day average of 430.79.
The quarter in one line: a clean double beat arrived alongside the dataset's first year-over-year revenue decline, and the market's muted −0.38% reaction has not reversed in the more than three weeks since.
Q3 FY2026 flow — where the revenue dollar went
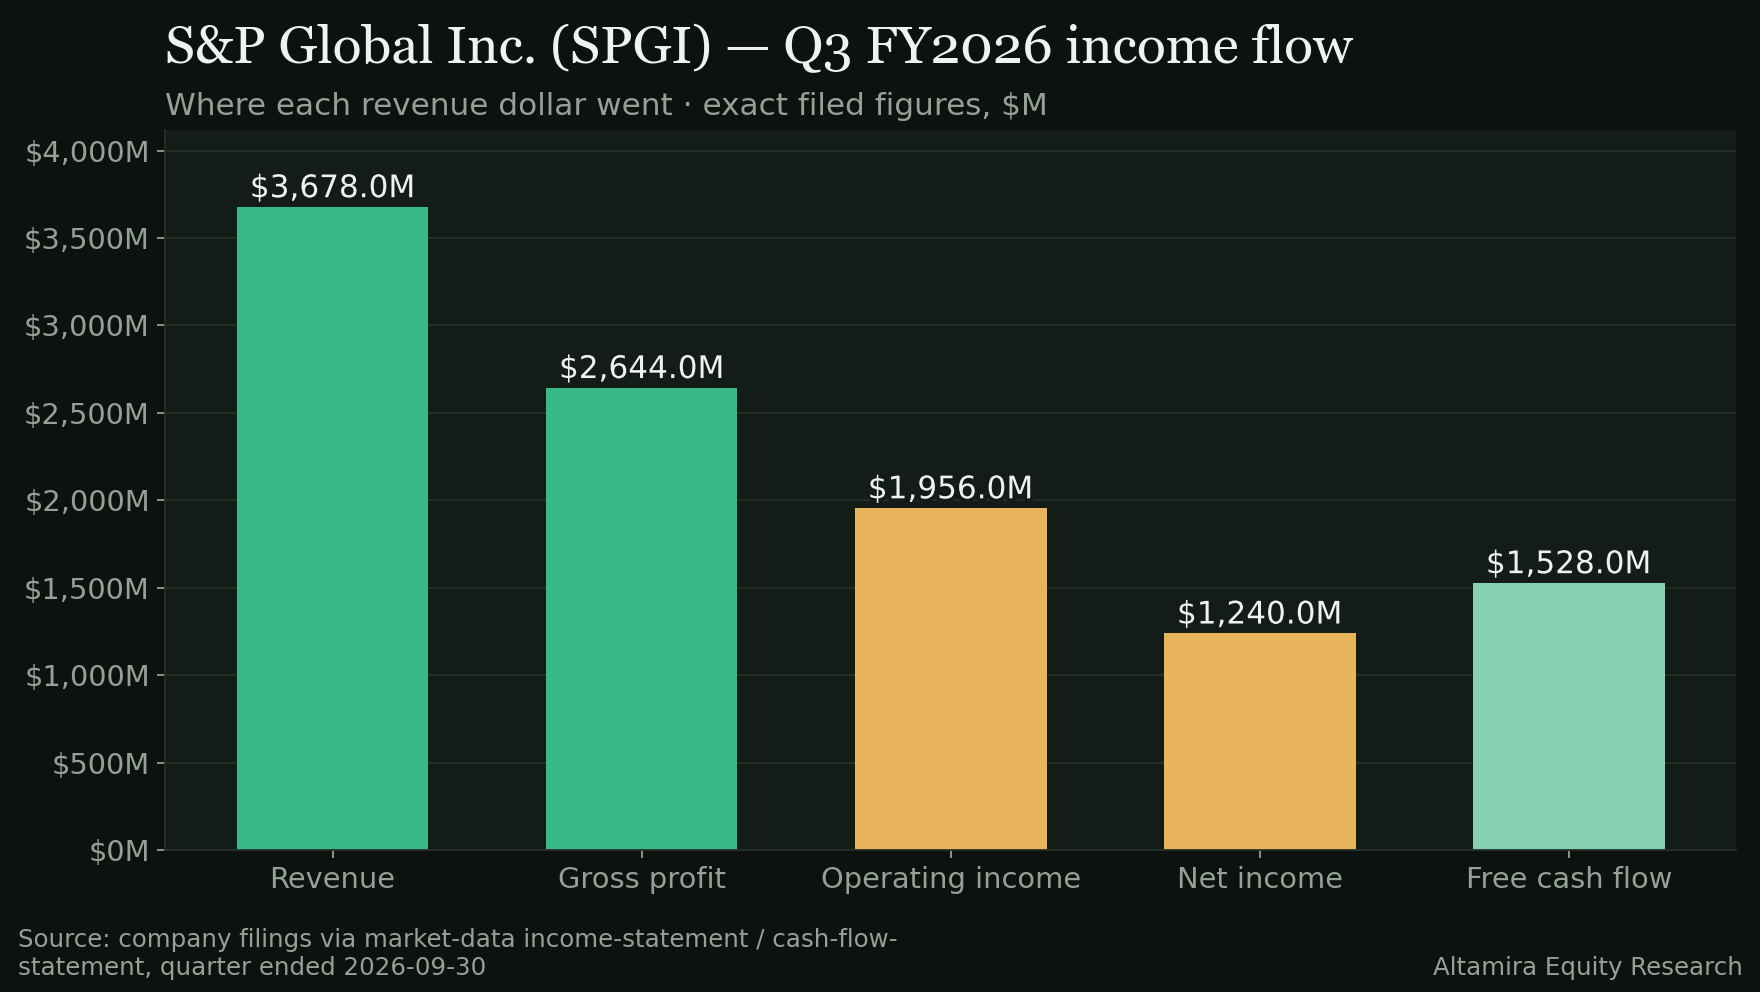
- Revenue: $3,678.0M (100.00%)
- Cost of revenue: $1,034.0M (28.11%)
- Gross profit: $2,644.0M (71.89%)
- SG&A: $660.0M (17.94%) · Other expenses: $28.0M (0.76%)
- Operating expenses: $688.0M (18.71%)
- Operating income: $1,956.0M (53.18%), +16.78% YoY
- Pre-tax income: $1,873.0M (50.92%) · Income tax: $467.0M (12.70%)
- Net income: $1,240.0M (33.71%), +5.44% YoY
The swing item is operating expenses at just $688.0M, 18.71% of revenue — a smaller share of a smaller revenue base than any other quarter in this series, and the main reason gross profit of 71.89% converted into an operating margin of 53.18% rather than something closer to the year-ago quarter's 43.08%.
What to make of this print
- Both headline lines beat even as the top line shrank. Revenue beat by 0.97% and EPS beat by 3.39%, but revenue itself fell 5.40% year over year — the only negative year-over-year print in the eight-quarter surprise history and the nine-quarter series shown in this dataset.
- Operating margin hit a nine-quarter high in the same quarter. 53.18% is up 1,010 basis points year over year and 948 basis points sequentially, clearing every other quarter in the series and every full fiscal year in the five-year annual record.
- Net income grew far more slowly than operating income. Net margin of 33.71% is up 347 basis points year over year, but that trails the 1,010-basis-point operating-margin gain — a gap that sits in the interest-expense and tax lines rather than the operating business.
- Free cash flow comfortably covers net income. $1,528.0M of free cash flow is 123.23% of the $1,240.0M net income figure, and free-cash-flow margin rose 399 basis points year over year to 41.54%.
- Quality of earnings shows heavy buybacks alongside a shrinking share count. Diluted shares fell 4.24% year over year to 291,600,000 on $2,600.0M of buybacks in the quarter — a reduction large enough on its own to lift per-share figures even before any operating improvement.
- The balance sheet carries moderate leverage. Net debt of $11.14B against $19.71B of shareholders' equity leaves meaningful headroom, with $2,441.0M of cash and short-term investments on hand.
- The market's reaction was small and has not reversed. A −0.38% one-day move, a tenth of the eight-quarter average absolute reaction, has been followed by a further drift lower rather than a recovery in the three-plus weeks since.
Takeaway: a revenue line that broke its own growth streak was paired with the strongest margin quarter in this dataset's history, and the market's muted response has, if anything, continued to drift rather than resolve the tension between the two.
The long view — FY2020 to FY2025
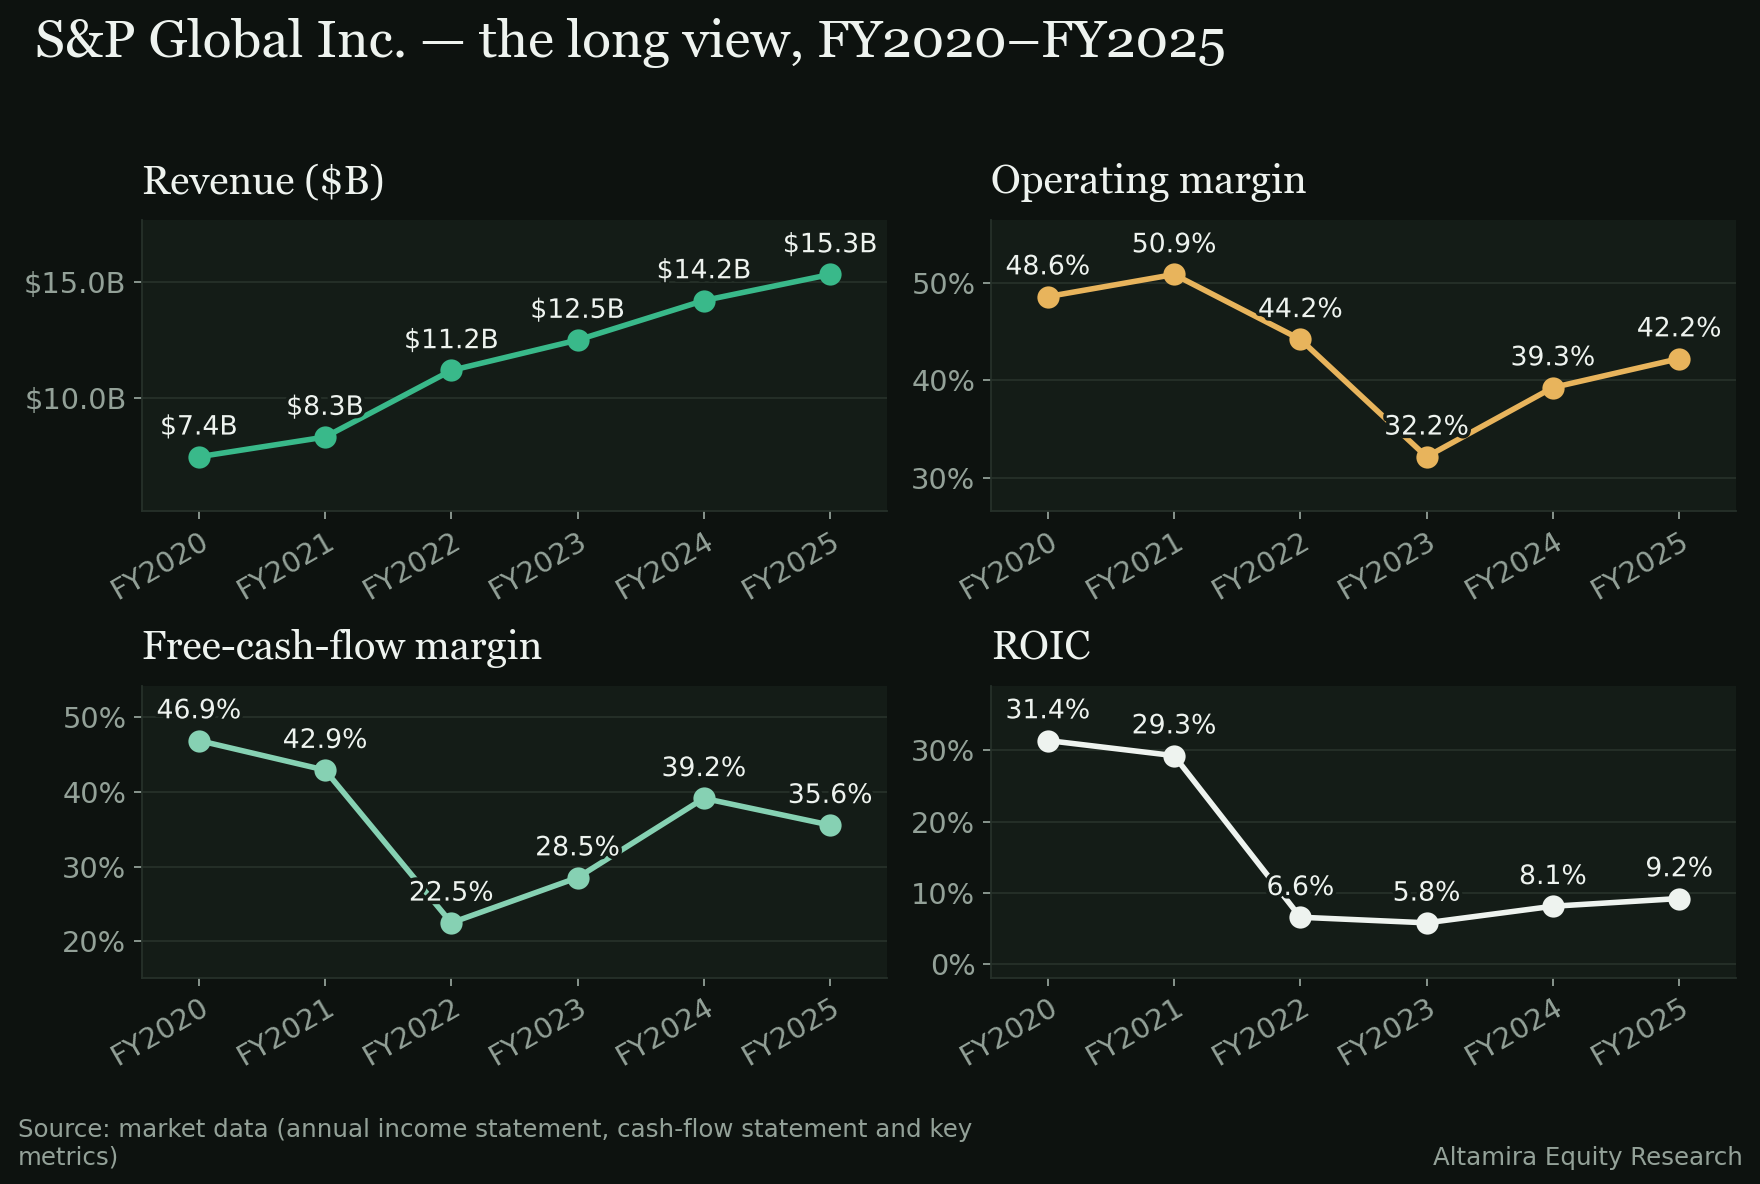
- Revenue growth. $7.44B in FY2020 to $15.34B in FY2025, a 15.56% compound rate, with no annual decline anywhere in the five-year window — the quarterly decline just posted has no precedent in the annual series shown here.
- Operating margin. 48.60% in FY2020 to a trough of 32.17% in FY2023, then recovering to 42.24% in FY2025 — a net decline of 636 basis points across the five years, with this quarter's 53.18% well above every point on that line.
- Cash. Free-cash-flow margin fell from 46.91% in FY2020 to 35.58% in FY2025; free cash flow itself compounded at 9.34% over the period, slower than the 15.56% revenue rate.
- ROIC. 31.37% in FY2020 down to 5.81% in FY2023, then recovering to 9.22% in FY2025 — still less than a third of the FY2020 level, even as the operating-margin recovery over the same two years was proportionally smaller.
The honest counterweight
Three cells argue against reading this quarter's margin strength as the clean story.
- The revenue decline has no precedent in this dataset. Every other quarter and every full fiscal year shown here grew; one quarter is not enough to say whether this is a one-off base effect or the start of a pattern, and the transcript that might explain it is not in this dataset.
- ROIC remains far below its FY2020 level. At 9.22% in FY2025, return on invested capital is less than a third of the 31.37% posted five years earlier, even after the operating-margin recovery of the last two years.
- The margin surge arrived on a shrinking revenue base. A 53.18% operating margin on revenue that fell 5.40% year over year is mathematically easier to produce than the same margin on growing revenue; the quality of this particular expansion cannot be judged without the segment detail this dataset does not carry.
The Key Issue
Whether the February 9, 2027 print — consensus revenue of $3,622.4M (−7.50% YoY implied against the prior-year quarter) and EPS of 4.04 — shows revenue stabilizing or extends the decline just posted, and whether operating margin holds near this quarter's nine-quarter high or reverts toward the prior quarters' levels. That pairing, more than either line alone, is what will decide whether this quarter was a one-off or the start of a new pattern.
Thesis verdict
Intact — grade B. The quarter delivered a clean double beat and the strongest margin reading in this dataset's history, but it also delivered the dataset's only year-over-year revenue decline, and with guidance and segment detail not in the dataset, there isn't yet a basis to call the margin expansion durable rather than a base-effect artifact of the smaller revenue line it sits on.
Sources
- Analyst consensus and the actual-vs-estimate history (eight quarters), the earnings calendar, and daily closes (moving averages, ranges and the day's move computed from them) — market data, pulled November 20, 2026.
- Quarterly and annual income, cash-flow and balance-sheet statements for FY2020–FY2025 — company filings via market data, pulled November 20, 2026.
- Forward analyst estimates and trailing-twelve-month valuation metrics — market data, pulled November 20, 2026.
- Guidance, segment detail and management commentary: NOT STATED — the earnings-call transcript is not in the dataset for this edition.
Research for information only — not investment advice; see Disclosures.
On the data pages
- SPGI company page — the filed figures, margins, cash flow and the print history, from SEC EDGAR.
- SPGI vs ACGL, head to head — the two on the same scorecard cells (top composite in Financial Services (kpi-scorecard-2026-11-19.json)).
- Verdict ledger — every public call, on the record.
- Earnings schedule — who reports next, and how every print this season graded.
Free · one field
Get the next recap the morning after the print Get the next SPGI recap the morning after it reports
Previews before the print, the graded recap after it, and the weekly scorecard. Every verdict stays on the public record.
Free. No positions, no tips. Unsubscribe in one click.
Every verdict, graded on the record
Join free