Deere: The Five-Year Record Shows a Cyclical Trough — the Fair-Value Models Can't Be Read This Edition
Deere grew revenue 7.00% year over year to $12.61B in its latest filed quarter and expanded operating margin 224 basis points to 20.56%, an eighth straight quarter grading A or B on our rubric. The five-year record shows a steeper story: free cash flow compounded at −7.71% a year and ROIC fell from
The story in 30 seconds
Deere grew revenue 7.00% year over year to $12.61B in its latest filed quarter and expanded operating margin 224 basis points to 20.56%, an eighth straight quarter grading A or B on our rubric. The five-year record shows a steeper story: free cash flow compounded at −7.71% a year and ROIC fell from


Revenue +7.00% YoY to $12.61B · operating margin +224 bp to 20.56% · ROIC 22.11% (TTM), up from a FY2025 trough of 7.13% · an eighth straight A/B quarter on our rubric
The story in 30 seconds
- Deere & Company's latest filed quarter extended a long run of clean prints: revenue of $12.61B grew 7.00% year over year and beat its estimate by 16.58%, operating margin expanded 224 basis points to 20.56%, and the quarter graded A — the eighth consecutive print on the company's record to grade A or B.
- The five-year record behind that run is more cyclical than the recent streak suggests: free cash flow compounded at −7.71% a year from FY2020 to FY2025, and ROIC fell from a FY2023 peak of 12.58% to a FY2025 trough of 7.13%, before recovering to 22.11% on a trailing-twelve-month basis.
- The open question this edition cannot answer cleanly is valuation: the KPI Scorecard's own published DCF fair-value cells for Deere do not reconcile with the 653.99 close, a data gap we flag below rather than quote as a signal.
Deere & Company's fundamental composite on the Altamira KPI Scorecard is 43.2, built from a growth pillar of 28.9 and a health pillar of just 4.9 — the weakest cell on the entire sheet — against a value pillar of 61.3 and shareholder pillar of 63.2. The same edition scores the stock's technical state at 81.2 and labels it UPTREND, producing a blended total of 54.6, tier 4, grade C. A reader looking only at the earnings record — eight straight A/B prints, an average EPS surprise of +11.09% over that stretch — would call this one of the more reliable reporters on the sheet; a reader looking only at the health pillar would flag it as the weakest fundamental cell the scorecard carries. Both readings use real numbers, and the five-year record below is where that gap starts.
Deere manufactures and distributes agricultural, turf, construction and forestry equipment across four segments: Production and Precision Agriculture, Small Agriculture and Turf, Construction and Forestry, and Financial Services. The business is structurally cyclical — agricultural equipment demand tracks farm income and commodity prices — and the five-year record below shows that cyclicality directly in the cash and returns-on-capital lines, even as the income-statement margin line has moved the other way.
In this post: (1) how the business made money in the latest filed quarter; (2) the five-year record across four lenses, including the FCF and ROIC trough; (3) what the cash and share-count lines say about the quality of the earnings; (4) why this edition is not quoting a fair-value comparison, and what that gap means; (5) the scorecard's own read, pillar by pillar; (6) the honest counterweight and the Key Issue ahead of the November 25 print.
How Deere makes money
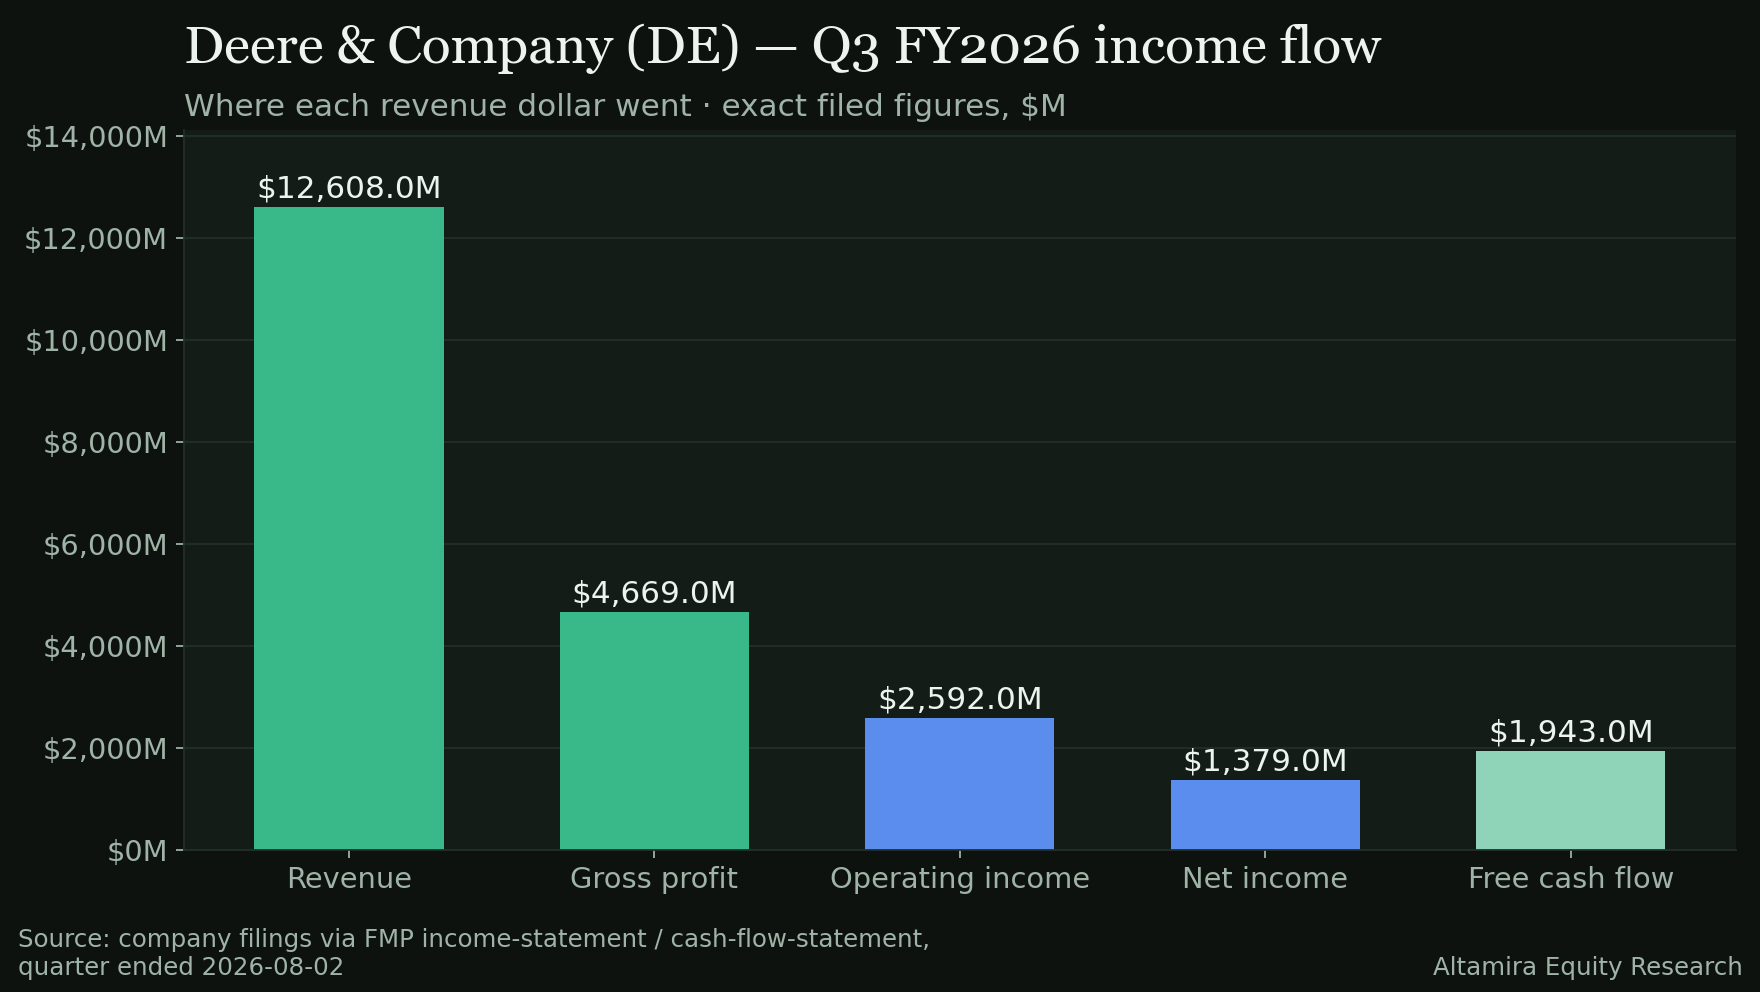
In the latest filed quarter, Q3 FY2026 (period ended August 2, 2026): revenue of $12.61B, up 7.00% year over year but down 5.69% sequentially. Cost of revenue was $7,939.0M (62.97% of revenue), leaving a gross profit of $4,669.0M (37.03%). Operating expenses were $2,077.0M (16.47%) — R&D of $567.0M (4.50%), SG&A of $1,220.0M (9.68%) and other expenses of $290.0M (2.30%) — producing operating income of $2,592.0M, a 20.56% operating margin, up 20.06% year over year. Interest expense was $710.0M (5.63% of revenue, a cost line worth naming on an industrial balance sheet this leveraged); pre-tax income was $1,882.0M (14.93%); income tax of $529.0M (4.20%) left net income of $1,379.0M, a 10.94% net margin. Free cash flow was $1,943.0M, 15.41% of revenue.
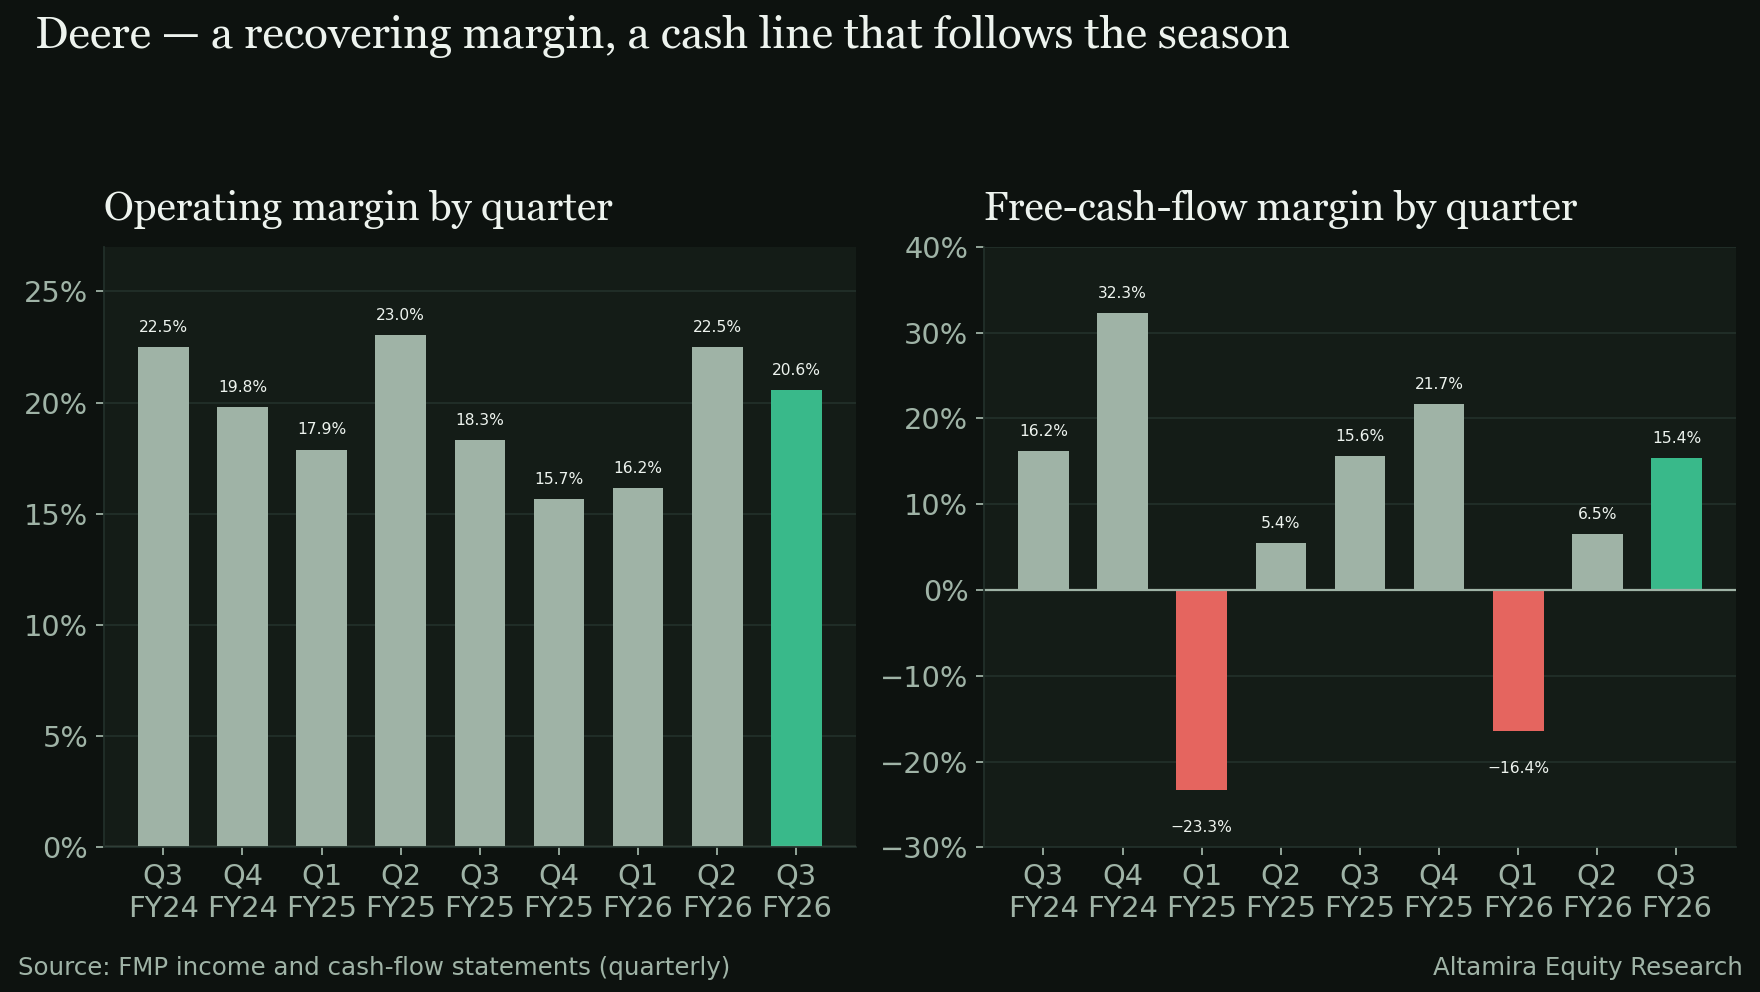
The swing line sequentially is free-cash-flow margin, up 887 basis points quarter over quarter even as operating margin fell 192 basis points over the same stretch — a reminder that Deere's cash generation and its income-statement margin do not always move together quarter to quarter.
The long view — FY2020 to FY2025
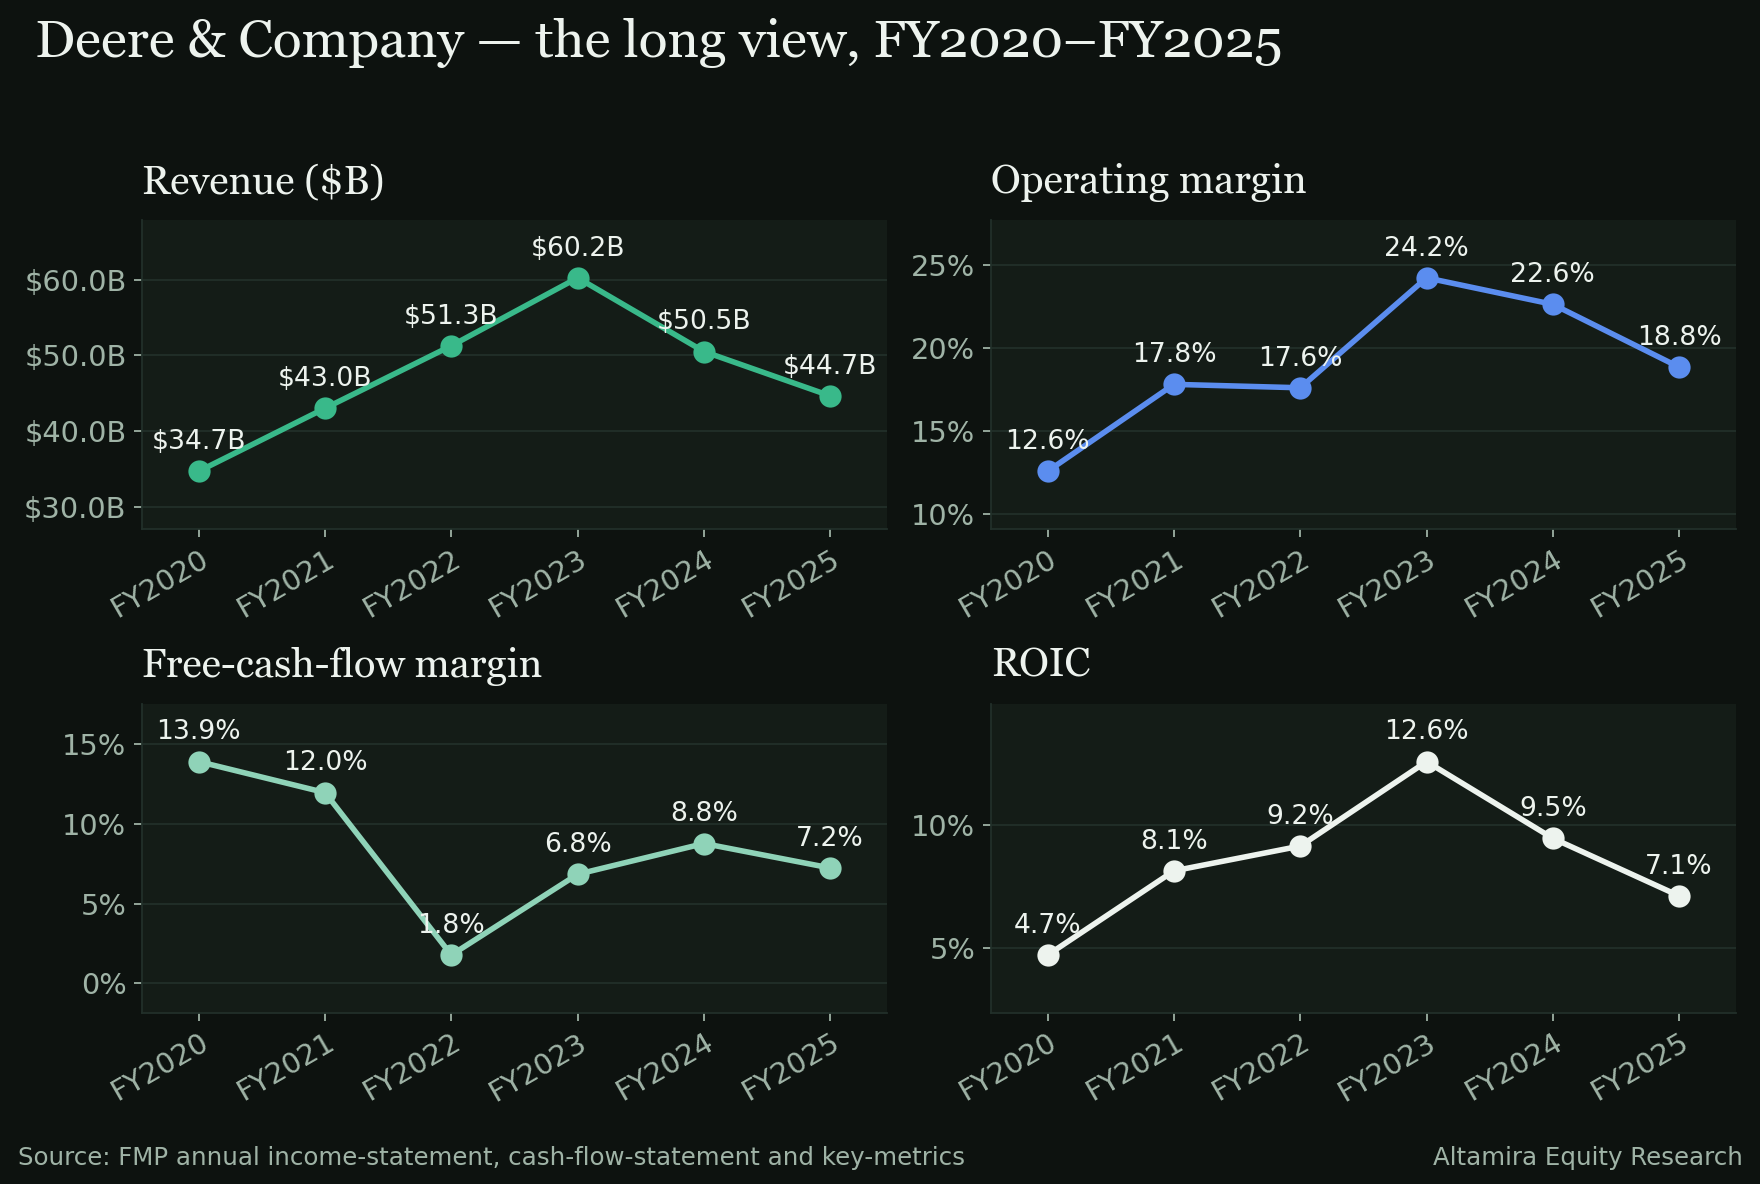
- Revenue growth. $34.72B in FY2020 to $44.66B in FY2025, a 5.17% compound rate — but not a straight line: revenue peaked at $60.25B in FY2023 before falling to $50.52B in FY2024 and $44.66B in FY2025, a two-year decline of 25.88% from the FY2023 peak.
- Operating margin. 12.58% (FY2020) to 17.81% (FY2021) to 17.60% (FY2022) to a peak of 24.22% (FY2023) to 22.62% (FY2024) to 18.84% (FY2025) — a net +626 bp move over the five years, but down 538 bp from the FY2023 peak of 24.22%.
- Cash. Free cash flow fell from $4.83B in FY2020 to $3.23B in FY2025, a −7.71% compound rate, with FCF margin swinging from 13.90% (FY2020) up to 6.84% (FY2023) and back to 7.23% (FY2025) — the least linear of the four lenses.
- Returns on capital. ROIC rose from 4.73% in FY2020 to a FY2023 peak of 12.58%, then fell to 9.47% in FY2024 and 7.13% in FY2025 — a round trip that the trailing-twelve-month figure of 22.11% has since reversed sharply, well above every one of the five annual figures shown.
Quality of earnings
Free cash flow of $1,943.0M in the latest quarter was 140.90% of net income of $1,379.0M — cash generation ran well ahead of the accounting earnings line, with operating cash flow of $2,208.0M funding just $265.0M of capital expenditure. Diluted share count was 270,700,000, down 0.26% year over year and 0.04% sequentially — a shrinking count, alongside dividends paid of $438.0M and buybacks of $197.0M in the quarter.
The balance sheet carries the leverage a financial-services segment implies: cash and short-term investments of $10.28B against total debt of $64.18B and net debt of $55.25B, with shareholders' equity of $27.99B. Net debt exceeds equity by roughly two times, and the trailing net debt/EBITDA of 4.72 is the highest leverage ratio on this pack — a structural feature of Deere's captive-finance arm (Financial Services), not a one-quarter event, but one worth naming plainly against the health pillar's score below.
Valuation — a gap this edition is flagging, not a signal
The Altamira KPI Scorecard's published fair-value cells for Deere do not reconcile with the 653.99 close on November 16, 2026. The one cell the pack renders in its comparison table — FMP's DCF at 7.59 (as of November 14, 2026) — sits so far below the current price that the implied spread (the close more than 86 times the model's own figure) is not a plausible read of a profitable, dividend-paying industrial company; the scorecard's separate in-house DCF cell for Deere is negative, which a discounted-cash-flow model should not produce for a company with positive free cash flow in every one of the last five fiscal years shown above. Both figures are in the dataset, but neither is usable as a fair-value comparison this edition — a modeling gap, not a market signal, and we are naming it rather than quoting a percentage built on it (house rule: the gap is part of the story). On a trailing basis the stock trades at a P/E of 37.05 (quote) to 36.25 (TTM key metrics) with a free-cash-flow yield of 2.19% and a trailing ROIC of 22.11%.
The scorecard read
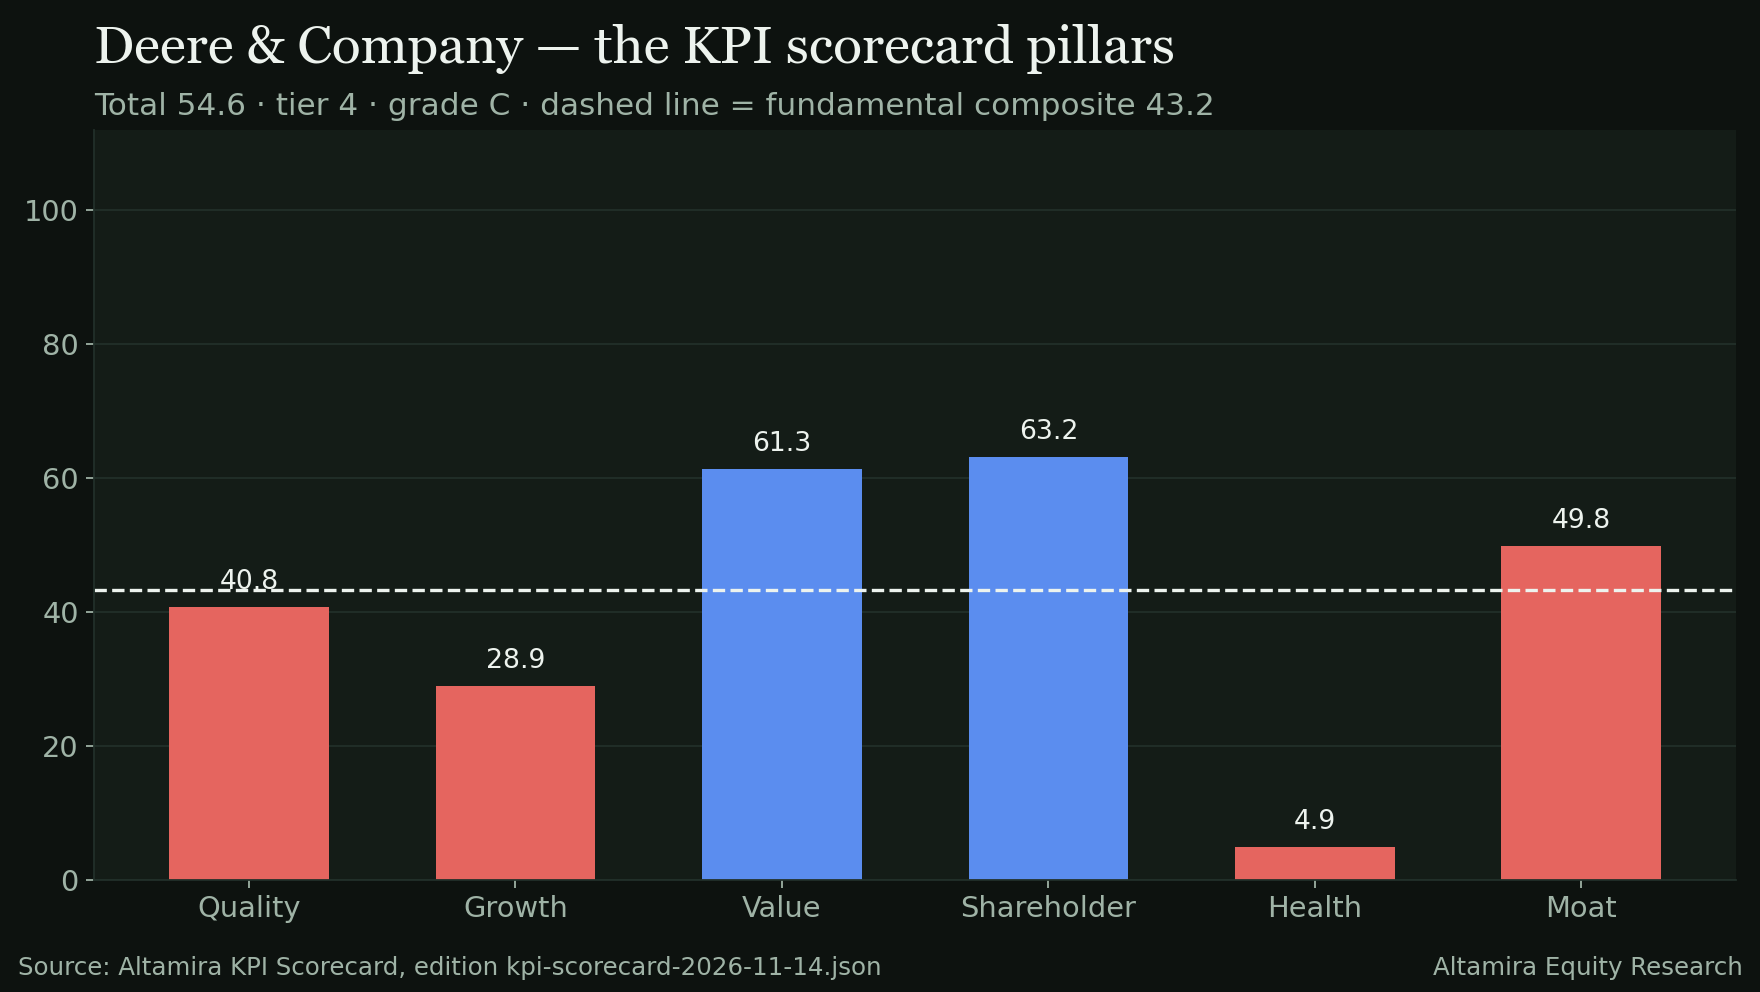
The November 14, 2026 edition of the Altamira KPI Scorecard has Deere at a fundamental composite of 43.2 — value the strongest pillar at 61.3, shareholder next at 63.2, moat at 49.8, quality at 40.8, growth at 28.9, and health the clear weakest at 4.9. The technical score is 81.2, producing a blended total of 54.6, tier 4, grade C, state UPTREND, rank 211 with a one-day delta of +3.9. The technical score sits far above every fundamental pillar; that gap is the single largest reason the blended total sits above the fundamental composite, the mirror image of a scorecard where the fundamentals outrun the tape.
The honest counterweight
Three cells argue against reading the recent earnings streak as the full story.
- The health pillar is the weakest cell on the sheet, at 4.9. Net debt of $55.25B against equity of $27.99B and a trailing net debt/EBITDA of 4.72 are the leverage figures behind that score — a captive-finance structure that is normal for this business but is not a clean balance sheet by scorecard standards.
- Free cash flow and ROIC both show a cyclical trough inside the five-year window, not a straight climb. FCF compounded at −7.71% a year FY2020–FY2025, and ROIC fell from 12.58% (FY2023) to 7.13% (FY2025) before the trailing-twelve-month recovery to 22.11% — the recent streak of A/B prints sits on top of that more volatile longer record.
- The published fair-value cells for this name are not usable this edition. Readers who want a margin-of-safety comparison for Deere should treat that as NOT STATED here rather than infer one from the single, unreconciled DCF figure in the pack.
The Key Issue
Whether the operating-margin and ROIC strength in the last several quarters (20.56% operating margin, 22.11% trailing ROIC) is the start of a sustained recovery from the FY2024–FY2025 trough, or another phase of the same cyclicality the five-year free-cash-flow and ROIC lines already show. The November 25, 2026 print — consensus revenue of $10.40B (−13.97% QoQ implied) and EPS of 4.03 — lands against a sequential guidance season where the agricultural-equipment cycle, not the headline beat/miss, is the cell to watch.
Sources
- FMP /stable/earnings (actuals vs consensus, eight quarters), /historical/earning_calendar/DE (report timing), /historical-price-full/DE (daily closes; moving averages and ranges computed from them) — pulled November 17, 2026.
- FMP /income-statement, /cash-flow-statement, /balance-sheet-statement (quarterly; the Q3 FY2026 statements filed August 27, 2026) and the annual statements plus /key-metrics for FY2020–FY2025 — pulled November 17, 2026.
- FMP /analyst-estimates and /key-metrics-ttm — pulled November 17, 2026.
- Altamira KPI Scorecard, edition 2026-11-14 (kpi-scorecard-2026-11-14.json): composite, pillar and technical scores, tier, state and fair-value cells as published. The scorecard's DCF fair-value cells for this name did not reconcile with the current price this edition and are flagged above as a gap, not quoted as a valuation comparison.
- Guidance, segment detail and management commentary: NOT STATED — the earnings-call transcript is not in the dataset for this edition.
Research for information only — not investment advice; see Disclosures.
On the data pages
- DE company page — the filed figures, margins, cash flow and the print history, from SEC EDGAR.
- DE vs FIX, head to head — the two on the same scorecard cells (top composite in Industrials (kpi-scorecard-2026-11-14.json)).
- Verdict ledger — every public call, on the record.
- Earnings schedule — who reports next, and how every print this season graded.
Free · one field
Get the next recap the morning after the print Get the next DE recap the morning after it reports
Previews before the print, the graded recap after it, and the weekly scorecard. Every verdict stays on the public record.
Free. No positions, no tips. Unsubscribe in one click.
Every verdict, graded on the record
Join free